Reported Tuberculosis in the United States, 2019
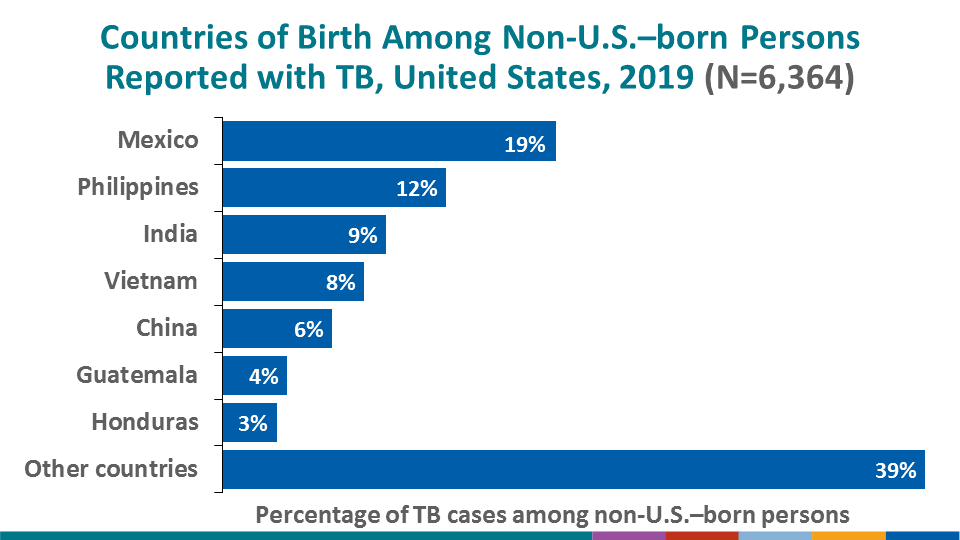
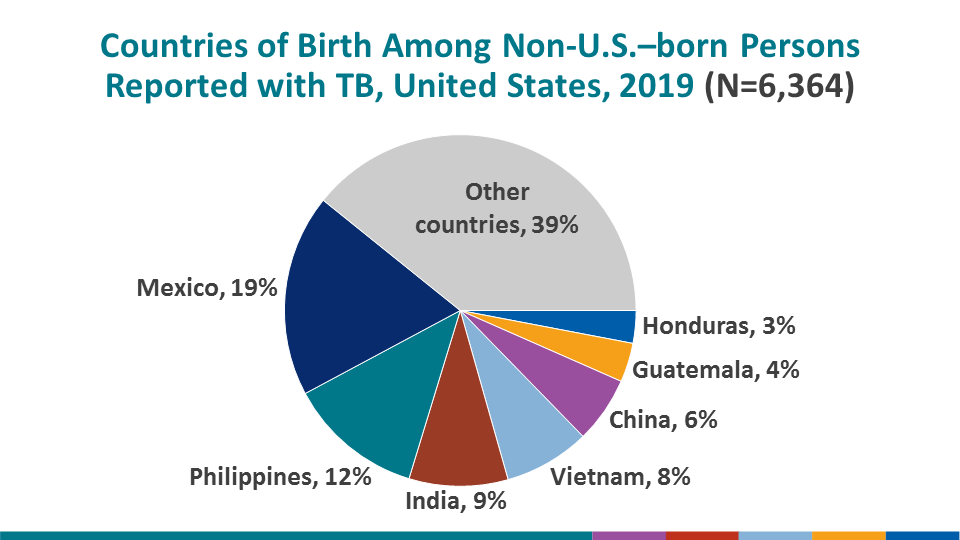
Table 6A. Tuberculosis Cases and Percentages Among Non-U.S.–Born Persons1 by the Top 30 Countries2 of Birth: United States, 2015–2019
See Surveillance Slides #11 and #12
| Country of Birth | Year | |||||||||
|---|---|---|---|---|---|---|---|---|---|---|
| 2019 | 2018 | 2017 | 2016 | 2015 | ||||||
| No. | (%) | No. | (%) | No. | (%) | No. | (%) | No. | (%) | |
| Total Cases | 6,364 | (100.0) | 6,364 | (100.0) | 6,408 | (100.0) | 6,362 | (100.0) | 6,404 | (100.0) |
| Mexico | 1,181 | (18.6) | 1,206 | (19.0) | 1,218 | (19.0) | 1,192 | (18.7) | 1,253 | (19.6) |
| Philippines | 793 | (12.5) | 779 | (12.2) | 794 | (12.4) | 792 | (12.4) | 818 | (12.8) |
| India | 582 | (9.1) | 628 | (9.9) | 602 | (9.4) | 588 | (9.2) | 577 | (9.0) |
| Vietnam | 505 | (7.9) | 509 | (8.0) | 534 | (8.3) | 492 | (7.7) | 521 | (8.1) |
| China | 391 | (6.1) | 379 | (6.0) | 404 | (6.3) | 382 | (6.0) | 424 | (6.6) |
| Guatemala | 232 | (3.6) | 210 | (3.3) | 180 | (2.8) | 190 | (3.0) | 187 | (2.9) |
| Haiti | 161 | (2.5) | 131 | (2.1) | 163 | (2.5) | 169 | (2.7) | 167 | (2.6) |
| Honduras | 193 | (3.0) | 145 | (2.3) | 131 | (2.0) | 148 | (2.3) | 140 | (2.2) |
| Ethiopia | 139 | (2.2) | 150 | (2.4) | 153 | (2.4) | 148 | (2.3) | 142 | (2.2) |
| Myanmar | 104 | (1.6) | 108 | (1.7) | 121 | (1.9) | 128 | (2.0) | 122 | (1.9) |
| El Salvador | 98 | (1.5) | 109 | (1.7) | 99 | (1.5) | 118 | (1.9) | 108 | (1.7) |
| Pakistan | 110 | (1.7) | 105 | (1.6) | 88 | (1.4) | 84 | (1.3) | 85 | (1.3) |
| Nepal | 97 | (1.5) | 98 | (1.5) | 81 | (1.3) | 103 | (1.6) | 79 | (1.2) |
| Korea, Republic of | 94 | (1.5) | 82 | (1.3) | 89 | (1.4) | 96 | (1.5) | 90 | (1.4) |
| Somalia | 65 | (1.0) | 72 | (1.1) | 99 | (1.5) | 100 | (1.6) | 84 | (1.3) |
| Nigeria | 67 | (1.1) | 73 | (1.1) | 85 | (1.3) | 91 | (1.4) | 74 | (1.2) |
| Cambodia | 96 | (1.5) | 67 | (1.1) | 63 | (1.0) | 66 | (1.0) | 87 | (1.4) |
| Peru | 81 | (1.3) | 78 | (1.2) | 63 | (1.0) | 67 | (1.1) | 82 | (1.3) |
| Ecuador | 58 | (0.9) | 77 | (1.2) | 82 | (1.3) | 69 | (1.1) | 71 | (1.1) |
| Bangladesh | 63 | (1.0) | 61 | (1.0) | 71 | (1.1) | 60 | (0.9) | 67 | (1.0) |
| Laos | 53 | (0.8) | 54 | (0.8) | 72 | (1.1) | 69 | (1.1) | 68 | (1.1) |
| Dominican Republic | 59 | (0.9) | 56 | (0.9) | 69 | (1.1) | 61 | (1.0) | 64 | (1.0) |
| Kenya | 57 | (0.9) | 53 | (0.8) | 47 | (0.7) | 46 | (0.7) | 49 | (0.8) |
| Colombia | 50 | (0.8) | 47 | (0.7) | 37 | (0.6) | 50 | (0.8) | 45 | (0.7) |
| Bhutan | 32 | (0.5) | 43 | (0.7) | 53 | (0.8) | 30 | (0.5) | 46 | (0.7) |
| Congo | 40 | (0.6) | 43 | (0.7) | 39 | (0.6) | 36 | (0.6) | 38 | (0.6) |
| Marshall Islands | 45 | (0.7) | 38 | (0.6) | 47 | (0.7) | 24 | (0.4) | 27 | (0.4) |
| Thailand | 31 | (0.5) | 32 | (0.5) | 36 | (0.6) | 43 | (0.7) | 39 | (0.6) |
| Afghanistan | 42 | (0.7) | 39 | (0.6) | 38 | (0.6) | 31 | (0.5) | 26 | (0.4) |
| Indonesia | 29 | (0.5) | 33 | (0.5) | 28 | (0.4) | 40 | (0.6) | 38 | (0.6) |
| All Others3 | 816 | (12.9) | 859 | (13.6) | 822 | (12.8) | 849 | (13.4) | 786 | (12.3) |
1Includes persons born outside the United States (including U.S. territories), except persons born to at least one U.S. citizen parent.
2The top 30 countries were selected based on their ranked 5-year average number of TB cases.
3Includes not specified for country of origin.
Note: Data for all years updated through June 10, 2020. Countries are in descending order by total case count for all years combined.