Reported Tuberculosis in the United States, 2019
Table 37. Tuberculosis Cases and Percentages, by Residence in and Type of Correctional Facilities1, Ages ≥15 Years: Reporting Areas, 2019
See Surveillance Slide #45 and #47
| Reporting Area | Total Cases | Cases with Information on Residence in Correctional Facilities | Cases Reported as Residents of Correctional Facilities2 | Federal Prison | State Prison | Local Jail | Juvenile Facility3 | Other Type of Facility | Unknown/Missing | Cases with Information on ICE Custody4 | Cases Under ICE Custody | ||||||||||
|---|---|---|---|---|---|---|---|---|---|---|---|---|---|---|---|---|---|---|---|---|---|
| No. | (%) | No. | (%) | No. | (%) | No. | (%) | No. | (%) | No. | (%) | No. | (%) | No. | (%) | No. | (%) | No. | (%) | ||
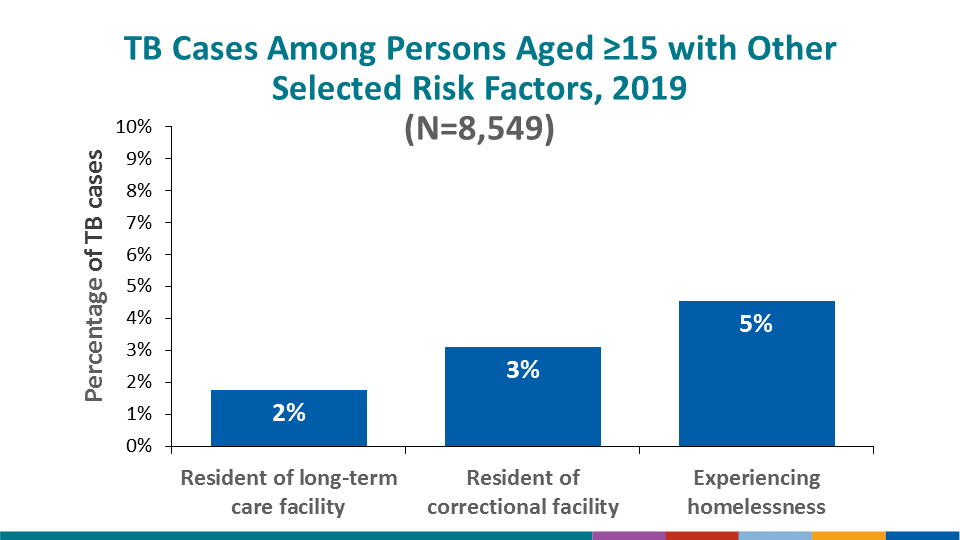
| United States | 8,549 | 8,438 | (98.7) | 265 | (3.1) | 37 | (14.0) | 41 | (15.5) | 74 | (27.9) | 0 | (0.0) | 105 | (39.6) | 8 | (3.0) | 260 | (98.1) | 119 | (45.8) |
| Alabama | 86 | 86 | (100.0) | 0 | (0.0) | 0 | … | 0 | … | 0 | … | 0 | … | 0 | … | 0 | … | 0 | … | 0 | … |
| Alaska | 50 | 50 | (100.0) | 1 | (2.0) | 0 | (0.0) | 0 | (0.0) | 1 | (100.0) | 0 | (0.0) | 0 | (0.0) | 0 | (0.0) | 1 | (100.0) | 0 | (0.0) |
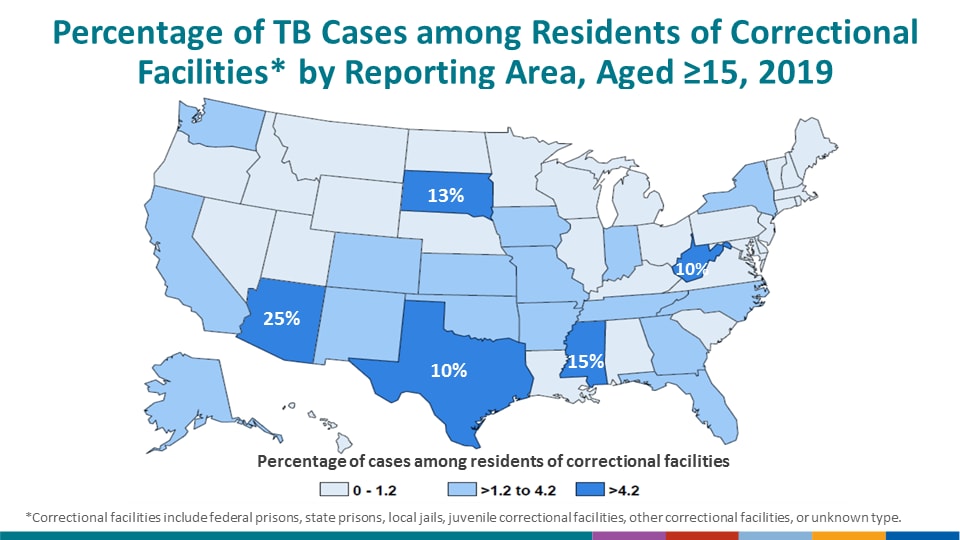
| Arizona | 170 | 170 | (100.0) | 43 | (25.3) | 1 | (2.3) | 2 | (4.7) | 1 | (2.3) | 0 | (0.0) | 39 | (90.7) | 0 | (0.0) | 43 | (100.0) | 26 | (60.5) |
| Arkansas | 55 | 55 | (100.0) | 1 | (1.8) | 0 | (0.0) | 1 | (100.0) | 0 | (0.0) | 0 | (0.0) | 0 | (0.0) | 0 | (0.0) | 1 | (100.0) | 0 | (0.0) |
| California | 2,058 | 2,054 | (99.8) | 50 | (2.4) | 10 | (20.0) | 1 | (2.0) | 22 | (44.0) | 0 | (0.0) | 17 | (34.0) | 0 | (0.0) | 50 | (100.0) | 22 | (44.0) |
| Colorado | 60 | 60 | (100.0) | 1 | (1.7) | 0 | (0.0) | 0 | (0.0) | 0 | (0.0) | 0 | (0.0) | 1 | (100.0) | 0 | (0.0) | 1 | (100.0) | 1 | (100.0) |
| Connecticut | 66 | 66 | (100.0) | 0 | (0.0) | 0 | … | 0 | … | 0 | … | 0 | … | 0 | … | 0 | … | 0 | … | 0 | … |
| Delaware | 16 | 16 | (100.0) | 0 | (0.0) | 0 | … | 0 | … | 0 | … | 0 | … | 0 | … | 0 | … | 0 | … | 0 | … |
| District of Columbia | 24 | 24 | (100.0) | 1 | (4.2) | 0 | (0.0) | 0 | (0.0) | 1 | (100.0) | 0 | (0.0) | 0 | (0.0) | 0 | (0.0) | 1 | (100.0) | 1 | (100.0) |
| Florida | 537 | 537 | (100.0) | 8 | (1.5) | 0 | (0.0) | 3 | (37.5) | 5 | (62.5) | 0 | (0.0) | 0 | (0.0) | 0 | (0.0) | 8 | (100.0) | 1 | (12.5) |
| Georgia | 278 | 269 | (96.8) | 11 | (4.1) | 0 | (0.0) | 0 | (0.0) | 4 | (36.4) | 0 | (0.0) | 7 | (63.6) | 0 | (0.0) | 11 | (100.0) | 7 | (63.6) |
| Hawaii | 95 | 95 | (100.0) | 0 | (0.0) | 0 | … | 0 | … | 0 | … | 0 | … | 0 | … | 0 | … | 0 | … | 0 | … |
| Idaho | 7 | 6 | (85.7) | 0 | (0.0) | 0 | … | 0 | … | 0 | … | 0 | … | 0 | … | 0 | … | 0 | … | 0 | … |
| Illinois | 308 | 307 | (99.7) | 2 | (0.7) | 0 | (0.0) | 0 | (0.0) | 2 | (100.0) | 0 | (0.0) | 0 | (0.0) | 0 | (0.0) | 2 | (100.0) | 0 | (0.0) |
| Indiana | 106 | 106 | (100.0) | 4 | (3.8) | 0 | (0.0) | 1 | (25.0) | 1 | (25.0) | 0 | (0.0) | 2 | (50.0) | 0 | (0.0) | 4 | (100.0) | 2 | (50.0) |
| Iowa | 49 | 49 | (100.0) | 1 | (2.0) | 0 | (0.0) | 0 | (0.0) | 1 | (100.0) | 0 | (0.0) | 0 | (0.0) | 0 | (0.0) | 1 | (100.0) | 1 | (100.0) |
| Kansas | 35 | 34 | (97.1) | 1 | (2.9) | 0 | (0.0) | 0 | (0.0) | 1 | (100.0) | 0 | (0.0) | 0 | (0.0) | 0 | (0.0) | 1 | (100.0) | 1 | (100.0) |
| Kentucky | 65 | 65 | (100.0) | 0 | (0.0) | 0 | … | 0 | … | 0 | … | 0 | … | 0 | … | 0 | … | 0 | … | 0 | … |
| Louisiana | 83 | 82 | (98.8) | 1 | (1.2) | 0 | (0.0) | 0 | (0.0) | 1 | (100.0) | 0 | (0.0) | 0 | (0.0) | 0 | (0.0) | 1 | (100.0) | 0 | (0.0) |
| Maine | 18 | 18 | (100.0) | 0 | (0.0) | 0 | … | 0 | … | 0 | … | 0 | … | 0 | … | 0 | … | 0 | … | 0 | … |
| Maryland | 203 | 203 | (100.0) | 2 | (1.0) | 0 | (0.0) | 1 | (50.0) | 1 | (50.0) | 0 | (0.0) | 0 | (0.0) | 0 | (0.0) | 2 | (100.0) | 0 | (0.0) |
| Massachusetts | 173 | 172 | (99.4) | 0 | (0.0) | 0 | … | 0 | … | 0 | … | 0 | … | 0 | … | 0 | … | 0 | … | 0 | … |
| Michigan | 123 | 123 | (100.0) | 1 | (0.8) | 0 | (0.0) | 0 | (0.0) | 1 | (100.0) | 0 | (0.0) | 0 | (0.0) | 0 | (0.0) | 1 | (100.0) | 0 | (0.0) |
| Minnesota | 141 | 141 | (100.0) | 1 | (0.7) | 0 | (0.0) | 0 | (0.0) | 1 | (100.0) | 0 | (0.0) | 0 | (0.0) | 0 | (0.0) | 1 | (100.0) | 0 | (0.0) |
| Mississippi | 52 | 52 | (100.0) | 8 | (15.4) | 5 | (62.5) | 1 | (12.5) | 2 | (25.0) | 0 | (0.0) | 0 | (0.0) | 0 | (0.0) | 8 | (100.0) | 2 | (25.0) |
| Missouri | 68 | 64 | (94.1) | 1 | (1.6) | 0 | (0.0) | 0 | (0.0) | 0 | (0.0) | 0 | (0.0) | 0 | (0.0) | 1 | (100.0) | 0 | (0.0) | 0 | … |
| Montana | 2 | 2 | (100.0) | 0 | (0.0) | 0 | … | 0 | … | 0 | … | 0 | … | 0 | … | 0 | … | 0 | … | 0 | … |
| Nebraska | 15 | 15 | (100.0) | 0 | (0.0) | 0 | … | 0 | … | 0 | … | 0 | … | 0 | … | 0 | … | 0 | … | 0 | … |
| Nevada | 52 | 52 | (100.0) | 0 | (0.0) | 0 | … | 0 | … | 0 | … | 0 | … | 0 | … | 0 | … | 0 | … | 0 | … |
| New Hampshire | 6 | 6 | (100.0) | 0 | (0.0) | 0 | … | 0 | … | 0 | … | 0 | … | 0 | … | 0 | … | 0 | … | 0 | … |
| New Jersey | 300 | 300 | (100.0) | 1 | (0.3) | 0 | (0.0) | 1 | (100.0) | 0 | (0.0) | 0 | (0.0) | 0 | (0.0) | 0 | (0.0) | 1 | (100.0) | 0 | (0.0) |
| New Mexico | 41 | 41 | (100.0) | 1 | (2.4) | 0 | (0.0) | 0 | (0.0) | 0 | (0.0) | 0 | (0.0) | 1 | (100.0) | 0 | (0.0) | 1 | (100.0) | 0 | (0.0) |
| New York State5 | 182 | 180 | (98.9) | 4 | (2.2) | 0 | (0.0) | 0 | (0.0) | 0 | (0.0) | 0 | (0.0) | 0 | (0.0) | 4 | (100.0) | 4 | (100.0) | 3 | (75.0) |
| New York City | 554 | 544 | (98.2) | 6 | (1.1) | 0 | (0.0) | 0 | (0.0) | 3 | (50.0) | 0 | (0.0) | 1 | (16.7) | 2 | (33.3) | 5 | (83.3) | 1 | (20.0) |
| North Carolina | 179 | 179 | (100.0) | 4 | (2.2) | 0 | (0.0) | 3 | (75.0) | 1 | (25.0) | 0 | (0.0) | 0 | (0.0) | 0 | (0.0) | 4 | (100.0) | 0 | (0.0) |
| North Dakota | 18 | 18 | (100.0) | 0 | (0.0) | 0 | … | 0 | … | 0 | … | 0 | … | 0 | … | 0 | … | 0 | … | 0 | … |
| Ohio | 143 | 143 | (100.0) | 1 | (0.7) | 0 | (0.0) | 0 | (0.0) | 1 | (100.0) | 0 | (0.0) | 0 | (0.0) | 0 | (0.0) | 1 | (100.0) | 1 | (100.0) |
| Oklahoma | 70 | 69 | (98.6) | 1 | (1.4) | 0 | (0.0) | 0 | (0.0) | 1 | (100.0) | 0 | (0.0) | 0 | (0.0) | 0 | (0.0) | 1 | (100.0) | 1 | (100.0) |
| Oregon | 65 | 65 | (100.0) | 0 | (0.0) | 0 | … | 0 | … | 0 | … | 0 | … | 0 | … | 0 | … | 0 | … | 0 | … |
| Pennsylvania | 193 | 193 | (100.0) | 0 | (0.0) | 0 | … | 0 | … | 0 | … | 0 | … | 0 | … | 0 | … | 0 | … | 0 | … |
| Rhode Island | 14 | 14 | (100.0) | 0 | (0.0) | 0 | … | 0 | … | 0 | … | 0 | … | 0 | … | 0 | … | 0 | … | 0 | … |
| South Carolina | 78 | 77 | (98.7) | 0 | (0.0) | 0 | … | 0 | … | 0 | … | 0 | … | 0 | … | 0 | … | 0 | … | 0 | … |
| South Dakota | 16 | 16 | (100.0) | 2 | (12.5) | 0 | (0.0) | 1 | (50.0) | 1 | (50.0) | 0 | (0.0) | 0 | (0.0) | 0 | (0.0) | 2 | (100.0) | 0 | (0.0) |
| Tennessee | 121 | 121 | (100.0) | 4 | (3.3) | 0 | (0.0) | 1 | (25.0) | 3 | (75.0) | 0 | (0.0) | 0 | (0.0) | 0 | (0.0) | 4 | (100.0) | 0 | (0.0) |
| Texas | 1,090 | 1,016 | (93.2) | 99 | (9.7) | 20 | (20.2) | 25 | (25.3) | 19 | (19.2) | 0 | (0.0) | 34 | (34.3) | 1 | (1.0) | 96 | (97.0) | 46 | (47.9) |
| Utah | 24 | 24 | (100.0) | 0 | (0.0) | 0 | … | 0 | … | 0 | … | 0 | … | 0 | … | 0 | … | 0 | … | 0 | … |
| Vermont | 4 | 4 | (100.0) | 0 | (0.0) | 0 | … | 0 | … | 0 | … | 0 | … | 0 | … | 0 | … | 0 | … | 0 | … |
| Virginia | 180 | 180 | (100.0) | 0 | (0.0) | 0 | … | 0 | … | 0 | … | 0 | … | 0 | … | 0 | … | 0 | … | 0 | … |
| Washington | 214 | 213 | (99.5) | 3 | (1.4) | 0 | (0.0) | 0 | (0.0) | 0 | (0.0) | 0 | (0.0) | 3 | (100.0) | 0 | (0.0) | 3 | (100.0) | 3 | (100.0) |
| West Virginia | 10 | 10 | (100.0) | 1 | (10.0) | 1 | (100.0) | 0 | (0.0) | 0 | (0.0) | 0 | (0.0) | 0 | (0.0) | 0 | (0.0) | 1 | (100.0) | 0 | (0.0) |
| Wisconsin | 51 | 51 | (100.0) | 0 | (0.0) | 0 | … | 0 | … | 0 | … | 0 | … | 0 | … | 0 | … | 0 | … | 0 | … |
| Wyoming | 1 | 1 | (100.0) | 0 | (0.0) | 0 | … | 0 | … | 0 | … | 0 | … | 0 | … | 0 | … | 0 | … | 0 | … |
| American Samoa6 | 1 | 0 | (0.0) | 0 | … | 0 | … | 0 | … | 0 | … | 0 | … | 0 | … | 0 | … | 0 | … | 0 | … |
| Fed. States of Micronesia6 | 68 | 67 | (98.5) | 0 | (0.0) | 0 | … | 0 | … | 0 | … | 0 | … | 0 | … | 0 | … | 0 | … | 0 | … |
| Guam6 | 70 | 70 | (100.0) | 1 | (1.4) | 0 | (0.0) | 0 | (0.0) | 1 | (100.0) | 0 | (0.0) | 0 | (0.0) | 0 | (0.0) | 1 | (100.0) | 0 | (0.0) |
| Marshall Islands6 | 123 | 121 | (98.4) | 0 | (0.0) | 0 | … | 0 | … | 0 | … | 0 | … | 0 | … | 0 | … | 0 | … | 0 | … |
| N. Mariana Islands6 | 49 | 41 | (83.7) | 0 | (0.0) | 0 | … | 0 | … | 0 | … | 0 | … | 0 | … | 0 | … | 0 | … | 0 | … |
| Puerto Rico6 | 36 | 36 | (100.0) | 0 | (0.0) | 0 | … | 0 | … | 0 | … | 0 | … | 0 | … | 0 | … | 0 | … | 0 | … |
| Republic of Palau6 | 6 | 6 | (100.0) | 0 | (0.0) | 0 | … | 0 | … | 0 | … | 0 | … | 0 | … | 0 | … | 0 | … | 0 | … |
| U.S. Virgin Islands6 | 1 | 0 | (0.0) | 0 | … | 0 | … | 0 | … | 0 | … | 0 | … | 0 | … | 0 | … | 0 | … | 0 | … |
1Resident of correctional facility at time of TB diagnosis.
2Percent of those with known status.
3Excludes youth who are <15 years of age.
4Immigration and Customs Enforcement (ICE) detainment among cases who were residents in correctional facilities.
5Excludes New York City.
6Not included in U.S. totals.
Note: Ellipses (…) indicate that the percentage cannot be calculated, and the denominator is 0.
Zero % (0.0) denotes <0.05%.
See Surveillance Slide #28.