Reported Tuberculosis in the United States, 2019
Table 34. Tuberculosis Cases and Percentages, by Pulmonary and Extrapulmonary Disease1: Reporting Areas, 2019
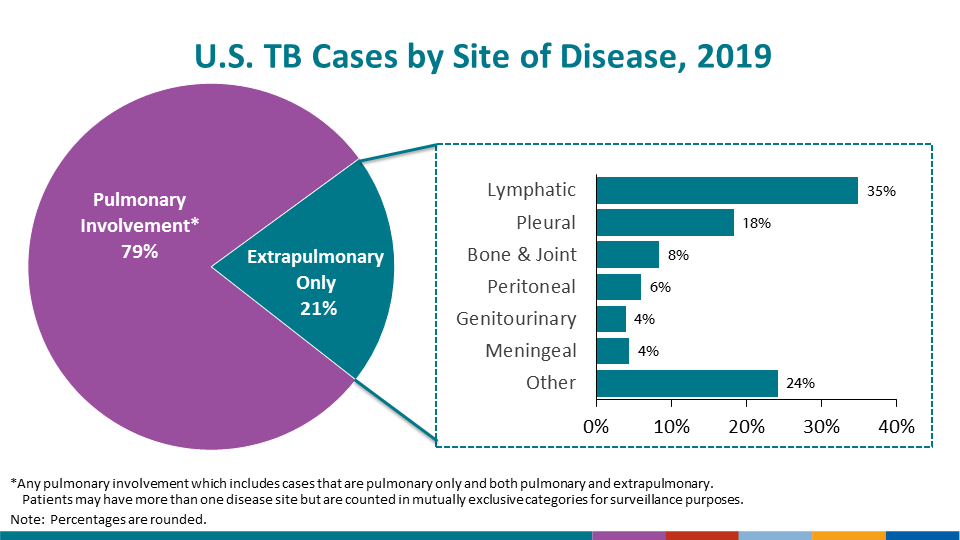
See Surveillance Slide #34
| Reporting area | Total Cases | Pulmonary2 | Extrapulmonary3 | Both Pulmonary/ Extrapulmonary |
|||
|---|---|---|---|---|---|---|---|
| No. | (%) | No. | (%) | No. | (%) | ||
| United States | 8,916 | 6,094 | (68.4) | 1,833 | (20.6) | 981 | (11.0) |
| Alabama | 87 | 72 | (82.8) | 14 | (16.1) | 1 | (1.1) |
| Alaska | 58 | 45 | (77.6) | 11 | (19.0) | 2 | (3.4) |
| Arizona | 183 | 128 | (69.9) | 25 | (13.7) | 30 | (16.4) |
| Arkansas | 64 | 52 | (81.3) | 10 | (15.6) | 2 | (3.1) |
| California | 2,113 | 1,487 | (70.4) | 373 | (17.7) | 251 | (11.9) |
| Colorado | 66 | 32 | (49.2) | 20 | (30.8) | 13 | (20.0) |
| Connecticut | 67 | 41 | (61.2) | 18 | (26.9) | 8 | (11.9) |
| Delaware | 19 | 17 | (89.5) | 2 | (10.5) | 0 | (0.0) |
| District of Columbia | 24 | 17 | (70.8) | 7 | (29.2) | 0 | (0.0) |
| Florida | 558 | 426 | (76.3) | 89 | (15.9) | 43 | (7.7) |
| Georgia | 299 | 218 | (72.9) | 54 | (18.1) | 27 | (9.0) |
| Hawaii | 99 | 72 | (72.7) | 14 | (14.1) | 13 | (13.1) |
| Idaho | 7 | 4 | (57.1) | 3 | (42.9) | 0 | (0.0) |
| Illinois | 326 | 198 | (60.7) | 95 | (29.1) | 33 | (10.1) |
| Indiana | 108 | 65 | (60.2) | 31 | (28.7) | 12 | (11.1) |
| Iowa | 52 | 24 | (47.1) | 8 | (15.7) | 19 | (37.3) |
| Kansas | 38 | 28 | (73.7) | 10 | (26.3) | 0 | (0.0) |
| Kentucky | 66 | 48 | (72.7) | 13 | (19.7) | 5 | (7.6) |
| Louisiana | 89 | 71 | (79.8) | 12 | (13.5) | 6 | (6.7) |
| Maine | 18 | 11 | (61.1) | 4 | (22.2) | 3 | (16.7) |
| Maryland | 210 | 128 | (61.0) | 52 | (24.8) | 30 | (14.3) |
| Massachusetts | 178 | 103 | (57.9) | 54 | (30.3) | 21 | (11.8) |
| Michigan | 131 | 76 | (58.0) | 39 | (29.8) | 16 | (12.2) |
| Minnesota | 148 | 79 | (53.4) | 42 | (28.4) | 27 | (18.2) |
| Mississippi | 56 | 43 | (76.8) | 8 | (14.3) | 5 | (8.9) |
| Missouri | 70 | 47 | (68.1) | 18 | (26.1) | 4 | (5.8) |
| Montana | 2 | 1 | (50.0) | 1 | (50.0) | 0 | (0.0) |
| Nebraska | 17 | 9 | (52.9) | 8 | (47.1) | 0 | (0.0) |
| Nevada | 52 | 40 | (76.9) | 9 | (17.3) | 3 | (5.8) |
| New Hampshire | 6 | 2 | (33.3) | 3 | (50.0) | 1 | (16.7) |
| New Jersey | 311 | 196 | (63.0) | 79 | (25.4) | 36 | (11.6) |
| New Mexico | 41 | 30 | (73.2) | 10 | (24.4) | 1 | (2.4) |
| New York State4 | 188 | 115 | (61.2) | 49 | (26.1) | 24 | (12.8) |
| New York City | 566 | 372 | (65.7) | 107 | (18.9) | 87 | (15.4) |
| North Carolina | 185 | 127 | (68.6) | 41 | (22.2) | 17 | (9.2) |
| North Dakota | 18 | 10 | (55.6) | 7 | (38.9) | 1 | (5.6) |
| Ohio | 150 | 103 | (68.7) | 47 | (31.3) | 0 | (0.0) |
| Oklahoma | 73 | 49 | (69.0) | 16 | (22.5) | 6 | (8.5) |
| Oregon | 70 | 44 | (62.9) | 20 | (28.6) | 6 | (8.6) |
| Pennsylvania | 198 | 126 | (63.6) | 49 | (24.7) | 23 | (11.6) |
| Rhode Island | 14 | 9 | (64.3) | 3 | (21.4) | 2 | (14.3) |
| South Carolina | 80 | 51 | (63.8) | 16 | (20.0) | 13 | (16.3) |
| South Dakota | 16 | 5 | (31.3) | 5 | (31.3) | 6 | (37.5) |
| Tennessee | 128 | 96 | (75.0) | 18 | (14.1) | 14 | (10.9) |
| Texas | 1,159 | 861 | (74.4) | 191 | (16.5) | 106 | (9.2) |
| Utah | 27 | 16 | (59.3) | 9 | (33.3) | 2 | (7.4) |
| Vermont | 4 | 3 | (75.0) | 1 | (25.0) | 0 | (0.0) |
| Virginia | 192 | 129 | (67.2) | 45 | (23.4) | 18 | (9.4) |
| Washington | 223 | 127 | (57.0) | 59 | (26.5) | 37 | (16.6) |
| West Virginia | 10 | 8 | (80.0) | 2 | (20.0) | 0 | (0.0) |
| Wisconsin | 51 | 32 | (62.7) | 12 | (23.5) | 7 | (13.7) |
| Wyoming | 1 | 1 | (100.0) | 0 | (0.0) | 0 | (0.0) |
| American Samoa5 | 1 | 1 | (100.0) | 0 | (0.0) | 0 | (0.0) |
| Fed. States of Micronesia5 | 91 | 79 | (86.8) | 11 | (12.1) | 1 | (1.1) |
| Guam5 | 79 | 73 | (92.4) | 4 | (5.1) | 2 | (2.5) |
| Marshall Islands5 | 226 | 179 | (79.2) | 45 | (19.9) | 2 | (0.9) |
| N. Mariana Islands5 | 51 | 47 | (92.2) | 3 | (5.9) | 1 | (2.0) |
| Puerto Rico5 | 36 | 33 | (91.7) | 3 | (8.3) | 0 | (0.0) |
| Republic of Palau5 | 6 | 6 | (100.0) | 0 | (0.0) | 0 | (0.0) |
| U.S. Virgin Islands5 | 1 | 0 | (0.0) | 0 | (0.0) | 0 | (0.0) |
1Includes only cases with a known disease site.
2Includes cases with pulmonary listed as the only site of disease.
3Includes cases with pleural, lymphatic, bone and/or joint, meningeal, peritoneal, genitourinary, or other site, excluding pulmonary, listed as the site of disease.
4Excludes New York City.
5Not included in U.S. totals.
Note: Eight cases had missing and/or unknown site of disease in the United States.
Zero % (0.0) denotes <0.05%.