Reported Tuberculosis in the United States, 2019
Table 33. Tuberculosis Cases and Percentages Among Non-U.S.–Born Persons1, by Number of Years in the United States: United States and the District of Columbia, 2019
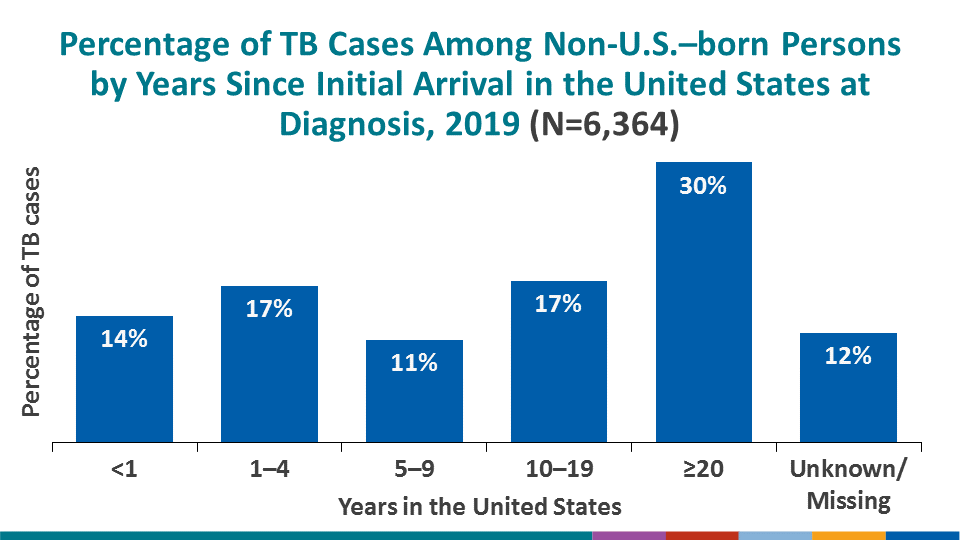
See Surveillance Slides #14
| Reporting Area | Total Cases | <1 Year | 1–4 | 5–9 | 10–19 | ≥20 | Unknown/Missing | ||||||
|---|---|---|---|---|---|---|---|---|---|---|---|---|---|
| No. | (%) | No. | (%) | No. | (%) | No. | (%) | No. | (%) | No. | (%) | ||
| United States | 6,364 | 860 | (13.5) | 1,065 | (16.7) | 697 | (11.0) | 1,098 | (17.3) | 1,900 | (29.9) | 744 | (11.7) |
| Alabama | 40 | 7 | (17.5) | 9 | (22.5) | 4 | (10.0) | 10 | (25.0) | 10 | (25.0) | 0 | (0.0) |
| Alaska | 15 | 4 | (26.7) | 0 | (0.0) | 5 | (33.3) | 0 | (0.0) | 4 | (26.7) | 2 | (13.3) |
| Arizona | 126 | 41 | (32.5) | 12 | (9.5) | 10 | (7.9) | 11 | (8.7) | 13 | (10.3) | 39 | (31.0) |
| Arkansas | 20 | 1 | (5.0) | 6 | (30.0) | 3 | (15.0) | 3 | (15.0) | 7 | (35.0) | 0 | (0.0) |
| California | 1,725 | 143 | (8.3) | 178 | (10.3) | 117 | (6.8) | 244 | (14.1) | 676 | (39.2) | 367 | (21.3) |
| Colorado | 55 | 9 | (16.4) | 11 | (20.0) | 7 | (12.7) | 7 | (12.7) | 11 | (20.0) | 10 | (18.2) |
| Connecticut | 56 | 11 | (19.6) | 13 | (23.2) | 4 | (7.1) | 9 | (16.1) | 18 | (32.1) | 1 | (1.8) |
| Delaware | 9 | 3 | (33.3) | 3 | (33.3) | 0 | (0.0) | 0 | (0.0) | 3 | (33.3) | 0 | (0.0) |
| District of Columbia | 17 | 2 | (11.8) | 2 | (11.8) | 2 | (11.8) | 8 | (47.1) | 3 | (17.6) | 0 | (0.0) |
| Florida | 353 | 74 | (21.0) | 80 | (22.7) | 33 | (9.3) | 64 | (18.1) | 102 | (28.9) | 0 | (0.0) |
| Georgia | 164 | 23 | (14.0) | 40 | (24.4) | 24 | (14.6) | 27 | (16.5) | 39 | (23.8) | 11 | (6.7) |
| Hawaii | 83 | 15 | (18.1) | 8 | (9.6) | 9 | (10.8) | 20 | (24.1) | 30 | (36.1) | 1 | (1.2) |
| Idaho | 6 | 1 | (16.7) | 0 | (0.0) | 2 | (33.3) | 1 | (16.7) | 0 | (0.0) | 2 | (33.3) |
| Illinois | 239 | 33 | (13.8) | 39 | (16.3) | 32 | (13.4) | 48 | (20.1) | 85 | (35.6) | 2 | (0.8) |
| Indiana | 67 | 13 | (19.4) | 11 | (16.4) | 11 | (16.4) | 20 | (29.9) | 12 | (17.9) | 0 | (0.0) |
| Iowa | 46 | 0 | (0.0) | 4 | (8.7) | 2 | (4.3) | 0 | (0.0) | 0 | (0.0) | 40 | (87.0) |
| Kansas | 26 | 3 | (11.5) | 8 | (30.8) | 5 | (19.2) | 5 | (19.2) | 4 | (15.4) | 1 | (3.8) |
| Kentucky | 44 | 8 | (18.2) | 16 | (36.4) | 8 | (18.2) | 6 | (13.6) | 5 | (11.4) | 1 | (2.3) |
| Louisiana | 32 | 3 | (9.4) | 10 | (31.3) | 3 | (9.4) | 7 | (21.9) | 7 | (21.9) | 2 | (6.3) |
| Maine | 13 | 5 | (38.5) | 3 | (23.1) | 5 | (38.5) | 0 | (0.0) | 0 | (0.0) | 0 | (0.0) |
| Maryland | 168 | 30 | (17.9) | 45 | (26.8) | 25 | (14.9) | 37 | (22.0) | 29 | (17.3) | 2 | (1.2) |
| Massachusetts | 146 | 26 | (17.8) | 27 | (18.5) | 18 | (12.3) | 31 | (21.2) | 32 | (21.9) | 12 | (8.2) |
| Michigan | 72 | 0 | (0.0) | 0 | (0.0) | 0 | (0.0) | 0 | (0.0) | 0 | (0.0) | 72 | (100.0) |
| Minnesota | 130 | 15 | (11.5) | 32 | (24.6) | 25 | (19.2) | 24 | (18.5) | 34 | (26.2) | 0 | (0.0) |
| Mississippi | 16 | 5 | (31.3) | 1 | (6.3) | 4 | (25.0) | 2 | (12.5) | 2 | (12.5) | 2 | (12.5) |
| Missouri | 39 | 7 | (17.9) | 10 | (25.6) | 7 | (17.9) | 5 | (12.8) | 9 | (23.1) | 1 | (2.6) |
| Montana | 2 | 1 | (50.0) | 0 | (0.0) | 0 | (0.0) | 0 | (0.0) | 1 | (50.0) | 0 | (0.0) |
| Nebraska | 12 | 3 | (25.0) | 2 | (16.7) | 4 | (33.3) | 0 | (0.0) | 1 | (8.3) | 2 | (16.7) |
| Nevada | 40 | 1 | (2.5) | 6 | (15.0) | 5 | (12.5) | 9 | (22.5) | 19 | (47.5) | 0 | (0.0) |
| New Hampshire | 6 | 1 | (16.7) | 2 | (33.3) | 1 | (16.7) | 1 | (16.7) | 1 | (16.7) | 0 | (0.0) |
| New Jersey | 261 | 24 | (9.2) | 51 | (19.5) | 30 | (11.5) | 53 | (20.3) | 63 | (24.1) | 40 | (15.3) |
| New Mexico | 27 | 3 | (11.1) | 5 | (18.5) | 2 | (7.4) | 2 | (7.4) | 15 | (55.6) | 0 | (0.0) |
| New York State2 | 160 | 29 | (18.1) | 23 | (14.4) | 26 | (16.3) | 31 | (19.4) | 48 | (30.0) | 3 | (1.9) |
| New York City | 474 | 43 | (9.1) | 94 | (19.8) | 63 | (13.3) | 108 | (22.8) | 145 | (30.6) | 21 | (4.4) |
| North Carolina | 97 | 8 | (8.2) | 17 | (17.5) | 12 | (12.4) | 18 | (18.6) | 9 | (9.3) | 33 | (34.0) |
| North Dakota | 13 | 2 | (15.4) | 3 | (23.1) | 6 | (46.2) | 1 | (7.7) | 1 | (7.7) | 0 | (0.0) |
| Ohio | 101 | 12 | (11.9) | 29 | (28.7) | 19 | (18.8) | 21 | (20.8) | 19 | (18.8) | 1 | (1.0) |
| Oklahoma | 38 | 5 | (13.2) | 8 | (21.1) | 8 | (21.1) | 9 | (23.7) | 5 | (13.2) | 3 | (7.9) |
| Oregon | 56 | 7 | (12.5) | 10 | (17.9) | 5 | (8.9) | 5 | (8.9) | 8 | (14.3) | 21 | (37.5) |
| Pennsylvania | 149 | 13 | (8.7) | 26 | (17.4) | 21 | (14.1) | 31 | (20.8) | 40 | (26.8) | 18 | (12.1) |
| Rhode Island | 12 | 5 | (41.7) | 1 | (8.3) | 1 | (8.3) | 1 | (8.3) | 4 | (33.3) | 0 | (0.0) |
| South Carolina | 29 | 6 | (20.7) | 6 | (20.7) | 2 | (6.9) | 4 | (13.8) | 11 | (37.9) | 0 | (0.0) |
| South Dakota | 12 | 1 | (8.3) | 2 | (16.7) | 3 | (25.0) | 5 | (41.7) | 1 | (8.3) | 0 | (0.0) |
| Tennessee | 56 | 4 | (7.1) | 17 | (30.4) | 10 | (17.9) | 9 | (16.1) | 16 | (28.6) | 0 | (0.0) |
| Texas | 721 | 161 | (22.3) | 120 | (16.6) | 72 | (10.0) | 116 | (16.1) | 242 | (33.6) | 10 | (1.4) |
| Utah | 18 | 5 | (27.8) | 0 | (0.0) | 3 | (16.7) | 6 | (33.3) | 4 | (22.2) | 0 | (0.0) |
| Vermont | 3 | 1 | (33.3) | 1 | (33.3) | 0 | (0.0) | 0 | (0.0) | 1 | (33.3) | 0 | (0.0) |
| Virginia | 149 | 23 | (15.4) | 32 | (21.5) | 14 | (9.4) | 26 | (17.4) | 48 | (32.2) | 6 | (4.0) |
| Washington | 183 | 14 | (7.7) | 38 | (20.8) | 19 | (10.4) | 43 | (23.5) | 51 | (27.9) | 18 | (9.8) |
| West Virginia | 1 | 1 | (100.0) | 0 | (0.0) | 0 | (0.0) | 0 | (0.0) | 0 | (0.0) | 0 | (0.0) |
| Wisconsin | 37 | 5 | (13.5) | 4 | (10.8) | 6 | (16.2) | 10 | (27.0) | 12 | (32.4) | 0 | (0.0) |
| Wyoming | 0 | 0 | … | 0 | … | 0 | … | 0 | … | 0 | … | 0 | … |
1Includes persons born outside the United States or the U.S. territories, except persons born to at least one U.S. citizen parent.
2Excludes New York City.
Note: Ellipses (…) indicate that the percentage cannot be calculated, and the denominator is 0.