Reported Tuberculosis in the United States, 2019
Table 32. Tuberculosis Cases and Percentages, U.S.-born and Non-U.S.–Born Persons1: Reporting Areas, 2019
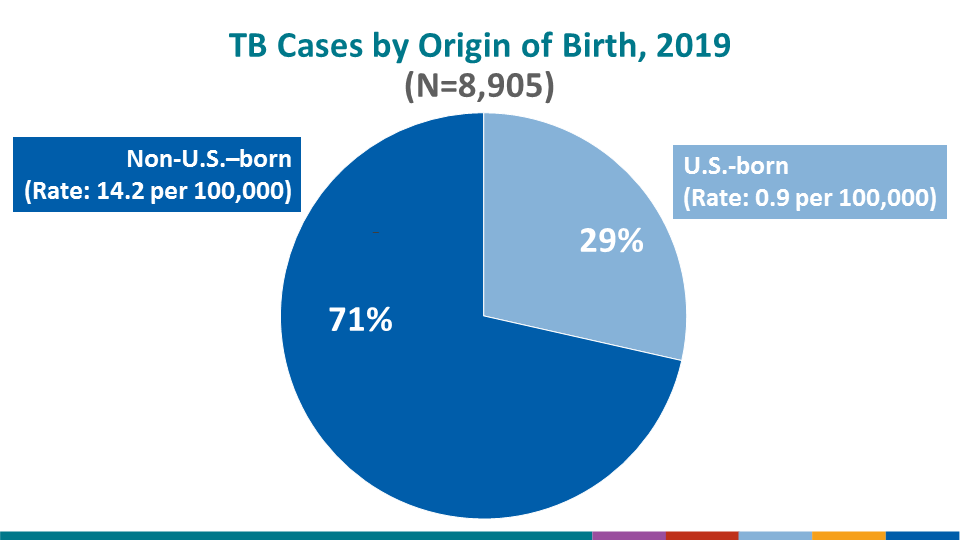
See Surveillance Slide #10
| Reporting Area | Total Cases | U.S.-Born Persons | Non-U.S.–Born Persons1 | Unknown Origin | |||
|---|---|---|---|---|---|---|---|
| No. | (%) | No. | (%) | No. | (%) | ||
| United States | 8,916 | 2,541 | (28.5) | 6,364 | (71.4) | 11 | (0.1) |
| Alabama | 87 | 47 | (54.0) | 40 | (46.0) | 0 | (0.0) |
| Alaska | 58 | 43 | (74.1) | 15 | (25.9) | 0 | (0.0) |
| Arizona | 183 | 57 | (31.1) | 126 | (68.9) | 0 | (0.0) |
| Arkansas | 64 | 44 | (68.8) | 20 | (31.3) | 0 | (0.0) |
| California | 2,113 | 378 | (17.9) | 1,725 | (81.6) | 10 | (0.5) |
| Colorado | 66 | 11 | (16.7) | 55 | (83.3) | 0 | (0.0) |
| Connecticut | 67 | 11 | (16.4) | 56 | (83.6) | 0 | (0.0) |
| Delaware | 19 | 10 | (52.6) | 9 | (47.4) | 0 | (0.0) |
| District of Columbia | 24 | 7 | (29.2) | 17 | (70.8) | 0 | (0.0) |
| Florida | 558 | 205 | (36.7) | 353 | (63.3) | 0 | (0.0) |
| Georgia | 299 | 135 | (45.2) | 164 | (54.8) | 0 | (0.0) |
| Hawaii | 99 | 16 | (16.2) | 83 | (83.8) | 0 | (0.0) |
| Idaho | 7 | 1 | (14.3) | 6 | (85.7) | 0 | (0.0) |
| Illinois | 326 | 87 | (26.7) | 239 | (73.3) | 0 | (0.0) |
| Indiana | 108 | 41 | (38.0) | 67 | (62.0) | 0 | (0.0) |
| Iowa | 52 | 6 | (11.5) | 46 | (88.5) | 0 | (0.0) |
| Kansas | 38 | 12 | (31.6) | 26 | (68.4) | 0 | (0.0) |
| Kentucky | 66 | 22 | (33.3) | 44 | (66.7) | 0 | (0.0) |
| Louisiana | 89 | 57 | (64.0) | 32 | (36.0) | 0 | (0.0) |
| Maine | 18 | 5 | (27.8) | 13 | (72.2) | 0 | (0.0) |
| Maryland | 210 | 42 | (20.0) | 168 | (80.0) | 0 | (0.0) |
| Massachusetts | 178 | 32 | (18.0) | 146 | (82.0) | 0 | (0.0) |
| Michigan | 131 | 59 | (45.0) | 72 | (55.0) | 0 | (0.0) |
| Minnesota | 148 | 18 | (12.2) | 130 | (87.8) | 0 | (0.0) |
| Mississippi | 56 | 40 | (71.4) | 16 | (28.6) | 0 | (0.0) |
| Missouri | 70 | 31 | (44.3) | 39 | (55.7) | 0 | (0.0) |
| Montana | 2 | 0 | (0.0) | 2 | (100.0) | 0 | (0.0) |
| Nebraska | 17 | 5 | (29.4) | 12 | (70.6) | 0 | (0.0) |
| Nevada | 52 | 12 | (23.1) | 40 | (76.9) | 0 | (0.0) |
| New Hampshire | 6 | 0 | (0.0) | 6 | (100.0) | 0 | (0.0) |
| New Jersey | 311 | 50 | (16.1) | 261 | (83.9) | 0 | (0.0) |
| New Mexico | 41 | 14 | (34.1) | 27 | (65.9) | 0 | (0.0) |
| New York State2 | 188 | 28 | (14.9) | 160 | (85.1) | 0 | (0.0) |
| New York City | 566 | 91 | (16.1) | 474 | (83.7) | 1 | (0.2) |
| North Carolina | 185 | 88 | (47.6) | 97 | (52.4) | 0 | (0.0) |
| North Dakota | 18 | 5 | (27.8) | 13 | (72.2) | 0 | (0.0) |
| Ohio | 150 | 49 | (32.7) | 101 | (67.3) | 0 | (0.0) |
| Oklahoma | 73 | 35 | (47.9) | 38 | (52.1) | 0 | (0.0) |
| Oregon | 70 | 14 | (20.0) | 56 | (80.0) | 0 | (0.0) |
| Pennsylvania | 198 | 49 | (24.7) | 149 | (75.3) | 0 | (0.0) |
| Rhode Island | 14 | 2 | (14.3) | 12 | (85.7) | 0 | (0.0) |
| South Carolina | 80 | 51 | (63.8) | 29 | (36.3) | 0 | (0.0) |
| South Dakota | 16 | 4 | (25.0) | 12 | (75.0) | 0 | (0.0) |
| Tennessee | 128 | 72 | (56.3) | 56 | (43.8) | 0 | (0.0) |
| Texas | 1,159 | 438 | (37.8) | 721 | (62.2) | 0 | (0.0) |
| Utah | 27 | 9 | (33.3) | 18 | (66.7) | 0 | (0.0) |
| Vermont | 4 | 1 | (25.0) | 3 | (75.0) | 0 | (0.0) |
| Virginia | 192 | 43 | (22.4) | 149 | (77.6) | 0 | (0.0) |
| Washington | 223 | 40 | (17.9) | 183 | (82.1) | 0 | (0.0) |
| West Virginia | 10 | 9 | (90.0) | 1 | (10.0) | 0 | (0.0) |
| Wisconsin | 51 | 14 | (27.5) | 37 | (72.5) | 0 | (0.0) |
| Wyoming | 1 | 1 | (100.0) | 0 | (0.0) | 0 | (0.0) |
1Includes persons born outside the United States (including the U.S. territories), except persons born to at least one U.S. citizen parent.
2Excludes New York City.
Zero % (0.0) denotes <0.05%.
Note: See Surveillance Slide #16