Reported Tuberculosis in the United States, 2019
Table 31. Tuberculosis Cases by Hispanic Ethnicity and Non-Hispanic Race: Reporting Areas, 2019
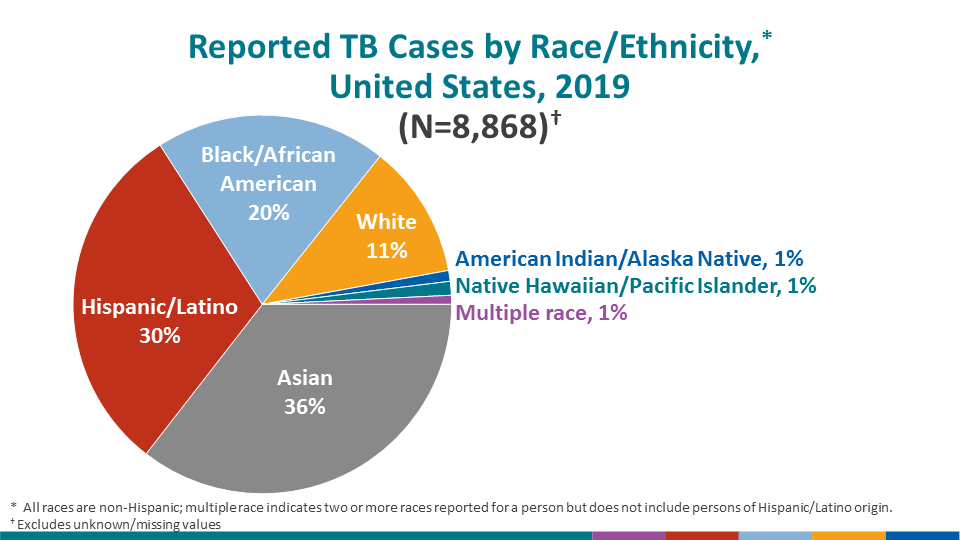
See Surveillance Slide #16
| Reporting Area | Total Cases | Hispanic1 | American Indian/Alaska Native | Asian | Black/African American | Native Hawaiian/Other Pacific Islander | White | Multiple Race2 | Unknown/missing | ||||||||
|---|---|---|---|---|---|---|---|---|---|---|---|---|---|---|---|---|---|
| No. | (%) | No. | (%) | No. | (%) | No. | (%) | No. | (%) | No. | (%) | No. | (%) | No. | (%) | ||
| United States | 8,916 | 2,696 | (30.2) | 82 | (0.9) | 3,150 | (35.3) | 1,753 | (19.7) | 105 | (1.2) | 1,014 | (11.4) | 68 | (0.8) | 48 | (0.5) |
| Alabama | 87 | 20 | (23.0) | 0 | (0.0) | 15 | (17.2) | 31 | (35.6) | 0 | (0.0) | 21 | (24.1) | 0 | (0.0) | 0 | (0.0) |
| Alaska | 58 | 2 | (3.4) | 42 | (72.4) | 12 | (20.7) | 1 | (1.7) | 1 | (1.7) | 0 | (0.0) | 0 | (0.0) | 0 | (0.0) |
| Arizona | 183 | 111 | (60.7) | 11 | (6.0) | 32 | (17.5) | 12 | (6.6) | 2 | (1.1) | 15 | (8.2) | 0 | (0.0) | 0 | (0.0) |
| Arkansas | 64 | 11 | (17.2) | 0 | (0.0) | 6 | (9.4) | 17 | (26.6) | 8 | (12.5) | 21 | (32.8) | 1 | (1.6) | 0 | (0.0) |
| California | 2,113 | 820 | (38.8) | 1 | (0.0) | 1,055 | (49.9) | 92 | (4.4) | 11 | (0.5) | 130 | (6.2) | 3 | (0.1) | 1 | (0.0) |
| Colorado | 66 | 19 | (28.8) | 1 | (1.5) | 24 | (36.4) | 13 | (19.7) | 1 | (1.5) | 8 | (12.1) | 0 | (0.0) | 0 | (0.0) |
| Connecticut | 67 | 22 | (32.8) | 0 | (0.0) | 24 | (35.8) | 12 | (17.9) | 0 | (0.0) | 9 | (13.4) | 0 | (0.0) | 0 | (0.0) |
| Delaware | 19 | 8 | (42.1) | 0 | (0.0) | 0 | (0.0) | 1 | (5.3) | 0 | (0.0) | 10 | (52.6) | 0 | (0.0) | 0 | (0.0) |
| District of Columbia | 24 | 4 | (16.7) | 0 | (0.0) | 5 | (20.8) | 14 | (58.3) | 0 | (0.0) | 1 | (4.2) | 0 | (0.0) | 0 | (0.0) |
| Florida | 558 | 181 | (32.4) | 0 | (0.0) | 73 | (13.1) | 199 | (35.7) | 1 | (0.2) | 103 | (18.5) | 1 | (0.2) | 0 | (0.0) |
| Georgia | 299 | 61 | (20.4) | 1 | (0.3) | 73 | (24.4) | 130 | (43.5) | 0 | (0.0) | 32 | (10.7) | 2 | (0.7) | 0 | (0.0) |
| Hawaii | 99 | 1 | (1.0) | 0 | (0.0) | 63 | (63.6) | 1 | (1.0) | 28 | (28.3) | 3 | (3.0) | 2 | (2.0) | 1 | (1.0) |
| Idaho | 7 | 2 | (28.6) | 0 | (0.0) | 1 | (14.3) | 2 | (28.6) | 0 | (0.0) | 2 | (28.6) | 0 | (0.0) | 0 | (0.0) |
| Illinois | 326 | 67 | (20.6) | 0 | (0.0) | 155 | (47.5) | 67 | (20.6) | 0 | (0.0) | 37 | (11.3) | 0 | (0.0) | 0 | (0.0) |
| Indiana | 108 | 17 | (15.7) | 0 | (0.0) | 35 | (32.4) | 33 | (30.6) | 1 | (0.9) | 20 | (18.5) | 2 | (1.9) | 0 | (0.0) |
| Iowa | 52 | 8 | (15.4) | 0 | (0.0) | 13 | (25.0) | 23 | (44.2) | 4 | (7.7) | 4 | (7.7) | 0 | (0.0) | 0 | (0.0) |
| Kansas | 38 | 9 | (23.7) | 0 | (0.0) | 12 | (31.6) | 6 | (15.8) | 1 | (2.6) | 9 | (23.7) | 0 | (0.0) | 1 | (2.6) |
| Kentucky | 66 | 10 | (15.2) | 0 | (0.0) | 19 | (28.8) | 23 | (34.8) | 0 | (0.0) | 14 | (21.2) | 0 | (0.0) | 0 | (0.0) |
| Louisiana | 89 | 15 | (16.9) | 0 | (0.0) | 15 | (16.9) | 40 | (44.9) | 0 | (0.0) | 18 | (20.2) | 0 | (0.0) | 1 | (1.1) |
| Maine | 18 | 0 | (0.0) | 0 | (0.0) | 2 | (11.1) | 13 | (72.2) | 0 | (0.0) | 3 | (16.7) | 0 | (0.0) | 0 | (0.0) |
| Maryland | 210 | 37 | (17.6) | 0 | (0.0) | 75 | (35.7) | 87 | (41.4) | 0 | (0.0) | 9 | (4.3) | 2 | (1.0) | 0 | (0.0) |
| Massachusetts | 178 | 22 | (12.4) | 0 | (0.0) | 90 | (50.6) | 36 | (20.2) | 0 | (0.0) | 26 | (14.6) | 2 | (1.1) | 2 | (1.1) |
| Michigan | 131 | 11 | (8.4) | 1 | (0.8) | 48 | (36.6) | 34 | (26.0) | 1 | (0.8) | 36 | (27.5) | 0 | (0.0) | 0 | (0.0) |
| Minnesota | 148 | 11 | (7.4) | 0 | (0.0) | 54 | (36.5) | 72 | (48.6) | 0 | (0.0) | 11 | (7.4) | 0 | (0.0) | 0 | (0.0) |
| Mississippi | 56 | 7 | (12.5) | 0 | (0.0) | 7 | (12.5) | 29 | (51.8) | 0 | (0.0) | 12 | (21.4) | 1 | (1.8) | 0 | (0.0) |
| Missouri | 70 | 7 | (10.0) | 0 | (0.0) | 19 | (27.1) | 23 | (32.9) | 1 | (1.4) | 18 | (25.7) | 0 | (0.0) | 2 | (2.9) |
| Montana | 2 | 1 | (50.0) | 0 | (0.0) | 1 | (50.0) | 0 | (0.0) | 0 | (0.0) | 0 | (0.0) | 0 | (0.0) | 0 | (0.0) |
| Nebraska | 17 | 4 | (23.5) | 0 | (0.0) | 8 | (47.1) | 3 | (17.6) | 0 | (0.0) | 2 | (11.8) | 0 | (0.0) | 0 | (0.0) |
| Nevada | 52 | 9 | (17.3) | 1 | (1.9) | 30 | (57.7) | 4 | (7.7) | 0 | (0.0) | 8 | (15.4) | 0 | (0.0) | 0 | (0.0) |
| New Hampshire | 6 | 0 | (0.0) | 0 | (0.0) | 6 | (100.0) | 0 | (0.0) | 0 | (0.0) | 0 | (0.0) | 0 | (0.0) | 0 | (0.0) |
| New Jersey | 311 | 92 | (29.6) | 0 | (0.0) | 141 | (45.3) | 59 | (19.0) | 0 | (0.0) | 19 | (6.1) | 0 | (0.0) | 0 | (0.0) |
| New Mexico | 41 | 33 | (80.5) | 2 | (4.9) | 3 | (7.3) | 2 | (4.9) | 1 | (2.4) | 0 | (0.0) | 0 | (0.0) | 0 | (0.0) |
| New York State3 | 188 | 52 | (27.7) | 0 | (0.0) | 74 | (39.4) | 24 | (12.8) | 1 | (0.5) | 33 | (17.6) | 0 | (0.0) | 4 | (2.1) |
| New York City | 566 | 147 | (26.0) | 0 | (0.0) | 236 | (41.7) | 103 | (18.2) | 0 | (0.0) | 38 | (6.7) | 18 | (3.2) | 24 | (4.2) |
| North Carolina | 185 | 52 | (28.1) | 12 | (6.5) | 32 | (17.3) | 64 | (34.6) | 2 | (1.1) | 17 | (9.2) | 6 | (3.2) | 0 | (0.0) |
| North Dakota | 18 | 0 | (0.0) | 2 | (11.1) | 7 | (38.9) | 6 | (33.3) | 0 | (0.0) | 3 | (16.7) | 0 | (0.0) | 0 | (0.0) |
| Ohio | 150 | 21 | (14.0) | 0 | (0.0) | 53 | (35.3) | 50 | (33.3) | 0 | (0.0) | 26 | (17.3) | 0 | (0.0) | 0 | (0.0) |
| Oklahoma | 73 | 13 | (17.8) | 2 | (2.7) | 14 | (19.2) | 5 | (6.8) | 7 | (9.6) | 16 | (21.9) | 16 | (21.9) | 0 | (0.0) |
| Oregon | 70 | 9 | (12.9) | 1 | (1.4) | 33 | (47.1) | 2 | (2.9) | 14 | (20.0) | 11 | (15.7) | 0 | (0.0) | 0 | (0.0) |
| Pennsylvania | 198 | 18 | (9.1) | 0 | (0.0) | 107 | (54.0) | 42 | (21.2) | 0 | (0.0) | 28 | (14.1) | 3 | (1.5) | 0 | (0.0) |
| Rhode Island | 14 | 4 | (28.6) | 0 | (0.0) | 7 | (50.0) | 3 | (21.4) | 0 | (0.0) | 0 | (0.0) | 0 | (0.0) | 0 | (0.0) |
| South Carolina | 80 | 19 | (23.8) | 0 | (0.0) | 11 | (13.8) | 36 | (45.0) | 0 | (0.0) | 14 | (17.5) | 0 | (0.0) | 0 | (0.0) |
| South Dakota | 16 | 0 | (0.0) | 1 | (6.3) | 3 | (18.8) | 8 | (50.0) | 0 | (0.0) | 3 | (18.8) | 1 | (6.3) | 0 | (0.0) |
| Tennessee | 128 | 32 | (25.0) | 0 | (0.0) | 16 | (12.5) | 41 | (32.0) | 0 | (0.0) | 39 | (30.5) | 0 | (0.0) | 0 | (0.0) |
| Texas | 1,159 | 610 | (52.6) | 0 | (0.0) | 220 | (19.0) | 191 | (16.5) | 7 | (0.6) | 117 | (10.1) | 5 | (0.4) | 9 | (0.8) |
| Utah | 27 | 12 | (44.4) | 0 | (0.0) | 5 | (18.5) | 3 | (11.1) | 2 | (7.4) | 5 | (18.5) | 0 | (0.0) | 0 | (0.0) |
| Vermont | 4 | 0 | (0.0) | 0 | (0.0) | 0 | (0.0) | 1 | (25.0) | 0 | (0.0) | 1 | (25.0) | 1 | (25.0) | 1 | (25.0) |
| Virginia | 192 | 43 | (22.4) | 1 | (0.5) | 81 | (42.2) | 53 | (27.6) | 0 | (0.0) | 13 | (6.8) | 1 | (0.5) | 0 | (0.0) |
| Washington | 223 | 31 | (13.9) | 3 | (1.3) | 109 | (48.9) | 38 | (17.0) | 11 | (4.9) | 29 | (13.0) | 0 | (0.0) | 2 | (0.9) |
| West Virginia | 10 | 1 | (10.0) | 0 | (0.0) | 1 | (10.0) | 0 | (0.0) | 0 | (0.0) | 8 | (80.0) | 0 | (0.0) | 0 | (0.0) |
| Wisconsin | 51 | 10 | (19.6) | 0 | (0.0) | 25 | (49.0) | 3 | (5.9) | 0 | (0.0) | 12 | (23.5) | 1 | (2.0) | 0 | (0.0) |
| Wyoming | 1 | 0 | (0.0) | 0 | (0.0) | 0 | (0.0) | 1 | (100.0) | 0 | (0.0) | 0 | (0.0) | 0 | (0.0) | 0 | (0.0) |
| American Samoa4 | 1 | 0 | (0.0) | 0 | (0.0) | 0 | (0.0) | 0 | (0.0) | 1 | (100.0) | 0 | (0.0) | 0 | (0.0) | 0 | (0.0) |
| Fed. States of Micronesia4 | 91 | 0 | (0.0) | 0 | (0.0) | 2 | (2.2) | 0 | (0.0) | 89 | (97.8) | 0 | (0.0) | 0 | (0.0) | 0 | (0.0) |
| Guam4 | 79 | 0 | (0.0) | 0 | (0.0) | 37 | (46.8) | 0 | (0.0) | 41 | (51.9) | 0 | (0.0) | 1 | (1.3) | 0 | (0.0) |
| Marshall Islands4 | 226 | 0 | (0.0) | 0 | (0.0) | 1 | (0.4) | 0 | (0.0) | 223 | (98.7) | 0 | (0.0) | 1 | (0.4) | 1 | (0.4) |
| N. Mariana Islands4 | 51 | 0 | (0.0) | 0 | (0.0) | 32 | (62.7) | 0 | (0.0) | 19 | (37.3) | 0 | (0.0) | 0 | (0.0) | 0 | (0.0) |
| Puerto Rico4 | 36 | 36 | (100.0) | 0 | (0.0) | 0 | (0.0) | 0 | (0.0) | 0 | (0.0) | 0 | (0.0) | 0 | (0.0) | 0 | (0.0) |
| Republic of Palau4 | 6 | 0 | (0.0) | 0 | (0.0) | 0 | (0.0) | 0 | (0.0) | 6 | (100.0) | 0 | (0.0) | 0 | (0.0) | 0 | (0.0) |
| U.S. Virgin Islands4 | 1 | 0 | (0.0) | 0 | (0.0) | 0 | (0.0) | 0 | (0.0) | 0 | (0.0) | 0 | (0.0) | 0 | (0.0) | 1 | (100.0) |
1Persons of Hispanic/Latino origin may be of any or multiple race.
2Indicates two or more races reported for a person and does not include persons of Hispanic/Latino origin.
3Excludes New York City.
4Not included in U.S. totals.
Note: Case counts for race categories (American Indian/Alaska Native, Asian, Black/African American, Native Hawaiian/Other Pacific Islander, and White) are mutually exclusive and do not include persons of Hispanic ethnicity or multiple race.
Zero % (0.0) denotes <0.05%.
See Technical Notes.