Reported Tuberculosis in the United States, 2019
Table 28. Tuberculosis Cases and Case Rates per 100,000 Population: Reporting Areas, 2019 and 2018
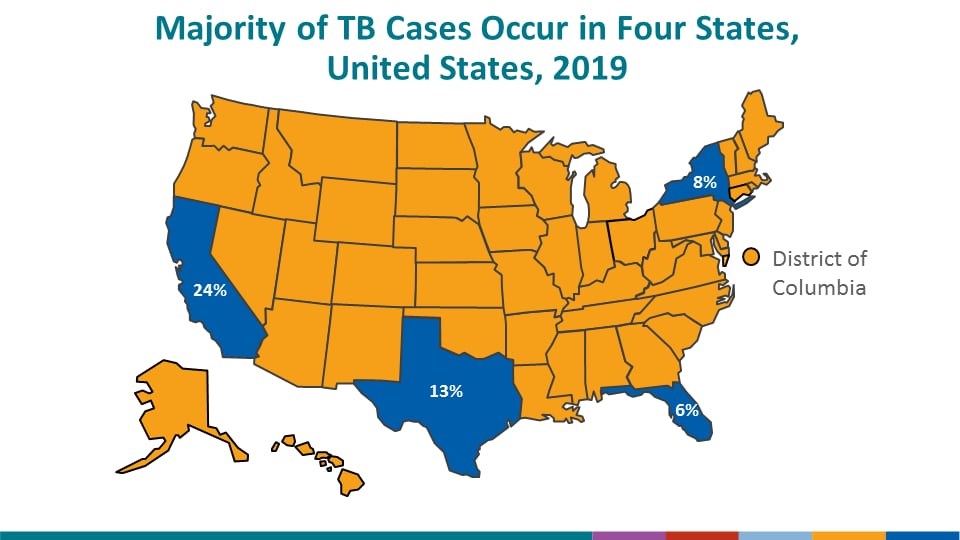
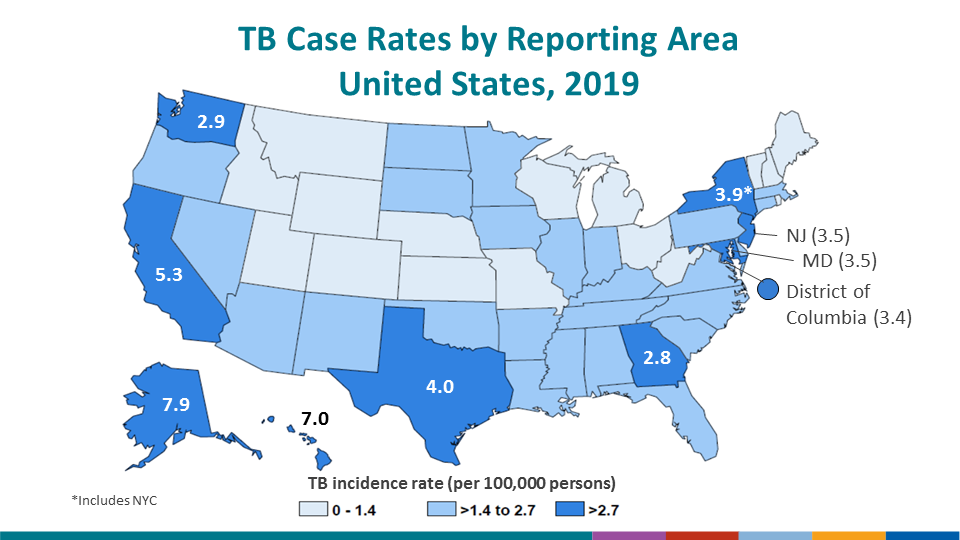
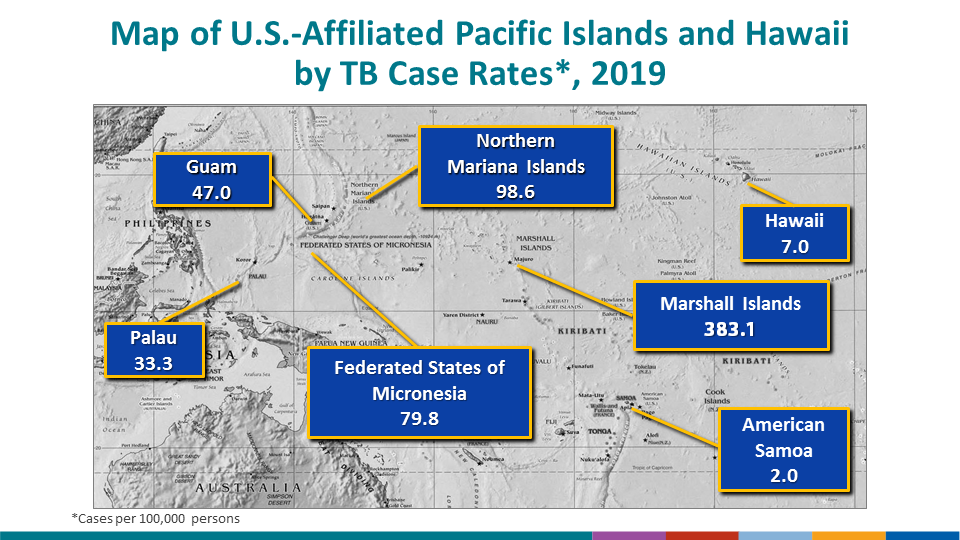
See Surveillance Slides #6, #7 and #8
| Reporting Area | Cases | Case Rates | Rank According to Rate | Population Estimates | |||
|---|---|---|---|---|---|---|---|
| 2019 | 2018 | 2019 | 2018 | 2019 | 2018 | July 1, 2019 | |
| United States | 8,916 | 9,024 | 2.7 | 2.8 | — | — | 328,239,523 |
| Alabama | 87 | 91 | 1.8 | 1.9 | 27 | 28 | 4,903,185 |
| Alaska | 58 | 63 | 7.9 | 8.6 | 1 | 1 | 731,545 |
| Arizona | 183 | 178 | 2.5 | 2.5 | 15 | 17 | 7,278,717 |
| Arkansas | 64 | 76 | 2.1 | 2.5 | 18 | 15 | 3,017,804 |
| California | 2,113 | 2,097 | 5.3 | 5.3 | 4 | 4 | 39,512,223 |
| Colorado | 66 | 64 | 1.1 | 1.1 | 42 | 41 | 5,758,736 |
| Connecticut | 67 | 51 | 1.9 | 1.4 | 23 | 37 | 3,565,287 |
| Delaware | 19 | 22 | 2.0 | 2.3 | 20 | 20 | 973,764 |
| District of Columbia | 24 | 36 | 3.4 | 5.1 | 8 | 5 | 705,749 |
| Florida | 558 | 591 | 2.6 | 2.8 | 12 | 11 | 21,477,737 |
| Georgia | 299 | 271 | 2.8 | 2.6 | 10 | 13 | 10,617,423 |
| Hawaii | 99 | 120 | 7.0 | 8.4 | 2 | 2 | 1,415,872 |
| Idaho | 7 | 15 | 0.4 | 0.9 | 50 | 46 | 1,787,065 |
| Illinois | 326 | 319 | 2.6 | 2.5 | 14 | 16 | 12,671,821 |
| Indiana | 108 | 116 | 1.6 | 1.7 | 33 | 29 | 6,732,219 |
| Iowa | 52 | 49 | 1.6 | 1.6 | 32 | 34 | 3,155,070 |
| Kansas | 38 | 28 | 1.3 | 1.0 | 40 | 44 | 2,913,314 |
| Kentucky | 66 | 65 | 1.5 | 1.5 | 36 | 36 | 4,467,673 |
| Louisiana | 89 | 105 | 1.9 | 2.3 | 21 | 21 | 4,648,794 |
| Maine | 18 | 14 | 1.3 | 1.0 | 37 | 43 | 1,344,212 |
| Maryland | 210 | 210 | 3.5 | 3.5 | 7 | 7 | 6,045,680 |
| Massachusetts | 178 | 200 | 2.6 | 2.9 | 13 | 10 | 6,892,503 |
| Michigan | 131 | 108 | 1.3 | 1.1 | 39 | 42 | 9,986,857 |
| Minnesota | 148 | 172 | 2.6 | 3.1 | 11 | 9 | 5,639,632 |
| Mississippi | 56 | 80 | 1.9 | 2.7 | 22 | 12 | 2,976,149 |
| Missouri | 70 | 80 | 1.1 | 1.3 | 43 | 40 | 6,137,428 |
| Montana | 2 | 5 | 0.2 | 0.5 | 51 | 50 | 1,068,778 |
| Nebraska | 17 | 27 | 0.9 | 1.4 | 44 | 38 | 1,934,408 |
| Nevada | 52 | 69 | 1.7 | 2.3 | 30 | 19 | 3,080,156 |
| New Hampshire | 6 | 12 | 0.4 | 0.9 | 49 | 45 | 1,359,711 |
| New Jersey | 311 | 291 | 3.5 | 3.3 | 6 | 8 | 8,882,190 |
| New Mexico | 41 | 40 | 2.0 | 1.9 | 19 | 24 | 2,096,829 |
| New York State1 | 188 | 191 | 1.7 | 1.7 | 29 | 31 | 11,116,744 |
| New York City | 566 | 553 | 6.8 | 6.6 | 3 | 3 | 8,336,817 |
| North Carolina | 185 | 196 | 1.8 | 1.9 | 28 | 26 | 10,488,084 |
| North Dakota | 18 | 13 | 2.4 | 1.7 | 16 | 30 | 762,062 |
| Ohio | 150 | 178 | 1.3 | 1.5 | 41 | 35 | 11,689,100 |
| Oklahoma | 73 | 74 | 1.8 | 1.9 | 25 | 27 | 3,956,971 |
| Oregon | 70 | 81 | 1.7 | 1.9 | 31 | 23 | 4,217,737 |
| Pennsylvania | 198 | 213 | 1.5 | 1.7 | 35 | 33 | 12,801,989 |
| Rhode Island | 14 | 20 | 1.3 | 1.9 | 38 | 25 | 1,059,361 |
| South Carolina | 80 | 86 | 1.6 | 1.7 | 34 | 32 | 5,148,714 |
| South Dakota | 16 | 12 | 1.8 | 1.4 | 26 | 39 | 884,659 |
| Tennessee | 128 | 139 | 1.9 | 2.1 | 24 | 22 | 6,829,174 |
| Texas | 1,159 | 1,129 | 4.0 | 3.9 | 5 | 6 | 28,995,881 |
| Utah | 27 | 18 | 0.8 | 0.6 | 46 | 49 | 3,205,958 |
| Vermont | 4 | 5 | 0.6 | 0.8 | 47 | 48 | 623,989 |
| Virginia | 192 | 205 | 2.2 | 2.4 | 17 | 18 | 8,535,519 |
| Washington | 223 | 190 | 2.9 | 2.5 | 9 | 14 | 7,614,893 |
| West Virginia | 10 | 6 | 0.6 | 0.3 | 48 | 51 | 1,792,147 |
| Wisconsin | 51 | 49 | 0.9 | 0.8 | 45 | 47 | 5,822,434 |
| Wyoming | 1 | 1 | 0.2 | 0.2 | 52 | 52 | 578,759 |
| American Samoa2 | 1 | 2 | 2.0 | 3.9 | — | — | 50,135 |
| Fed. States of Micronesia2 | 91 | 102 | 79.8 | 90.3 | — | — | 114,000 |
| Guam2 | 79 | 71 | 47.0 | 42.3 | — | — | 168,147 |
| Marshall Islands2,3 | 226 | — | 383.1 | — | — | — | 59,000 |
| N. Mariana Islands2 | 51 | 47 | 98.6 | 90.4 | — | — | 51,718 |
| Puerto Rico2 | 36 | 28 | 1.1 | 0.9 | — | — | 3,193,694 |
| Republic of Palau2 | 6 | 17 | 33.3 | 94.4 | — | — | 18,000 |
| U.S. Virgin Islands2 | 1 | 1 | 0.9 | 0.9 | — | — | 106,631 |
1Excludes New York City.
2Not ranked with the U.S. regions or included with the U.S. totals.
3Emdashes (—) indicate that data are not available.
Note: Denominators for computing 2018 and 2019 rates for states, the District of Columbia, and Puerto Rico were obtained from U.S. Census Annual Estimates of the Resident Population for the United States, Regions, States, and Puerto Rico (April 1, 2010 to July 1, 2019) . Totals for U.S. territories were obtained from the International Data Base and totals for freely associated states were obtained from the United Nations, Department of Economic and Social Affairs, Population Division (2019). World Population Prospects 2019, Online Edition. Total Population(both sexes combined) by region, subregion and country, annually for 1950-2100 (thousands) Estimates, 1950 – 2020; accessed June 17, 2020.
See Technical Notes.