Reported Tuberculosis in the United States, 2019
Table 25. Tuberculosis Cases and Clusters, by Cluster Size1: United States, 2017–2019
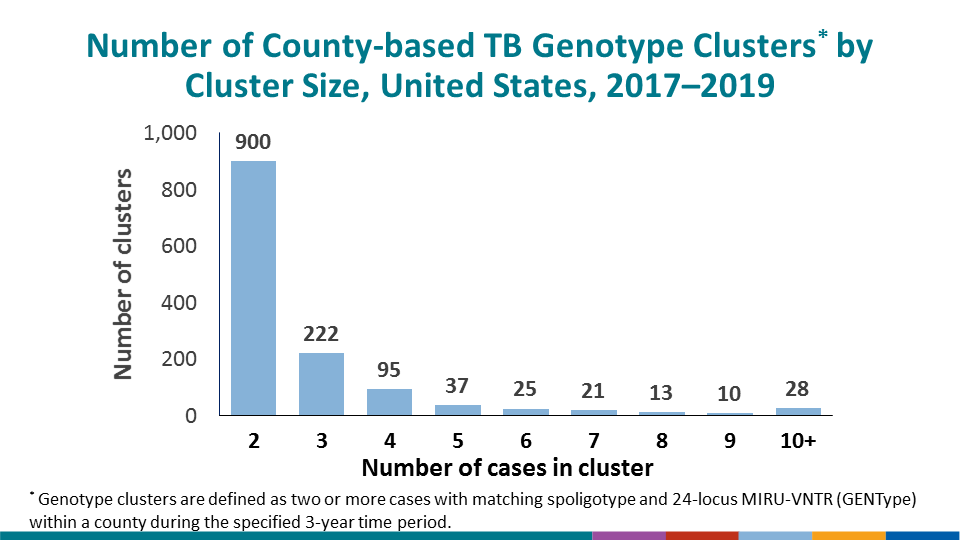
See Surveillance Slide #55
| Cluster Size | Clusters | Cases2 | ||
|---|---|---|---|---|
| No. | (%)3 | No. | (%)4 | |
| Total | 1,351 | (100.0) | 3,977 | (100.0) |
| 2 case cluster | 900 | (66.6) | 1,800 | (45.3) |
| 3 case cluster | 222 | (16.4) | 666 | (16.7) |
| 4 case cluster | 95 | (7.0) | 380 | (9.6) |
| 5 case cluster | 37 | (2.7) | 185 | (4.7) |
| 6 case cluster | 25 | (1.9) | 150 | (3.8) |
| 7 case cluster | 21 | (1.6) | 147 | (3.7) |
| 8 case cluster | 13 | (1.0) | 104 | (2.6) |
| 9 case cluster | 10 | (0.7) | 90 | (2.3) |
| ≥10 case cluster | 28 | (2.1) | 455 | (11.4) |
1Clusters have two or more cases with matching spoligotype and 24-locus locus mycobacterial interspersed repetitive unit-variable number tandem repeat type (GENType) within a county during the specified 3-year time period.
2Cases with matching spoligotype and 24-locus locus mycobacterial interspersed repetitive unit-variable number tandem repeat type (GENType) are members of a cluster within a county during the specified 3-year time period.
3Denominator is total number of clusters.
4Denominator is total number of cases.