Reported Tuberculosis in the United States, 2019
Table 23. Tuberculosis Risk Factors1, by Origin and Race/Ethnicity: United States, 2019
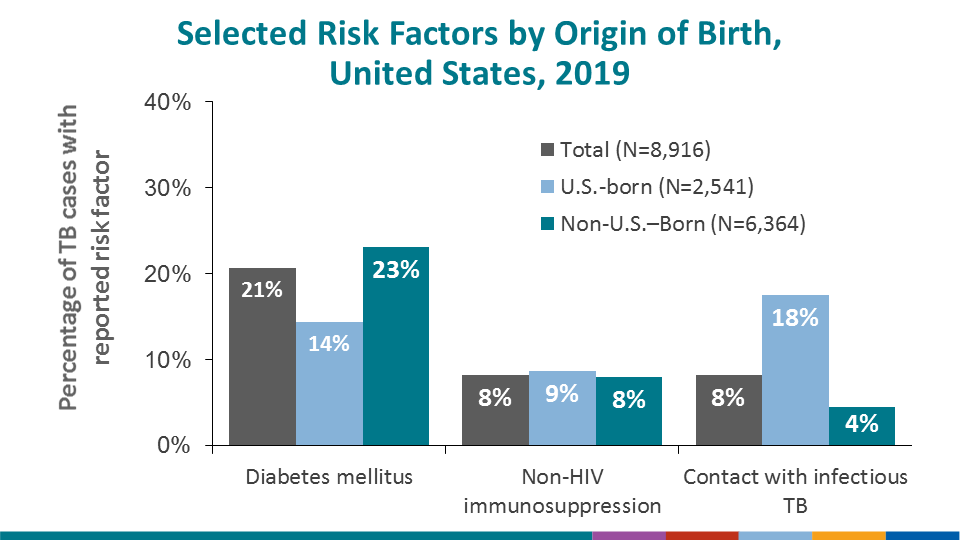
See Surveillance Slide #44
| Total Eligible Cases2 | Contact3 | HIV Coinfection | Non-HIV Immuno-Suppression4 | Diabetes Mellitus | Post-Organ Transplantation | TNF-α Inhibitors | Other | None | Unknown | |||||||||||
|---|---|---|---|---|---|---|---|---|---|---|---|---|---|---|---|---|---|---|---|---|
| No. | (%) | No. | (%) | No. | (%) | No. | (%) | No. | (%) | No. | (%) | No. | (%) | No. | (%) | No. | (%) | |||
| United States | 8,905 | 731 | (8.2) | 198 | (2.2) | 731 | (8.2) | 1,837 | (20.6) | 65 | (0.7) | 88 | (1.0) | 1,773 | (19.9) | 4,408 | (49.5) | 154 | (1.7) | |
| U.S.-born | U.S.-born Total | 2,541 | 445 | (17.5) | 66 | (2.6) | 221 | (8.7) | 366 | (14.4) | 15 | (0.6) | 26 | (1.0) | 569 | (22.4) | 1,133 | (44.6) | 38 | (1.5) |
| American Indian/Alaska Native | 80 | 26 | (32.5) | 1 | (1.3) | 6 | (7.5) | 10 | (12.5) | 0 | (0.0) | 1 | (1.3) | 13 | (16.3) | 38 | (47.5) | 1 | (1.3) | |
| Asian | 117 | 32 | (27.4) | 1 | (0.9) | 8 | (6.8) | 11 | (9.4) | 0 | (0.0) | 1 | (0.9) | 20 | (17.1) | 49 | (41.9) | 2 | (1.7) | |
| Black/African American | 912 | 161 | (17.7) | 34 | (3.7) | 83 | (9.1) | 146 | (16.0) | 9 | (1.0) | 1 | (0.1) | 235 | (25.8) | 386 | (42.3) | 9 | (1.0) | |
| Hispanic/Latino5 | 616 | 121 | (19.6) | 10 | (1.6) | 31 | (5.0) | 90 | (14.6) | 2 | (0.3) | 6 | (1.0) | 97 | (15.7) | 307 | (49.8) | 11 | (1.8) | |
| Multiple races6 | 20 | 3 | (15.0) | 2 | (10.0) | 3 | (15.0) | 3 | (15.0) | 0 | (0.0) | 0 | (0.0) | 2 | (10.0) | 10 | (50.0) | 1 | (5.0) | |
| Native Hawaiian/Other Pacific Islander | 25 | 13 | (52.0) | 0 | (0.0) | 1 | (4.0) | 4 | (16.0) | 0 | (0.0) | 0 | (0.0) | 3 | (12.0) | 4 | (16.0) | 0 | (0.0) | |
| White | 759 | 87 | (11.5) | 18 | (2.4) | 89 | (11.7) | 102 | (13.4) | 4 | (0.5) | 17 | (2.2) | 198 | (26.1) | 332 | (43.7) | 12 | (1.6) | |
| Unknown | 12 | 2 | (16.7) | 0 | (0.0) | 0 | (0.0) | 0 | (0.0) | 0 | (0.0) | 0 | (0.0) | 1 | (8.3) | 7 | (58.3) | 2 | (16.7) | |
| Non-U.S.–born | Non-U.S.–born Total | 6,364 | 286 | (4.5) | 132 | (2.1) | 510 | (8.0) | 1,471 | (23.1) | 50 | (0.8) | 62 | (1.0) | 1,204 | (18.9) | 3,275 | (51.5) | 116 | (1.8) |
| American Indian/Alaska Native | 2 | 0 | (0.0) | 0 | (0.0) | 0 | (0.0) | 0 | (0.0) | 0 | (0.0) | 0 | (0.0) | 0 | (0.0) | 2 | (100.0) | 0 | (0.0) | |
| Asian | 3,030 | 106 | (3.5) | 65 | (2.1) | 286 | (9.4) | 770 | (25.4) | 33 | (1.1) | 35 | (1.2) | 647 | (21.4) | 1,444 | (47.7) | 61 | (2.0) | |
| Black/African American | 840 | 40 | (4.8) | 32 | (3.8) | 45 | (5.4) | 80 | (9.5) | 2 | (0.2) | 3 | (0.4) | 147 | (17.5) | 529 | (63.0) | 13 | (1.5) | |
| Hispanic/Latino5 | 2,075 | 106 | (5.1) | 27 | (1.3) | 156 | (7.5) | 543 | (26.2) | 14 | (0.7) | 19 | (0.9) | 334 | (16.1) | 1,081 | (52.1) | 29 | (1.4) | |
| Multiple races6 | 48 | 3 | (6.3) | 1 | (2.1) | 2 | (4.2) | 11 | (22.9) | 0 | (0.0) | 1 | (2.1) | 7 | (14.6) | 27 | (56.3) | 0 | (0.0) | |
| Native Hawaiian/Other Pacific Islander | 80 | 17 | (21.3) | 2 | (2.5) | 4 | (5.0) | 24 | (30.0) | 1 | (1.3) | 0 | (0.0) | 8 | (10.0) | 34 | (42.5) | 2 | (2.5) | |
| White | 253 | 13 | (5.1) | 5 | (2.0) | 17 | (6.7) | 38 | (15.0) | 0 | (0.0) | 4 | (1.6) | 58 | (22.9) | 132 | (52.2) | 9 | (3.6) | |
| Unknown | 36 | 1 | (2.8) | 0 | (0.0) | 0 | (0.0) | 5 | (13.9) | 0 | (0.0) | 0 | (0.0) | 3 | (8.3) | 26 | (72.2) | 2 | (5.6) | |
1Includes the number of risk factors reported (which may be more than one per case) and the number of cases with no information on additional risk factors. The sum of risk factors is greater than the total number of cases because more than one risk factor may be selected per case.
2Excludes TB risk factor information for 11 cases with unknown origin.
3Includes risk factor responses of MDR patient contact, missed contact, and infectious TB patient contact.
4Includes risk factor responses of end-stage renal disease and non-HIV immunosuppression.
5Persons of Hispanic/Latino origin may be of any or multiple race.
6Indicated two or more races reported for a person, and does not include persons of Hispanic/Latino origin.
Note: Case counts for race categories (American Indian/Alaska Native, Asian, Black/African American, Native Hawaiian/Other Pacific Islander, and White) are mutually exclusive and do not include persons of Hispanic ethnicity or multiple race.