Reported Tuberculosis in the United States, 2019
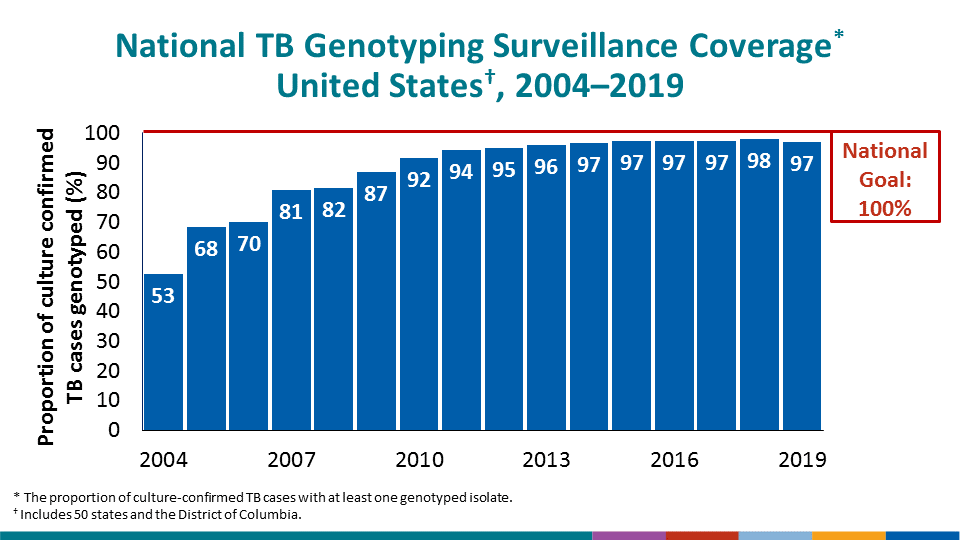
Table 16. National Tuberculosis Genotyping Surveillance Coverage1 : United States, 2004-2019
See Surveillance Slide #53
| Year | Reported TB Cases | Reported Culture-Positive Cases | Cases with Genotype Results | Genotype Surveillance Coverage |
|---|---|---|---|---|
| No. | No. | No. | (%) | |
| 2004 | 14,501 | 11,329 | 5,954 | (52.6) |
| 2005 | 14,062 | 10,954 | 7,497 | (68.4) |
| 2006 | 13,729 | 10,746 | 7,529 | (70.1) |
| 2007 | 13,288 | 10,434 | 8,425 | (80.7) |
| 2008 | 12,891 | 10,022 | 8,176 | (81.6) |
| 2009 | 11,503 | 8,868 | 7,700 | (86.8) |
| 2010 | 11,077 | 8,392 | 7,685 | (91.6) |
| 2011 | 10,483 | 8,066 | 7,600 | (94.2) |
| 2012 | 9,926 | 7,617 | 7,225 | (94.9) |
| 2013 | 9,551 | 7,359 | 7,052 | (95.8) |
| 2014 | 9,390 | 7,222 | 6,973 | (96.6) |
| 2015 | 9,537 | 7,410 | 7,200 | (97.2) |
| 2016 | 9,252 | 7,178 | 6,989 | (97.4) |
| 2017 | 9,082 | 7,142 | 6,954 | (97.4) |
| 2018 | 9,024 | 7,112 | 6,964 | (97.9) |
| 2019 | 8,916 | 7,087 | 6,875 | (97.0) |
1Genotype surveillance coverage is defined as the percentage of all culture positive tuberculosis (TB) cases for which there was a genotyped isolate.
Note: This table reflects genotyping surveillance coverage for the 50 states and the District of Columbia; for genotyping surveillance coverage of the U.S.-affiliated areas, please see Table 17.