Reported Tuberculosis in the United States, 2019
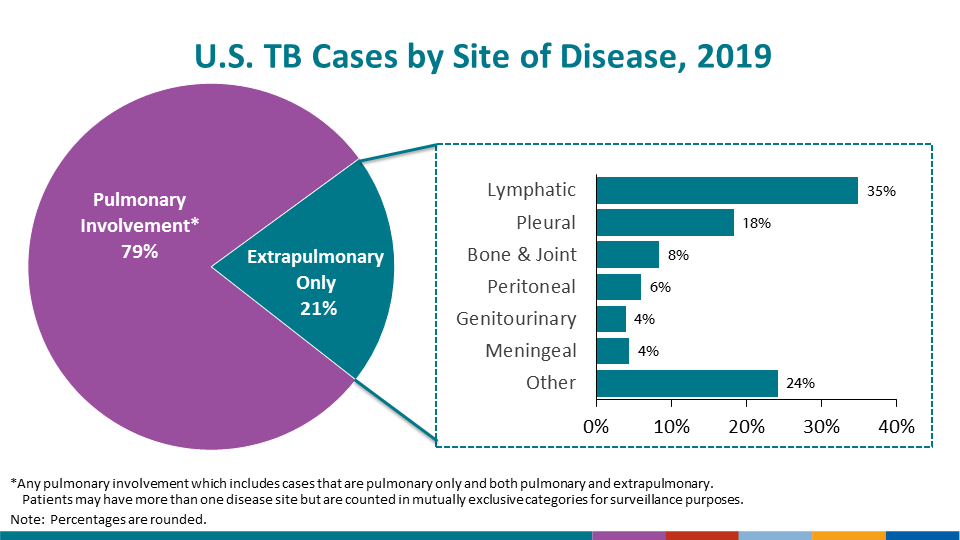
Table 15. Extrapulmonary Tuberculosis Cases and Percentages by Site of Disease: United States, 2010–2019
See Surveillance Slides #34
| Year | Total Extrapulmonary Cases1 | Total Extrapulmonary Sites2 | Site of Disease | |||||||||||||||
|---|---|---|---|---|---|---|---|---|---|---|---|---|---|---|---|---|---|---|
| Pleural | Lymphatic | Bone or Joint | Genitourinary | Meningeal | Peritoneal | Laryngeal | Other | |||||||||||
| No. | (%) | No. | (%) | No. | (%) | No. | (%) | No. | (%) | No. | (%) | No. | (%) | No. | (%) | |||
| 2010 | 2,411 | 2,515 | 393 | (15.6) | 1,011 | (40.2) | 270 | (10.7) | 115 | (4.6) | 138 | (5.5) | 140 | (5.6) | 2 | (0.1) | 446 | (17.7) |
| 2011 | 2,164 | 2,285 | 391 | (17.1) | 864 | (37.8) | 249 | (10.9) | 115 | (5.0) | 132 | (5.8) | 122 | (5.3) | 3 | (0.1) | 409 | (17.9) |
| 2012 | 2,078 | 2,190 | 365 | (16.7) | 844 | (38.5) | 226 | (10.3) | 109 | (5.0) | 103 | (4.7) | 126 | (5.8) | 4 | (0.2) | 413 | (18.9) |
| 2013 | 1,971 | 2,082 | 355 | (17.1) | 748 | (35.9) | 222 | (10.7) | 103 | (4.9) | 109 | (5.2) | 121 | (5.8) | 4 | (0.2) | 420 | (20.2) |
| 2014 | 1,925 | 2,034 | 333 | (16.4) | 778 | (38.2) | 209 | (10.3) | 98 | (4.8) | 98 | (4.8) | 117 | (5.8) | 4 | (0.2) | 397 | (19.5) |
| 2015 | 1,905 | 2,009 | 343 | (17.1) | 720 | (35.8) | 194 | (9.7) | 90 | (4.5) | 92 | (4.6) | 126 | (6.3) | 3 | (0.1) | 441 | (22.0) |
| 2016 | 1,870 | 1,974 | 323 | (16.4) | 703 | (35.6) | 192 | (9.7) | 92 | (4.7) | 85 | (4.3) | 121 | (6.1) | 2 | (0.1) | 456 | (23.1) |
| 2017 | 1,883 | 2,011 | 317 | (15.8) | 760 | (37.8) | 181 | (9.0) | 85 | (4.2) | 88 | (4.4) | 119 | (5.9) | 0 | (0.0) | 461 | (22.9) |
| 2018 | 1,810 | 1,917 | 317 | (16.5) | 714 | (37.2) | 184 | (9.6) | 89 | (4.6) | 72 | (3.8) | 112 | (5.8) | 3 | (0.2) | 426 | (22.2) |
| 2019 | 1,833 | 1,954 | 357 | (18.3) | 681 | (34.9) | 164 | (8.4) | 76 | (3.9) | 85 | (4.4) | 118 | (6.0) | 2 | (0.1) | 471 | (24.1) |
1Excludes cases with pulmonary site of disease and cases with site not stated.
2Patient might have more than one extrapulmonary site of disease.
See Technical Notes.