Reported Tuberculosis in the United States, 2019
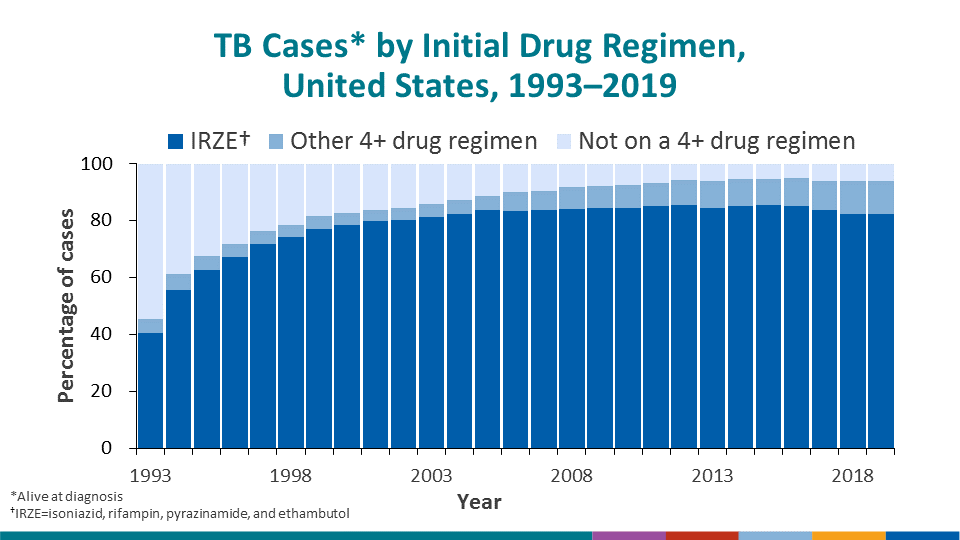
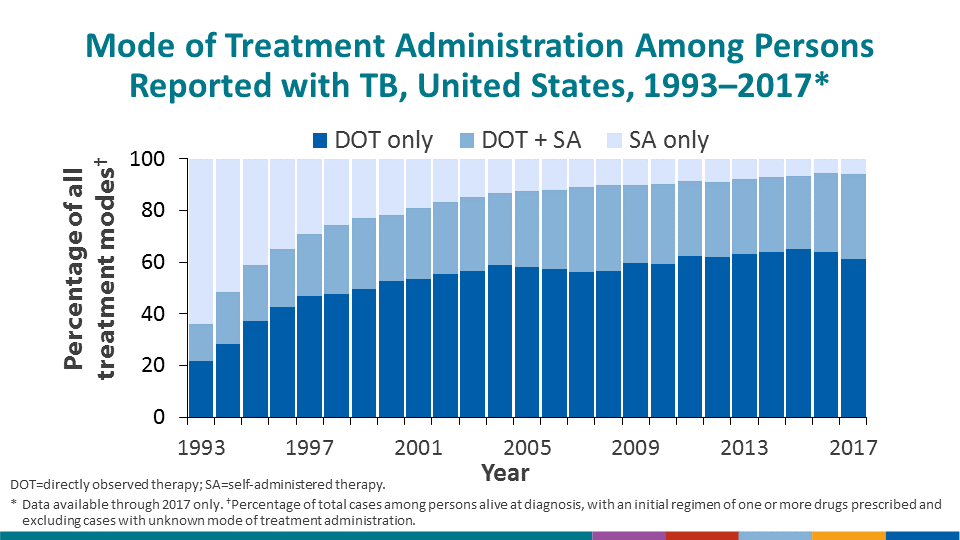
Table 10. Percentages of Tuberculosis Cases, by Initial Drug Regimen, Use of Directly Observed Therapy (DOT), and Completion of Therapy (COT): United States, 1993–2019
See Surveillance Slides #35, #36 , #37, #38 and #39
| Year | Initial Drug Regimen1,2 | Directly Observed Therapy3 | Therapy <1 Year Indicated4 | |||
|---|---|---|---|---|---|---|
| HRZE | Multi 4+ Drug Regimen5 | DOT Only | Both DOT & Self-Administered |
COT <1 Year | COT Ever | |
| 1993 | (40.3) | (5.0) | (21.7) | (14.4) | (63.4) | (86.0) |
| 1994 | (55.7) | (5.5) | (28.1) | (20.5) | (68.6) | (86.8) |
| 1995 | (62.7) | (4.8) | (37.3) | (21.5) | (74.1) | (89.2) |
| 1996 | (67.3) | (4.4) | (42.5) | (22.4) | (76.8) | (90.2) |
| 1997 | (71.9) | (4.3) | (47.0) | (23.8) | (78.7) | (91.0) |
| 1998 | (74.3) | (4.3) | (47.7) | (26.6) | (81.2) | (92.2) |
| 1999 | (76.9) | (4.7) | (49.4) | (27.6) | (81.4) | (92.2) |
| 2000 | (78.5) | (4.2) | (52.5) | (25.8) | (82.2) | (92.5) |
| 2001 | (79.8) | (3.9) | (53.6) | (27.5) | (82.5) | (92.7) |
| 2002 | (80.3) | (4.3) | (55.4) | (27.8) | (83.0) | (92.5) |
| 2003 | (81.3) | (4.7) | (56.5) | (28.5) | (83.6) | (92.8) |
| 2004 | (82.4) | (4.9) | (58.9) | (27.7) | (84.2) | (92.5) |
| 2005 | (83.7) | (5.0) | (57.9) | (29.6) | (84.0) | (92.5) |
| 2006 | (83.3) | (6.6) | (57.5) | (30.4) | (84.8) | (93.2) |
| 2007 | (83.8) | (6.5) | (56.3) | (32.9) | (85.5) | (93.8) |
| 2008 | (84.2) | (7.6) | (56.4) | (33.5) | (86.0) | (93.3) |
| 2009 | (84.3) | (7.8) | (59.7) | (30.2) | (88.8) | (95.6) |
| 2010 | (84.5) | (8.1) | (59.3) | (31.0) | (89.6) | (96.1) |
| 20116 | (85.2) | (8.1) | (62.3) | (29.1) | (89.7) | (96.5) |
| 20126 | (85.4) | (9.0) | (61.8) | (29.1) | (90.2) | (96.5) |
| 20136 | (84.6) | (9.5) | (63.3) | (28.8) | (89.8) | (96.3) |
| 20146 | (85.3) | (9.2) | (63.8) | (29.1) | (90.2) | (96.8) |
| 20156 | (85.4) | (9.2) | (65.0) | (28.5) | (90.1) | (96.4) |
| 20166 | (85.0) | (10.1) | (64.0) | (30.4) | (89.4) | (95.8) |
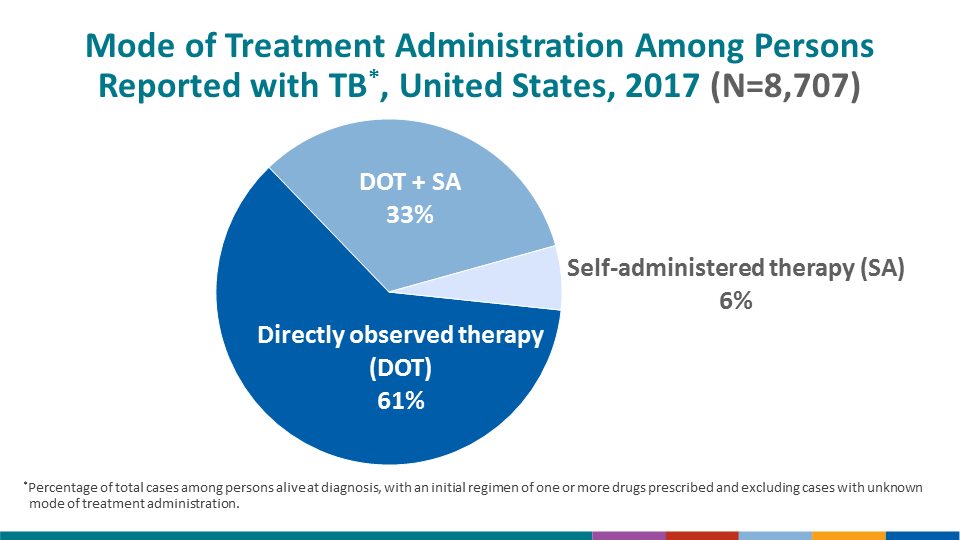
| 20176 | (83.7) | (10.2) | (61.2) | (32.9) | (89.8) | (95.8) |
| 20186 | (82.5) | (11.4) | — | — | — | — |
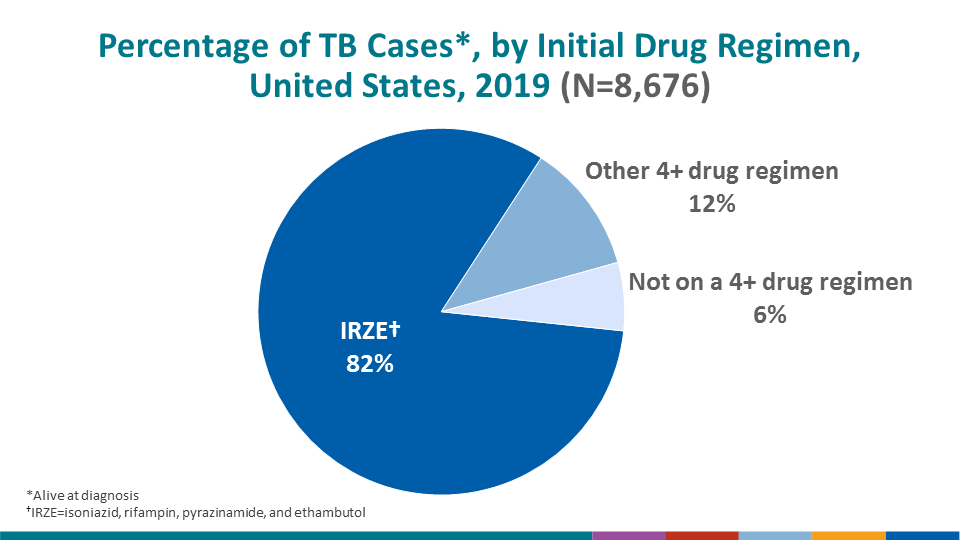
| 20196 | (82.5) | (11.5) | — | — | — | — |
1Includes persons alive at diagnosis.
2I, isoniazid; R, rifampin; Z, pyrazinamide; E, ethambutol. Excludes cases with no information on initial drug regimen. In 2019, 0.7% received no initial drug therapy and 0.1% were started on one drug.
3Includes persons alive at diagnosis with initial drug regimen of one or more drugs prescribed.
4Therapy ≤1 year indicated in persons alive at diagnosis with an initial drug regimen of one or more drugs prescribed, and who did not die within one year of initiating therapy. Persons with initial isolate rifampin resistant, or patient with bone and joint disease, meningeal disease or disease of the central nervous system, or pediatric patient (age <15) with miliary disease or positive blood culture or a positive nucleic acid amplification test on a blood specimen, and those who moved out of the country within one year of initiating treatment were excluded.
5Indicates at least a four drug regimen that is not IRZE only
6Beginning in 2011, those who moved out of the country during treatment are excluded from the denominator of those eligible for COT.
Note: Data as of June 10, 2020.
Data complete to 2017 for Directly Observed Therapy (DOT) and Completion of Therapy (COT).
See Technical Notes for details and for description of COT calculation.