Reported Tuberculosis in the United States, 2018
Table 8. Tuberculosis Cases and Percentages, by Resistance to Isoniazid (INH)1, Origin of Birth, and Previous History of TB: United States, 1993–2018
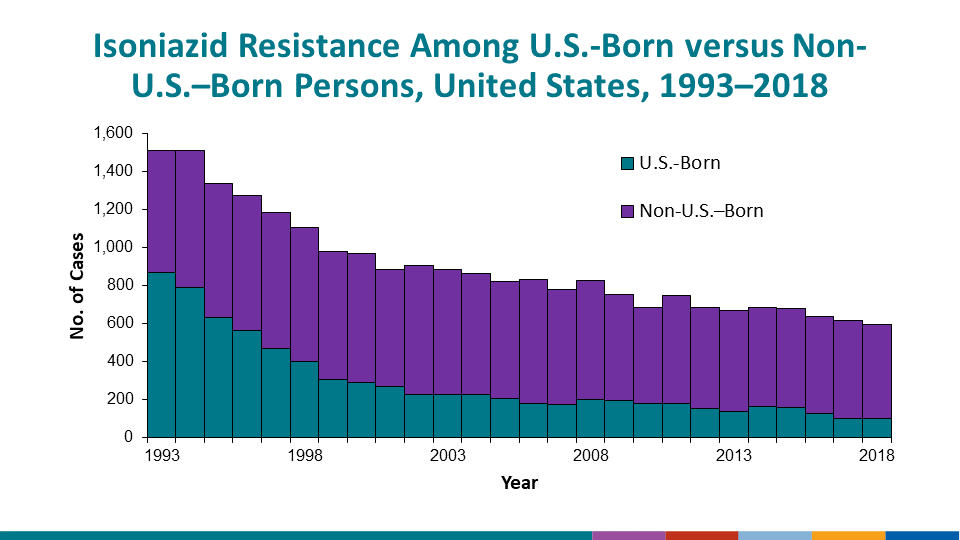
See Surveillance Slide #26.
| Year | All INH-Resistant2 | Isoniazid Resistant TB Cases | |||||||||||||||||
|---|---|---|---|---|---|---|---|---|---|---|---|---|---|---|---|---|---|---|---|
| Total INH-Resistant3 | U.S.-Born INH-Resistant3 | Non-U.S.–Born3,4 INH-Resistant | |||||||||||||||||
| Previous TB | No previous TB | Previous TB | No previous TB | Previous TB | No previous TB | ||||||||||||||
| Eligible | No. | (%) | Eligible | No. | (%) | Eligible | No. | (%) | Eligible | No. | (%) | Eligible | No. | (%) | Eligible | No. | (%) | ||
| 1993 | 1,534 | 982 | 161 | (16.4) | 16,601 | 1,367 | (8.2) | 668 | 83 | (12.4) | 11,808 | 789 | (6.7) | 301 | 75 | (24.9) | 4,665 | 564 | (12.1) |
| 1994 | 1,543 | 1033 | 175 | (16.9) | 16,418 | 1,352 | (8.2) | 693 | 81 | (11.7) | 11,010 | 708 | (6.4) | 336 | 93 | (27.7) | 5,291 | 632 | (11.9) |
| 1995 | 1,351 | 958 | 168 | (17.5) | 16,023 | 1,173 | (7.3) | 592 | 77 | (13.0) | 10,340 | 554 | (5.4) | 364 | 91 | (25.0) | 5,652 | 618 | (10.9) |
| 1996 | 1,284 | 862 | 142 | (16.5) | 15,360 | 1,133 | (7.4) | 559 | 68 | (12.2) | 9,637 | 495 | (5.1) | 303 | 74 | (24.4) | 5,676 | 637 | (11.2) |
| 1997 | 1,195 | 742 | 109 | (14.7) | 14,450 | 1,078 | (7.5) | 455 | 35 | (7.7) | 8,697 | 435 | (5.0) | 286 | 74 | (25.9) | 5,708 | 640 | (11.2) |
| 1998 | 1,120 | 749 | 98 | (13.1) | 13,420 | 1,011 | (7.5) | 485 | 38 | (7.8) | 7,695 | 366 | (4.8) | 262 | 60 | (22.9) | 5,692 | 643 | (11.3) |
| 1999 | 1,000 | 669 | 82 | (12.3) | 12,659 | 900 | (7.1) | 382 | 25 | (6.5) | 7,011 | 284 | (4.1) | 284 | 55 | (19.4) | 5,596 | 614 | (11.0) |
| 2000 | 981 | 632 | 84 | (13.3) | 11,829 | 889 | (7.5) | 360 | 22 | (6.1) | 6,141 | 269 | (4.4) | 272 | 62 | (22.8) | 5,659 | 617 | (10.9) |
| 2001 | 897 | 629 | 87 | (13.8) | 11,514 | 800 | (6.9) | 324 | 28 | (8.6) | 5,570 | 241 | (4.3) | 302 | 59 | (19.5) | 5,908 | 558 | (9.4) |
| 2002 | 912 | 570 | 80 | (14.0) | 10,820 | 826 | (7.6) | 303 | 23 | (7.6) | 5,059 | 206 | (4.1) | 265 | 57 | (21.5) | 5,720 | 619 | (10.8) |
| 2003 | 904 | 524 | 65 | (12.4) | 10,753 | 823 | (7.7) | 253 | 16 | (6.3) | 4,853 | 213 | (4.4) | 271 | 49 | (18.1) | 5,870 | 606 | (10.3) |
| 2004 | 872 | 537 | 64 | (11.9) | 10,482 | 801 | (7.6) | 274 | 15 | (5.5) | 4,683 | 214 | (4.6) | 263 | 49 | (18.6) | 5,789 | 587 | (10.1) |
| 2005 | 842 | 507 | 70 | (13.8) | 10,062 | 761 | (7.6) | 240 | 18 | (7.5) | 4,393 | 188 | (4.3) | 267 | 52 | (19.5) | 5,652 | 567 | (10.0) |
| 2006 | 845 | 493 | 67 | (13.6) | 9,907 | 770 | (7.8) | 203 | 9 | (4.4) | 4,126 | 173 | (4.2) | 289 | 57 | (19.7) | 5,765 | 596 | (10.3) |
| 2007 | 797 | 496 | 71 | (14.3) | 9,643 | 714 | (7.4) | 206 | 14 | (6.8) | 3,835 | 162 | (4.2) | 288 | 57 | (19.8) | 5,754 | 548 | (9.5) |
| 2008 | 835 | 429 | 57 | (13.3) | 9,303 | 774 | (8.3) | 170 | 13 | (7.6) | 3,645 | 188 | (5.2) | 259 | 44 | (17.0) | 5,652 | 585 | (10.4) |
| 2009 | 763 | 343 | 52 | (15.2) | 8,241 | 700 | (8.5) | 116 | 6 | (5.2) | 3,100 | 193 | (6.2) | 226 | 46 | (20.4) | 5,133 | 507 | (9.9) |
| 2010 | 694 | 360 | 63 | (17.5) | 7,799 | 624 | (8.0) | 131 | 13 | (9.9) | 2,929 | 165 | (5.6) | 229 | 50 | (21.8) | 4,864 | 459 | (9.4) |
| 2011 | 754 | 343 | 59 | (17.2) | 7,544 | 688 | (9.1) | 136 | 9 | (6.6) | 2,693 | 173 | (6.4) | 207 | 50 | (24.2) | 4,848 | 515 | (10.6) |
| 2012 | 686 | 356 | 55 | (15.4) | 7,079 | 631 | (8.9) | 127 | 8 | (6.3) | 2,519 | 146 | (5.8) | 229 | 47 | (20.5) | 4,560 | 485 | (10.6) |
| 2013 | 676 | 301 | 48 | (15.9) | 6,862 | 623 | (9.1) | 98 | 8 | (8.2) | 2,284 | 132 | (5.8) | 203 | 40 | (19.7) | 4,573 | 491 | (10.7) |
| 2014 | 688 | 336 | 63 | (18.8) | 6,740 | 621 | (9.2) | 95 | 5 | (5.3) | 2,178 | 162 | (7.4) | 241 | 58 | (24.1) | 4,558 | 459 | (10.1) |
| 2015 | 685 | 317 | 51 | (16.1) | 6,960 | 633 | (9.1) | 100 | 7 | (7.0) | 2,191 | 150 | (6.8) | 217 | 44 | (20.3) | 4,764 | 482 | (10.1) |
| 2016 | 645 | 301 | 56 | (18.6) | 6,701 | 585 | (8.7) | 83 | 7 | (8.4) | 2,035 | 119 | (5.8) | 218 | 49 | (22.5) | 4,662 | 466 | (10.0) |
| 2017 | 625 | 274 | 55 | (20.1) | 6,415 | 566 | (8.8) | 55 | 3 | (5.5) | 1,793 | 99 | (5.5) | 219 | 52 | (23.7) | 4,616 | 466 | (10.1) |
| 2018 | 605 | 268 | 49 | (18.3) | 6,093 | 549 | (9.0) | 50 | 6 | (12.0) | 1,722 | 94 | (5.5) | 218 | 43 | (19.7) | 4,365 | 455 | (10.4) |
1Resistance to at least isoniazid. Isolates may be resistant to other drugs. Excludes cases with susceptibility testing not done or unknown for isoniazid. Cases have been susceptibility tested to at least isoniazid and rifampin.
2This column provides an overall total of all INH-resistant cases, including those where previous history of TB is unknown and origin or birth is unknown.
3Excludes cases where previous history of TB is missing or unknown.
4Includes persons born outside the United States or the U.S. territories, except persons born to at least one U.S. citizen parent.
Note: Data for all years updated through June 6, 2019.