Reported Tuberculosis in the United States, 2018
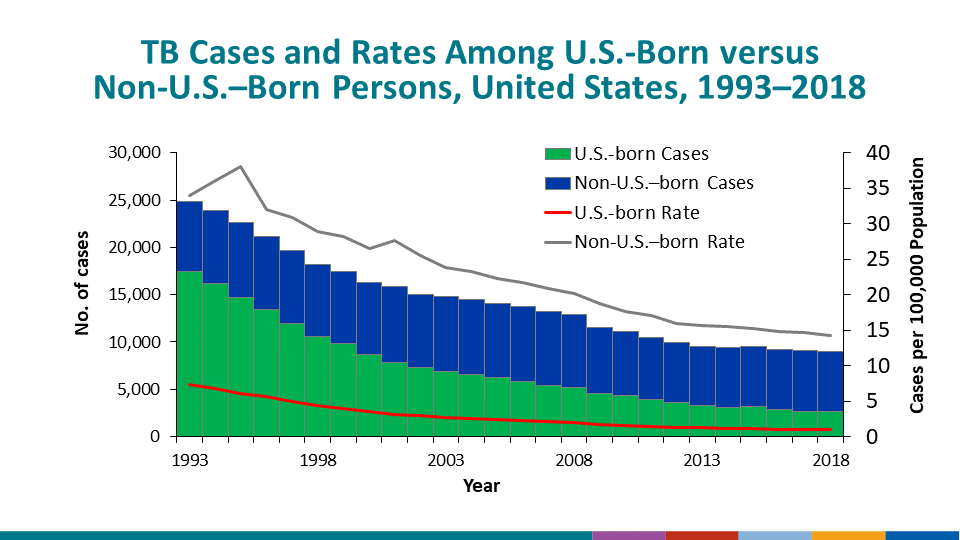
Table 5. Tuberculosis Cases, Percentages, and Case Rates per 100,000 Population by Origin of Birth: United States, 1993–2018
See Surveillance Slide #8.
| Year | Total Cases | U.S.-Born Persons | Non-U.S.–Born Persons1 | Unknown/Missing | |||||
|---|---|---|---|---|---|---|---|---|---|
| No. | (%) | Rate | No. | (%) | Rate | No. | (%) | ||
| 1993 | 25,102 | 17,433 | (69.4) | 7.4 | 7,403 | (29.5) | 34.0 | 266 | (1.1) |
| 1994 | 24,207 | 16,181 | (66.8) | 6.8 | 7,762 | (32.1) | 36.1 | 264 | (1.1) |
| 1995 | 22,726 | 14,663 | (64.5) | 6.1 | 8,010 | (35.2) | 38.0 | 53 | (0.2) |
| 1996 | 21,210 | 13,385 | (63.1) | 5.6 | 7,752 | (36.5) | 32.0 | 73 | (0.3) |
| 1997 | 19,752 | 11,925 | (60.4) | 4.9 | 7,753 | (39.3) | 30.9 | 74 | (0.4) |
| 1998 | 18,286 | 10,609 | (58.0) | 4.4 | 7,623 | (41.7) | 28.9 | 54 | (0.3) |
| 1999 | 17,499 | 9,783 | (55.9) | 4.0 | 7,624 | (43.6) | 28.1 | 92 | (0.5) |
| 2000 | 16,308 | 8,632 | (52.9) | 3.5 | 7,634 | (46.8) | 26.5 | 42 | (0.3) |
| 2001 | 15,945 | 7,848 | (49.2) | 3.2 | 8,034 | (50.4) | 27.6 | 63 | (0.4) |
| 2002 | 15,055 | 7,263 | (48.2) | 2.9 | 7,737 | (51.4) | 25.5 | 55 | (0.4) |
| 2003 | 14,836 | 6,842 | (46.1) | 2.7 | 7,948 | (53.6) | 23.9 | 46 | (0.3) |
| 2004 | 14,499 | 6,601 | (45.5) | 2.6 | 7,875 | (54.3) | 23.2 | 23 | (0.2) |
| 2005 | 14,062 | 6,287 | (44.7) | 2.5 | 7,745 | (55.1) | 22.3 | 30 | (0.2) |
| 2006 | 13,727 | 5,858 | (42.7) | 2.3 | 7,845 | (57.2) | 21.7 | 24 | (0.2) |
| 2007 | 13,277 | 5,427 | (40.9) | 2.1 | 7,779 | (58.6) | 20.9 | 71 | (0.5) |
| 2008 | 12,886 | 5,235 | (40.6) | 2.0 | 7,642 | (59.3) | 20.2 | 9 | (0.1) |
| 2009 | 11,512 | 4,499 | (39.1) | 1.7 | 6,996 | (60.8) | 18.8 | 17 | (0.1) |
| 2010 | 11,088 | 4,313 | (38.9) | 1.6 | 6,766 | (61.0) | 17.6 | 9 | (0.1) |
| 2011 | 10,491 | 3,929 | (37.5) | 1.5 | 6,557 | (62.5) | 17.0 | 5 | (0.0) |
| 2012 | 9,928 | 3,618 | (36.4) | 1.3 | 6,307 | (63.5) | 16.0 | 3 | (0.0) |
| 2013 | 9,554 | 3,327 | (34.8) | 1.2 | 6,218 | (65.1) | 15.7 | 9 | (0.1) |
| 2014 | 9,389 | 3,119 | (33.2) | 1.1 | 6,264 | (66.7) | 15.5 | 6 | (0.1) |
| 2015 | 9,539 | 3,128 | (32.8) | 1.1 | 6,406 | (67.2) | 15.2 | 5 | (0.1) |
| 2016 | 9,253 | 2,886 | (31.2) | 1.0 | 6,361 | (68.7) | 14.8 | 6 | (0.1) |
| 2017 | 9,088 | 2,685 | (29.5) | 1.0 | 6,395 | (70.4) | 14.7 | 8 | (0.1) |
| 2018 | 9,025 | 2,666 | (29.5) | 1.0 | 6,335 | (70.2) | 14.3 | 24 | (0.3) |
1Includes persons born outside the United States (including U.S. territories), except persons born to at least one U.S. citizen parent.
Note: Denominators for computing rates for year 1993 was obtained from Quarterly Estimates of the United States Foreign-Born and Native Resident Populations: April 1, 1990–July 1, 1999; accessed June 24, 2019. Denominators for computing the 1994–2018 rates are based on the U.S. Census Bureau, Current Population Survey via Data Ferrett; accessed June 24, 2019.
Data for all years updated through June 6, 2019.
See Technical Notes.
Zero % (0.0) denotes <0.05%.