Reported Tuberculosis in the United States, 2018
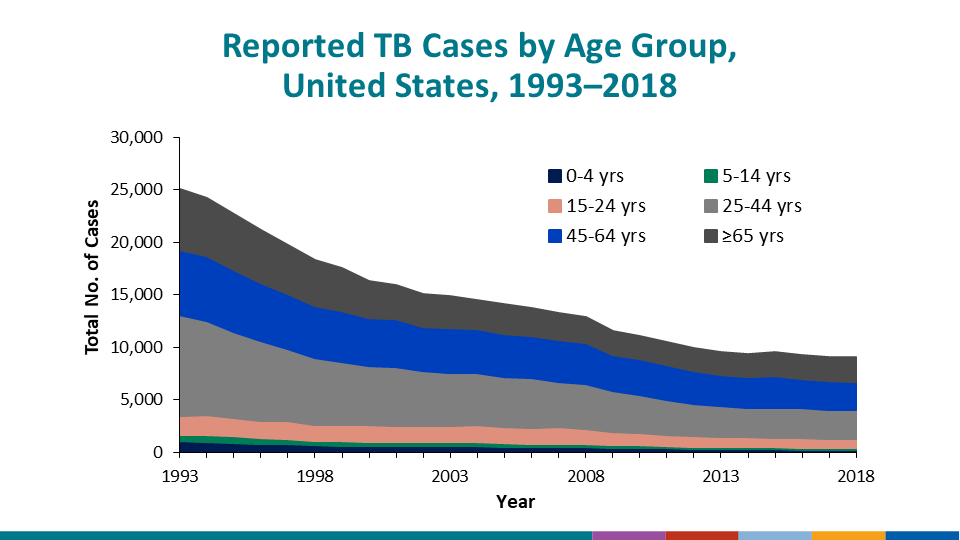
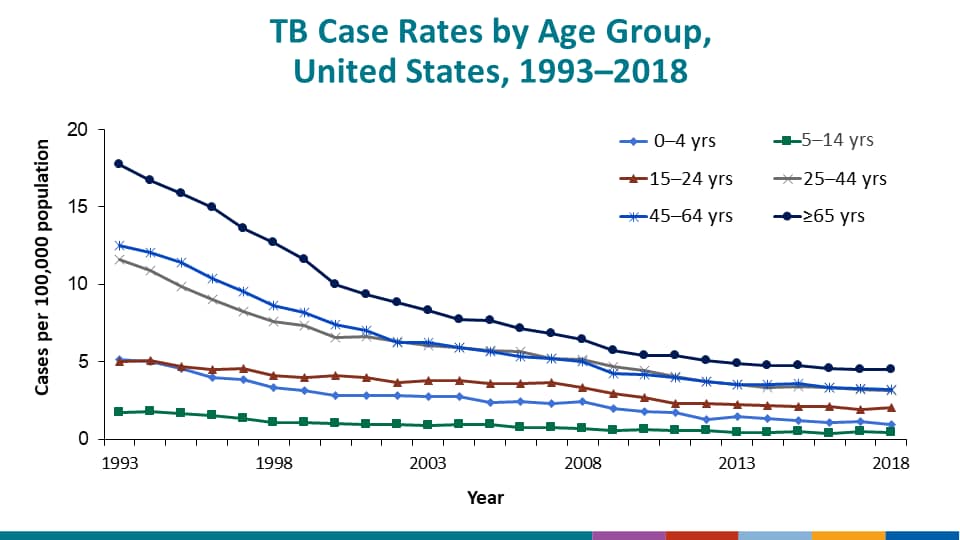
Table 4. Tuberculosis Cases, Percentages, and Case Rates per 100,000 Population by Age Group: United States, 1993–2018
See Surveillance Slides #15 and #16.
| Year | Total Cases | 0─4 | 5─14 | 15─24 | 25─44 | 45─64 | ≥65 | Unknown/Missing | |||||||||||||
|---|---|---|---|---|---|---|---|---|---|---|---|---|---|---|---|---|---|---|---|---|---|
| No. | (%) | Rate | No. | (%) | Rate | No. | (%) | Rate | No. | (%) | Rate | No. | (%) | Rate | No. | (%) | Rate | No. | (%) | ||
| 1993 | 25,102 | 1,014 | (4.0) | 5.2 | 646 | (2.6) | 1.7 | 1,821 | (7.3) | 5.0 | 9,589 | (38.2) | 11.6 | 6,195 | (24.7) | 12.5 | 5,820 | (23.2) | 17.7 | 17 | (0.1) |
| 1994 | 24,207 | 995 | (4.1) | 5.1 | 664 | (2.7) | 1.8 | 1,832 | (7.6) | 5.1 | 9,044 | (37.4) | 10.9 | 6,126 | (25.3) | 12.0 | 5,540 | (22.9) | 16.7 | 6 | (0.0) |
| 1995 | 22,726 | 894 | (3.9) | 4.6 | 642 | (2.8) | 1.7 | 1,697 | (7.5) | 4.7 | 8,200 | (36.1) | 9.8 | 5,960 | (26.2) | 11.4 | 5,328 | (23.4) | 15.8 | 5 | (0.0) |
| 1996 | 21,210 | 770 | (3.6) | 4.0 | 586 | (2.8) | 1.5 | 1,637 | (7.7) | 4.5 | 7,564 | (35.7) | 9.0 | 5,572 | (26.3) | 10.4 | 5,076 | (23.9) | 14.9 | 5 | (0.0) |
| 1997 | 19,752 | 734 | (3.7) | 3.8 | 517 | (2.6) | 1.3 | 1,675 | (8.5) | 4.6 | 6,884 | (34.9) | 8.2 | 5,278 | (26.7) | 9.5 | 4,663 | (23.6) | 13.6 | 1 | (0.0) |
| 1998 | 18,286 | 638 | (3.5) | 3.4 | 439 | (2.4) | 1.1 | 1,543 | (8.4) | 4.1 | 6,335 | (34.6) | 7.6 | 4,954 | (27.1) | 8.7 | 4,377 | (23.9) | 12.7 | 0 | (0.0) |
| 1999 | 17,499 | 602 | (3.4) | 3.2 | 436 | (2.5) | 1.1 | 1,518 | (8.7) | 4.0 | 6,062 | (34.6) | 7.3 | 4,860 | (27.8) | 8.2 | 4,019 | (23.0) | 11.6 | 2 | (0.0) |
| 2000 | 16,308 | 544 | (3.3) | 2.8 | 420 | (2.6) | 1.0 | 1,618 | (9.9) | 4.1 | 5,576 | (34.2) | 6.6 | 4,635 | (28.4) | 7.4 | 3,515 | (21.6) | 10.0 | 0 | (0.0) |
| 2001 | 15,945 | 543 | (3.4) | 2.8 | 386 | (2.4) | 0.9 | 1,597 | (10.0) | 4.0 | 5,610 | (35.2) | 6.6 | 4,515 | (28.3) | 7.0 | 3,293 | (20.7) | 9.3 | 1 | (0.0) |
| 2002 | 15,055 | 556 | (3.7) | 2.9 | 388 | (2.6) | 0.9 | 1,498 | (10.0) | 3.7 | 5,288 | (35.1) | 6.3 | 4,182 | (27.8) | 6.3 | 3,142 | (20.9) | 8.8 | 1 | (0.0) |
| 2003 | 14,836 | 547 | (3.7) | 2.8 | 364 | (2.5) | 0.9 | 1,573 | (10.6) | 3.8 | 5,074 | (34.2) | 6.1 | 4,284 | (28.9) | 6.2 | 2,994 | (20.2) | 8.3 | 0 | (0.0) |
| 2004 | 14,499 | 549 | (3.8) | 2.8 | 403 | (2.8) | 1.0 | 1,603 | (11.1) | 3.8 | 4,939 | (34.1) | 5.9 | 4,193 | (28.9) | 5.9 | 2,811 | (19.4) | 7.8 | 1 | (0.0) |
| 2005 | 14,062 | 474 | (3.4) | 2.4 | 377 | (2.7) | 0.9 | 1,540 | (11.0) | 3.6 | 4,737 | (33.7) | 5.7 | 4,126 | (29.3) | 5.6 | 2,808 | (20.0) | 7.7 | 0 | (0.0) |
| 2006 | 13,727 | 482 | (3.5) | 2.4 | 321 | (2.3) | 0.8 | 1,532 | (11.2) | 3.6 | 4,689 | (34.2) | 5.7 | 4,039 | (29.4) | 5.4 | 2,663 | (19.4) | 7.2 | 1 | (0.0) |
| 2007 | 13,277 | 467 | (3.5) | 2.3 | 310 | (2.3) | 0.8 | 1,580 | (11.9) | 3.7 | 4,310 | (32.5) | 5.2 | 4,036 | (30.4) | 5.2 | 2,573 | (19.4) | 6.8 | 1 | (0.0) |
| 2008 | 12,886 | 494 | (3.8) | 2.4 | 289 | (2.2) | 0.7 | 1,443 | (11.2) | 3.3 | 4,238 | (32.9) | 5.1 | 3,927 | (30.5) | 5.0 | 2,495 | (19.4) | 6.4 | 0 | (0.0) |
| 2009 | 11,512 | 403 | (3.5) | 2.0 | 244 | (2.1) | 0.6 | 1,279 | (11.1) | 2.9 | 3,885 | (33.7) | 4.7 | 3,419 | (29.7) | 4.3 | 2,282 | (19.8) | 5.8 | 0 | (0.0) |
| 2010 | 11,088 | 365 | (3.3) | 1.8 | 270 | (2.4) | 0.7 | 1,186 | (10.7) | 2.7 | 3,649 | (32.9) | 4.4 | 3,415 | (30.8) | 4.2 | 2,203 | (19.9) | 5.4 | 0 | (0.0) |
| 2011 | 10,491 | 350 | (3.3) | 1.7 | 226 | (2.2) | 0.6 | 1,028 | (9.8) | 2.3 | 3,362 | (32.0) | 4.1 | 3,286 | (31.3) | 4.0 | 2,239 | (21.3) | 5.4 | 0 | (0.0) |
| 2012 | 9,928 | 261 | (2.6) | 1.3 | 226 | (2.3) | 0.5 | 1,019 | (10.3) | 2.3 | 3,118 | (31.4) | 3.8 | 3,112 | (31.3) | 3.8 | 2,191 | (22.1) | 5.1 | 1 | (0.0) |
| 2013 | 9,554 | 294 | (3.1) | 1.5 | 188 | (2.0) | 0.5 | 978 | (10.2) | 2.2 | 2,963 | (31.0) | 3.6 | 2,952 | (30.9) | 3.6 | 2,179 | (22.8) | 4.9 | 0 | (0.0) |
| 2014 | 9,389 | 263 | (2.8) | 1.3 | 195 | (2.1) | 0.5 | 961 | (10.2) | 2.2 | 2,821 | (30.0) | 3.4 | 2,957 | (31.5) | 3.5 | 2,192 | (23.3) | 4.7 | 0 | (0.0) |
| 2015 | 9,539 | 244 | (2.6) | 1.2 | 196 | (2.1) | 0.5 | 936 | (9.8) | 2.1 | 2,858 | (30.0) | 3.4 | 3,022 | (31.7) | 3.6 | 2,283 | (23.9) | 4.8 | 0 | (0.0) |
| 2016 | 9,253 | 223 | (2.4) | 1.1 | 163 | (1.8) | 0.4 | 935 | (10.1) | 2.1 | 2,831 | (30.6) | 3.3 | 2,843 | (30.7) | 3.4 | 2,255 | (24.4) | 4.6 | 3 | (0.0) |
| 2017 | 9,088 | 227 | (2.5) | 1.1 | 202 | (2.2) | 0.5 | 846 | (9.3) | 2.0 | 2,757 | (30.3) | 3.2 | 2,758 | (30.3) | 3.3 | 2,294 | (25.2) | 4.5 | 4 | (0.0) |
| 2018 | 9,025 | 186 | (2.1) | 0.9 | 186 | (2.1) | 0.5 | 874 | (9.7) | 2.0 | 2,728 | (30.2) | 3.1 | 2,694 | (29.9) | 3.2 | 2,354 | (26.1) | 4.5 | 3 | (0.0) |
Note: Previously published rates for 1993–1999 have been updated using Resident Population: Monthly Postcensal Resident Population, by single year of age, sex, race, and Hispanic origin; accessed June 24, 2019). Denominators for computing 2000–2009 case rates were obtained from the Intercensal Estimates of the Resident Population by Sex and Age for the United States: April 1, 2000 to July 1, 2010, and Annual Estimates of the Resident Population for Selected Age Groups by Sex: April 1, 2010 to July 1, 2018; accessed July 19, 2019.
Data for all years updated through June 6, 2019.
See Technical Notes.
Zero % (0.0) denotes <0.05%.