Reported Tuberculosis in the United States, 2018
Table 24. Characteristics of Tuberculosis Cases in GENType Clusters1, by Alert Levels Based on Log-Likelihood Ratios (LLR)2: United States, 2016–2018
See Surveillance Slide #41
| Case Characteristics | Unique | Clustered | Alert Levels for Clustered Cases3 | ||||||||
|---|---|---|---|---|---|---|---|---|---|---|---|
| Non-alerted (LLR <5) | Medium (LLR 5 – <10) | High (LLR ≥10) | |||||||||
| No. | (%) | No. | (%) | No. | (%) | No. | (%) | No. | (%) | ||
| Total | 16,779 | 80.7 | 4,001 | 19.3 | 2,355 | 58.9 | 903 | 22.6 | 743 | 18.6 | |
| Origin of Birth | |||||||||||
| U.S-born | 4,044 | 67.2 | 1,970 | 32.8 | 780 | 39.6 | 575 | 29.2 | 615 | 31.2 | |
| Non-U.S.–born | 12,717 | 86.3 | 2,025 | 13.7 | 1,572 | 77.6 | 326 | 16.1 | 127 | 6.3 | |
| Unknown or Missing | 18 | 75.0 | 6 | 25.0 | 3 | 50.0 | 2 | 33.3 | 1 | 16.7 | |
| Race and Ethnicity | |||||||||||
| Hispanic or Latino | 4,564 | 78.0 | 1,286 | 22.0 | 847 | 65.9 | 293 | 22.8 | 146 | 11.4 | |
| American Indian/Alaska Native | 129 | 50.6 | 126 | 49.4 | 14 | 11.1 | 39 | 31.0 | 73 | 57.9 | |
| Asian | 6,659 | 87.7 | 938 | 12.3 | 807 | 86.0 | 89 | 9.5 | 42 | 4.5 | |
| Black or African American | 3,053 | 73.5 | 1,101 | 26.5 | 434 | 39.4 | 317 | 28.8 | 350 | 31.8 | |
| Native Hawaiian/Other Pacific Islander | 135 | 62.8 | 80 | 37.2 | 40 | 50.0 | 18 | 22.5 | 22 | 27.5 | |
| White | 2,064 | 82.6 | 434 | 17.4 | 196 | 45.2 | 135 | 31.1 | 103 | 23.7 | |
| Multiple Race | 118 | 85.5 | 20 | 14.5 | 7 | 35.0 | 6 | 30.0 | 7 | 35.0 | |
| Unknown or Missing | 57 | 78.1 | 16 | 21.9 | 10 | 62.5 | 6 | 37.5 | 0 | 0.0 | |
| Age Group (Years) | |||||||||||
| 0–4 | 81 | 42.9 | 108 | 57.1 | 54 | 50.0 | 29 | 26.9 | 25 | 23.1 | |
| 5–14 | 118 | 57.8 | 86 | 42.2 | 42 | 48.8 | 21 | 24.4 | 23 | 26.7 | |
| 15–24 | 1,554 | 77.0 | 464 | 23.0 | 276 | 59.5 | 108 | 23.3 | 80 | 17.2 | |
| 25–44 | 5,110 | 80.0 | 1,280 | 20.0 | 724 | 56.6 | 298 | 23.3 | 258 | 20.2 | |
| 45–64 | 4,908 | 78.1 | 1,380 | 21.9 | 773 | 56.0 | 327 | 23.7 | 280 | 20.3 | |
| ≥65 | 5,003 | 88.0 | 683 | 12.0 | 486 | 71.2 | 120 | 17.6 | 77 | 11.3 | |
| Unknown | 5 | 100.0 | 0 | 0.0 | 0 | 0.0 | 0 | 0.0 | 0 | 0.0 | |
| Disease Site | |||||||||||
| Pulmonary Only | 11,907 | 79.0 | 3,156 | 21.0 | 1,811 | 57.4 | 743 | 23.5 | 602 | 19.1 | |
| Extrapulmonary | 2,845 | 87.4 | 410 | 12.6 | 269 | 65.6 | 80 | 19.5 | 61 | 14.9 | |
| Both | 2,001 | 82.5 | 423 | 17.5 | 265 | 62.6 | 80 | 18.9 | 78 | 18.4 | |
| Unknown | 26 | 68.4 | 12 | 31.6 | 10 | 83.3 | 0 | 0.0 | 2 | 16.7 | |
| Sputum Smear | |||||||||||
| Positive | 7,559 | 77.8 | 2,157 | 22.2 | 1,237 | 57.3 | 531 | 24.6 | 389 | 18.0 | |
| Negative | 7,091 | 83.3 | 1,419 | 16.7 | 881 | 62.1 | 269 | 19.0 | 269 | 19.0 | |
| Not Done | 2,108 | 83.3 | 423 | 16.7 | 236 | 55.8 | 102 | 24.1 | 85 | 20.1 | |
| Unknown or Missing | 21 | 91.3 | 2 | 8.7 | 1 | 50.0 | 1 | 50.0 | 0 | 0.0 | |
| Cavitary Disease4 | |||||||||||
| Yes | 170 | 75.9 | 54 | 24.1 | 30 | 55.6 | 10 | 18.5 | 14 | 25.9 | |
| No | 1,379 | 82.2 | 298 | 17.8 | 186 | 62.4 | 59 | 19.8 | 53 | 17.8 | |
| Unknown or Missing | 4 | 100.0 | 0 | 0.0 | 0 | 0.0 | 0 | 0.0 | 0 | 0.0 | |
| Homeless Within Past Year | |||||||||||
| Yes | 596 | 60.1 | 395 | 39.9 | 168 | 42.5 | 100 | 25.3 | 127 | 32.2 | |
| No | 16,036 | 81.8 | 3,564 | 18.2 | 2,162 | 60.7 | 794 | 22.3 | 608 | 17.1 | |
| Unknown or Missing | 147 | 77.8 | 42 | 22.2 | 25 | 59.5 | 9 | 21.4 | 8 | 19.0 | |
| Excess Alcohol Use Within the Past Year | |||||||||||
| Yes | 1,385 | 67.5 | 667 | 32.5 | 275 | 41.2 | 196 | 29.4 | 196 | 29.4 | |
| No | 15,084 | 82.3 | 3,244 | 17.7 | 2,020 | 62.3 | 688 | 21.2 | 536 | 16.5 | |
| Unknown or Missing | 310 | 77.5 | 90 | 22.5 | 60 | 66.7 | 19 | 21.1 | 11 | 12.2 | |
| Injecting Illicit Drug Use Within Past Year | |||||||||||
| Yes | 164 | 64.8 | 89 | 35.2 | 29 | 32.6 | 33 | 37.1 | 27 | 30.3 | |
| No | 16,334 | 81.1 | 3,807 | 18.9 | 2,264 | 59.5 | 842 | 22.1 | 701 | 18.4 | |
| Unknown or Missing | 281 | 72.8 | 105 | 27.2 | 62 | 59.0 | 28 | 26.7 | 15 | 14.3 | |
| Non-Injecting Illicit Drug Use Within Past Year | |||||||||||
| Yes | 893 | 60.3 | 589 | 39.7 | 241 | 40.9 | 150 | 25.5 | 198 | 33.6 | |
| No | 15,610 | 82.4 | 3,323 | 17.6 | 2,059 | 62.0 | 730 | 22.0 | 534 | 16.1 | |
| Unknown or Missing | 276 | 75.6 | 89 | 24.4 | 55 | 61.8 | 23 | 25.8 | 11 | 12.4 | |
| Resident of a Correctional Facility at the Time of Diagnosis | |||||||||||
| Yes | 461 | 71.5 | 184 | 28.5 | 84 | 45.7 | 46 | 25.0 | 54 | 29.3 | |
| No | 16,242 | 81.1 | 3,786 | 18.9 | 2,249 | 59.4 | 850 | 22.5 | 687 | 18.1 | |
| Unknown or Missing | 76 | 71.0 | 31 | 29.0 | 22 | 71.0 | 7 | 22.6 | 2 | 6.5 | |
| HIV Status | |||||||||||
| Positive | 776 | 76.8 | 234 | 23.2 | 115 | 49.1 | 60 | 25.6 | 59 | 25.2 | |
| Negative | 14,066 | 80.5 | 3,405 | 19.5 | 1,988 | 58.4 | 781 | 22.9 | 636 | 18.7 | |
| Refused | 369 | 84.6 | 67 | 15.4 | 49 | 73.1 | 14 | 20.9 | 4 | 6.0 | |
| Not Offered | 1,024 | 82.9 | 211 | 17.1 | 141 | 66.8 | 31 | 14.7 | 39 | 18.5 | |
| Unknown, Missing or Indeterminate | 544 | 86.6 | 84 | 13.4 | 62 | 73.8 | 17 | 20.2 | 5 | 6.0 | |
| Multidrug-Resistant TB | |||||||||||
| Yes | 256 | 81.3 | 59 | 18.7 | 39 | 66.1 | 2 | 3.4 | 18 | 30.5 | |
| No | 15,649 | 81.0 | 3,682 | 19.0 | 2,176 | 59.1 | 843 | 22.9 | 663 | 18.0 | |
| Unknown or Missing | 874 | 77.1 | 260 | 22.9 | 140 | 53.8 | 58 | 22.3 | 62 | 23.8 | |
1GENType clusters have ≥2 cases with matching spoligotype and 24-locus mycobacterial interspersed repetitive unit–variable number tandem repeat type (MIRU-VNTR) within a county or county-equivalent area during the specified 3-year period.
2Alert levels are based on an LLR, which calculates the geographical concentration of a genotype in a county or county equivalent, compared with the rest of the country during a 3-year period.
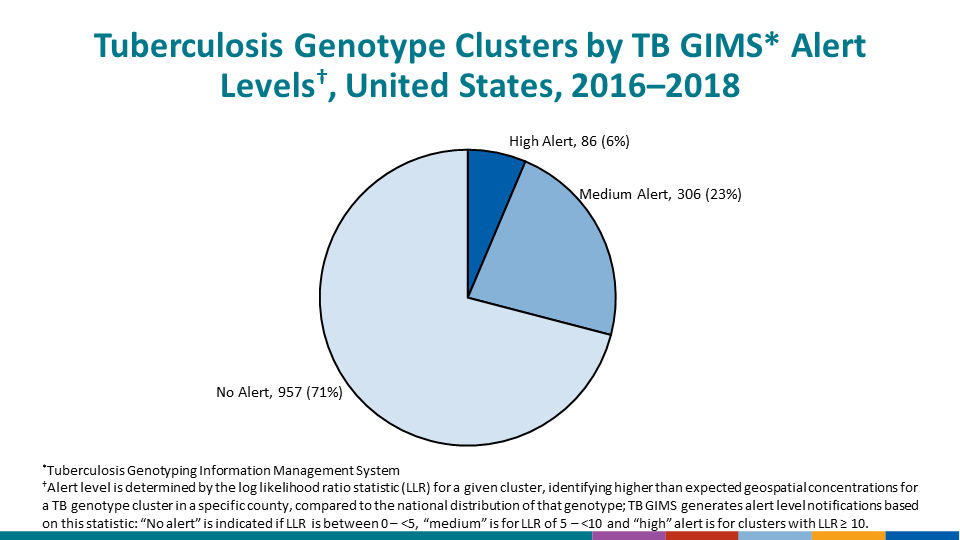
3A total of 4,001 cases occurred in 1,349 clusters: 743 cases were in 86 (6.4%) high-alert clusters; 903 cases were in 306 (22.7%) medium-alert clusters; and 2,355 cases were in 957 (70.9%) nonalert clusters.
4Cavitary disease was only assessed for persons with pulmonary TB and an abnormal chest radiograph.
Notes: Case counts for race categories (American Indian/Alaska Native, Asian, black/African American, Native Hawaiian/Other Pacific Islander, and white) are mutually exclusive and do not include persons of Hispanic ethnicity or of multiple races. Multiple race does not include persons of Hispanic ethnicity.