Reported Tuberculosis in the United States, 2018
Table 20. Tuberculosis Cases and Rates per 100,000 Population, by Hispanic Ethnicity and Non-Hispanic Race, Sex, and Age Group: United States, 2018
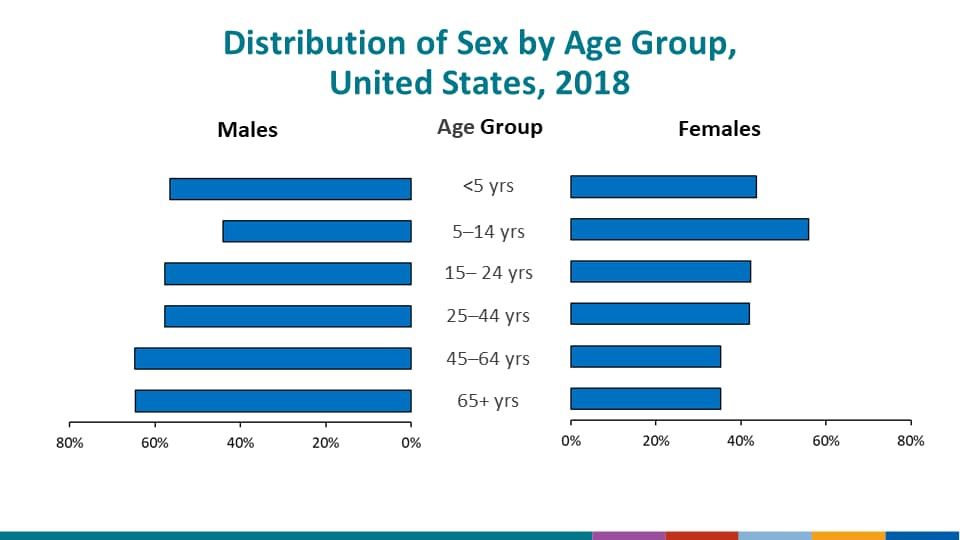
See Surveillance Slide #17.
| Race/Ethnicity/Sex | All Ages | Age Group | ||||||||||||||
|---|---|---|---|---|---|---|---|---|---|---|---|---|---|---|---|---|
| <5 | 5–14 | 15–24 | 25–44 | 45–64 | ≥65 | Unknown | ||||||||||
| No. | Rate | No. | Rate | No. | Rate | No. | Rate | No. | Rate | No. | Rate | No. | Rate | No. | Rate | |
| Total Cases | 9,025 | 2.8 | 186 | 0.9 | 186 | 0.5 | 874 | 2.0 | 2,728 | 3.1 | 2,694 | 3.2 | 2,354 | 4.5 | 3 | — |
| Male | 5,527 | 3.4 | 105 | 1.0 | 82 | 0.4 | 504 | 2.3 | 1,573 | 3.6 | 1,743 | 4.3 | 1,519 | 6.5 | 1 | — |
| Female | 3,476 | 2.1 | 81 | 0.8 | 104 | 0.5 | 369 | 1.8 | 1,146 | 2.7 | 948 | 2.2 | 828 | 2.8 | 0 | — |
| Unknown | 22 | — | 0 | — | 0 | — | 1 | — | 9 | — | 3 | — | 7 | — | 2 | — |
| Hispanic / Latino1 | 2,617 | 4.4 | 71 | 1.4 | 87 | 0.8 | 357 | 3.6 | 863 | 4.8 | 720 | 6.0 | 518 | 11.7 | 1 | — |
| Male | 1,704 | 5.6 | 36 | 1.4 | 39 | 0.7 | 227 | 4.5 | 589 | 6.3 | 500 | 8.4 | 313 | 16.3 | 0 | — |
| Female | 912 | 3.1 | 35 | 1.4 | 48 | 0.9 | 130 | 2.7 | 274 | 3.2 | 220 | 3.7 | 205 | 8.2 | 0 | — |
| Unknown | 1 | — | 0 | — | 0 | — | 0 | — | 0 | — | 0 | — | 0 | — | 1 | — |
| American Indian / Alaska Native | 104 | 4.3 | 7 | 4.3 | 9 | 2.6 | 7 | 1.9 | 21 | 3.1 | 36 | 6.1 | 24 | 8.4 | 0 | — |
| Male | 62 | 5.2 | 5 | 6.0 | 5 | 2.8 | 6 | 3.3 | 13 | 3.9 | 25 | 8.9 | 8 | 6.2 | 0 | — |
| Female | 42 | 3.4 | 2 | 2.5 | 4 | 2.3 | 1 | 0.6 | 8 | 2.4 | 11 | 3.6 | 16 | 10.1 | 0 | — |
| Unknown | 0 | — | 0 | — | 0 | — | 0 | — | 0 | — | 0 | — | 0 | — | 0 | — |
| Asian | 3,190 | 17.0 | 33 | 3.3 | 24 | 1.2 | 247 | 10.3 | 898 | 14.4 | 921 | 19.8 | 1,066 | 45.0 | 1 | — |
| Male | 1,850 | 20.7 | 23 | 4.5 | 6 | 0.6 | 132 | 11.0 | 440 | 14.7 | 547 | 25.6 | 701 | 68.6 | 1 | — |
| Female | 1,338 | 13.6 | 10 | 2.1 | 18 | 1.8 | 115 | 9.7 | 457 | 14.0 | 374 | 14.9 | 364 | 27.0 | 0 | — |
| Unknown | 2 | — | 0 | — | 0 | — | 0 | — | 1 | — | 0 | — | 1 | — | 0 | — |
| Black / African American | 1,799 | 4.4 | 49 | 1.8 | 45 | 0.8 | 194 | 3.2 | 635 | 5.5 | 568 | 5.6 | 308 | 6.5 | 0 | — |
| Male | 1,100 | 5.6 | 31 | 2.2 | 24 | 0.8 | 106 | 3.5 | 358 | 6.3 | 380 | 8.1 | 201 | 10.4 | 0 | — |
| Female | 696 | 3.3 | 18 | 1.3 | 21 | 0.8 | 88 | 2.9 | 275 | 4.6 | 187 | 3.5 | 107 | 3.8 | 0 | — |
| Unknown | 3 | — | 0 | — | 0 | — | 0 | — | 2 | — | 1 | — | 0 | — | 0 | — |
| Native Hawaiian / Other Pacific Islander | 117 | 20.0 | 10 | 24.6 | 7 | 8.5 | 16 | 18.9 | 41 | 21.7 | 32 | 24.1 | 11 | 19.4 | 0 | — |
| Male | 56 | 19.0 | 4 | 19.3 | 2 | 4.8 | 8 | 18.4 | 16 | 16.5 | 17 | 26.0 | 9 | 33.9 | 0 | — |
| Female | 61 | 20.9 | 6 | 30.1 | 5 | 12.4 | 8 | 19.4 | 25 | 27.2 | 15 | 22.2 | 2 | 6.6 | 0 | — |
| Unknown | 0 | — | 0 | — | 0 | — | 0 | — | 0 | — | 0 | — | 0 | — | 0 | — |
| White | 1,074 | 0.5 | 11 | 0.1 | 11 | 0.1 | 39 | 0.2 | 224 | 0.5 | 387 | 0.7 | 401 | 1.0 | 1 | — |
| Male | 691 | 0.7 | 5 | 0.1 | 4 | 0.0 | 17 | 0.1 | 131 | 0.5 | 262 | 1.0 | 272 | 1.5 | 0 | — |
| Female | 380 | 0.4 | 6 | 0.1 | 7 | 0.1 | 22 | 0.2 | 92 | 0.4 | 125 | 0.4 | 128 | 0.6 | 0 | — |
| Unknown | 3 | — | 0 | — | 0 | — | 0 | — | 1 | — | 0 | — | 1 | — | 1 | — |
| Multiple Race2 | 59 | 0.8 | 4 | 0.4 | 3 | 0.2 | 8 | 0.6 | 20 | 1.2 | 12 | 1.3 | 12 | 3.0 | 0 | — |
| Male | 35 | 1.0 | 0 | 0.0 | 2 | 0.2 | 6 | 0.9 | 13 | 1.7 | 5 | 1.1 | 9 | 5.0 | 0 | — |
| Female | 24 | 0.7 | 4 | 0.9 | 1 | 0.1 | 2 | 0.3 | 7 | 0.8 | 7 | 1.4 | 3 | 1.3 | 0 | — |
| Unknown | 0 | — | 0 | — | 0 | — | 0 | — | 0 | — | 0 | — | 0 | — | 0 | — |
| Unknown | 65 | — | 1 | — | 0 | — | 6 | — | 26 | — | 18 | — | 14 | — | 0 | — |
| Male | 29 | — | 1 | — | 0 | — | 2 | — | 13 | — | 7 | — | 6 | — | 0 | — |
| Female | 23 | — | 0 | — | 0 | — | 3 | — | 8 | — | 9 | — | 3 | — | 0 | — |
| Unknown | 13 | — | 0 | — | 0 | — | 1 | — | 5 | — | 2 | — | 5 | — | 0 | — |
1Persons of Hispanic/Latino origin may be of any or multiple race.
2Indicates two or more races reported for a person, and does not include persons of Hispanic/Latino origin.
Note: Denominators for computing 2018 case rates were obtained from the U.S. Census Annual Estimates of the Resident Population by Sex, Age, Race and Hispanic Origin: April 1, 2010 to July 1, 2018 accessed June 20, 2019.
Case counts for race categories (American Indian/Alaska Native, Asian, black/African American, Native Hawaiian/Other Pacific Islander, and white) are mutually exclusive and do not include persons of Hispanic/Latino origin or multiple race.
See Technical Notes.