Reported Tuberculosis in the United States, 2018
Table 16. National Tuberculosis Genotyping Surveillance Coverage1 : United States, 2004-2018
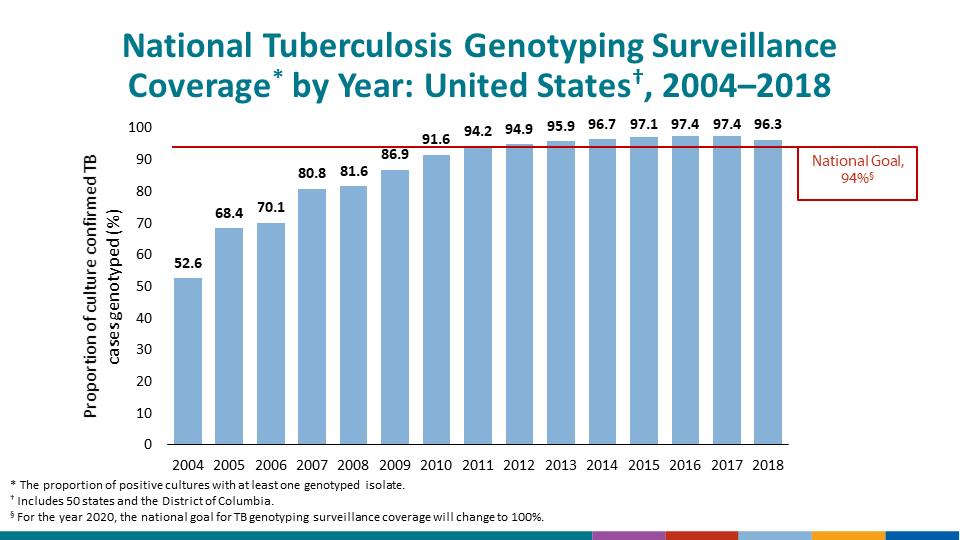
See Surveillance Slide #38.
| Year | Reported TB Cases | Reported Culture-Positive Cases | Cases with Genotype Results | Genotype Surveillance Coverage |
|---|---|---|---|---|
| No. | No. | No. | (%) | |
| 2004 | 14,499 | 11,327 | 5,954 | 52.6 |
| 2005 | 14,062 | 10,954 | 7,497 | 68.4 |
| 2006 | 13,727 | 10,744 | 7,529 | 70.1 |
| 2007 | 13,277 | 10,422 | 8,425 | 80.8 |
| 2008 | 12,886 | 10,017 | 8,175 | 81.6 |
| 2009 | 11,512 | 8,878 | 7,708 | 86.9 |
| 2010 | 11,088 | 8,401 | 7,692 | 91.6 |
| 2011 | 10,491 | 8,073 | 7,605 | 94.2 |
| 2012 | 9,928 | 7,619 | 7,227 | 94.9 |
| 2013 | 9,554 | 7,361 | 7,053 | 95.9 |
| 2014 | 9,389 | 7,221 | 6,976 | 96.7 |
| 2015 | 9,539 | 7,412 | 7,202 | 97.1 |
| 2016 | 9,253 | 7,177 | 6,993 | 97.4 |
| 2017 | 9,088 | 7,132 | 6,950 | 97.4 |
| 2018 | 9,025 | 7,062 | 6,831 | 96.3 |
1Genotype surveillance coverage is defined as the percentage of all culture positive tuberculosis (TB) cases for which there was a genotyped isolate.
Note: This table reflects genotyping surveillance coverage for the 50 states and the District of Columbia; for genotyping surveillance coverage of the U.S.-affiliated areas, please see Table 17.