Reported Tuberculosis in the United States, 2018
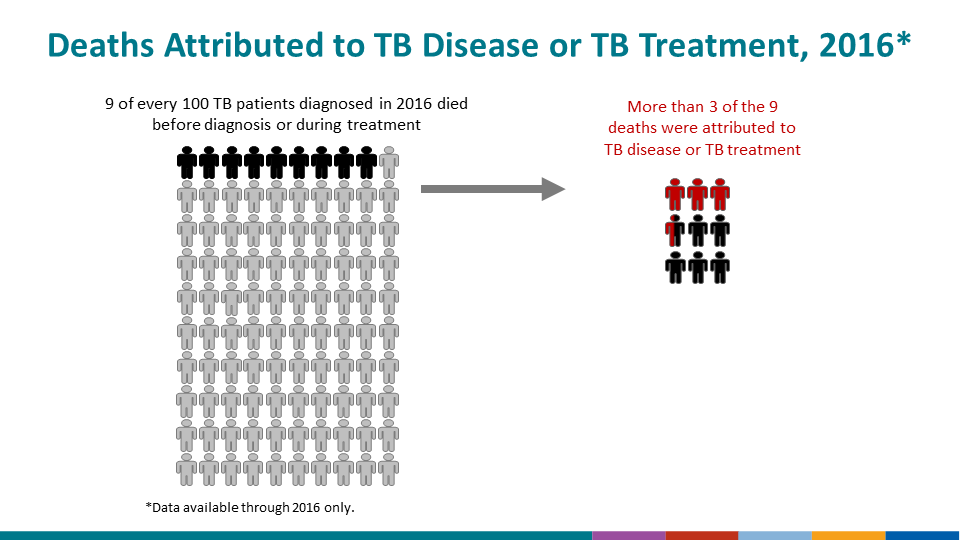
Table 13. Deaths Among Reported Tuberculosis Cases: United States, 2010–2016
See Surveillance Slide #36
| Year | Total | Dead at Diagnosis | Died after Diagnosis | ||||||||||||||
| Total Deaths Reported | Deaths Related to TB Disease or Therapy1 | Total Dead at TB Diagnosis | TB a Cause of Death | TB not a Cause of Death | Cause of Death Unknown/Missing | Total Died During Therapy | Related to TB Therapy/Disease2 | Unrelated to TB Therapy/Disease | Cause of Death Unknown/Missing | ||||||||
| No. | No. | (%) | No. | No. | (%) | No. | (%) | No. | (%) | No. | No. | (%) | No. | (%) | No. | (%) | |
| 2010 | 915 | 320 | (35.0) | 245 | 79 | (32.2) | 123 | (50.2) | 43 | (17.6) | 670 | 241 | (36.0) | 310 | (46.3) | 119 | (17.8) |
| 2011 | 945 | 349 | (36.9) | 241 | 89 | (36.9) | 102 | (42.3) | 50 | (20.7) | 704 | 260 | (36.9) | 317 | (45.0) | 127 | (18.0) |
| 2012 | 834 | 278 | (33.3) | 212 | 65 | (30.7) | 98 | (46.2) | 49 | (23.1) | 622 | 213 | (34.2) | 296 | (47.6) | 113 | (18.2) |
| 2013 | 811 | 280 | (34.5) | 212 | 64 | (30.2) | 109 | (51.4) | 39 | (18.4) | 599 | 216 | (36.1) | 278 | (46.4) | 105 | (17.5) |
| 2014 | 770 | 283 | (36.8) | 193 | 61 | (31.6) | 99 | (51.3) | 33 | (17.1) | 577 | 222 | (38.5) | 243 | (42.1) | 112 | (19.4) |
| 2015 | 793 | 274 | (34.6) | 207 | 63 | (30.4) | 102 | (49.3) | 42 | (20.3) | 586 | 211 | (36.0) | 261 | (44.5) | 114 | (19.5) |
| 2016 | 833 | 315 | (37.8) | 206 | 69 | (33.5) | 97 | (47.1) | 40 | (19.4) | 627 | 246 | (39.2) | 257 | (41.0) | 124 | (19.8) |
1Includes patients who were dead at diagnosis or died during therapy, for which TB or TB therapy was indicated as a cause of death.
210 patient deaths were related to TB therapy in 2016.
Note: Data for all years are updated through June 6, 2019.