NSSP Update – February 2019

- Community of Practice
- Where Science and Practice Meet
- Workgroup and Committee Updates
- NSSP Community of Practice Call
- Implementation Guide for Syndromic Surveillance
- CDC Funding Recipients and Partnerships

- Data Quality Corner
- NSSP Posts BioSense Platform Enhancements
- NSSP Adds Quarterly Metrics to Site Folders
- NSSP Updates Data Dictionary and Companion “Journeys” Guide
- Questions and Tips
Spotlight Article: Characterizing the Effects of Extreme Cold
- Technical Updates
- NSSP Introduces “Batch Add”
- Active Facility Audit Underway
- AMC Update Rescheduled
- Assessment of 2018 Hurricane Season Response
- Current Month and Upcoming Events
- Last Month’s Technical Assistance
- NSSP Participation
People
Community of Practice
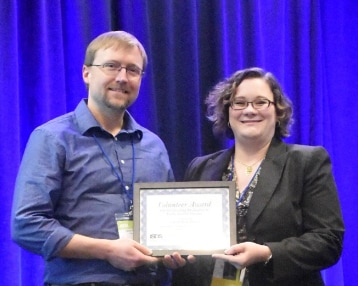
CDC Health Scientist Aaron Kite-Powell receives 2019 Award for Outstanding Dedication in Public Health Practice from ISDS Director of Informatics Emilie Lamb. This award recognizes an individual who regularly and repeatedly offers time and knowledge to support the community in whatever activities are needed to advance public health practice. Kite-Powell is part of CDC’s Division of Health Informatics and Surveillance, which oversees NSSP. Photo by Catherine Tong.
Where Science and Practice Meet
At this year’s 2019 International Society for Disease Surveillance (ISDS) Annual Conference, members of the NSSP Community of Practice (NSSP CoP) had an opportunity to enhance their skills and share best practices with data analysts, epidemiologists, and others in public health as well as academic and international peers. The conference draws professionals from a broad range of disciplines to learn the latest achievements, analytic methods, best practices, conceptual frameworks, and technical innovations in the rapidly evolving field of disease surveillance. The conference also acknowledges people who have contributed significantly to public health surveillance.
NSSP CoP members represented about 30 percent of the 380 conference attendees from 28 countries, and their work was showcased in many posters and discussions. Keynote speakers were Dr. William Kassler, IBM Watson Health, and Dr. Michael Hogarth, Clinical Research Information Officer at the University of California, San Diego. Over the four-day event, data analysts, health scientists, and other public health practitioners gave presentations and held workshops on diverse topics ranging from R, ESSENCE, and data visualization techniques to animal health, disaster surveillance, opioid and substance abuse, and infectious disease surveillance.
Workgroup and Committee Updates

CDC Health Scientist Peter Hicks thanks the community for contributing to the HL7 2.5.1 Implementation Guide for Syndromic Surveillance and describes how it will improve system interoperability. Hicks was recognized for serving as Scientific Program Chair of the ISDS Conference, 2019. He is part of CDC's Division of Health Informatics and Surveillance, which oversees NSSP. Photo by Catherine Tong.
NSSP CoP leadership and committees convened during the conference to appreciate accomplishments, refresh agendas, and develop new ways to build the value of syndromic surveillance for public health action:
- The NSSP CoP Steering Committee discussed community needs and brainstormed ways to respond in upcoming months. T-shirt slogans conveyed sentiment: “Talk data to me,” “You know you want my data…” and “Success is REAL (Recognizing Everyday Accomplishments Loudly).” Committee members used these slogans to spark conversation and generate ideas for future projects, such as sharing data dashboards to improve public health practice.
- The Syndromic Surveillance Public Health Emergency Preparedness, Response & Recovery Committee collaborated on new ideas for connecting syndromic surveillance with public health preparedness.
- The Technical Committee members used the Swap Meet as an opportunity to discuss the committee’s role in meeting the needs of NSSP participants. Ideas shared with the Technical Committee included seeking out the needs of sites that use NSSP as their sole syndromic surveillance tool, modernizing visualizations in ESSENCE, and identifying long-term goals for the NSSP BioSense Platform.
- ISDS recognized theSyndrome Definition Committee (SDC) as the Most Engaged Group, an award based on engagement metrics from the six months leading up to the conference. The SCD owes a huge thanks to its members for the great community and forum presence they’ve built. Their booth at the Swap Meet stayed busy as attendees previewed Developing, Evaluating, and Disseminating Definitions for Syndromic Surveillance in Public Health Practice: A Guidance Document. Booth visitors were encouraged to write down ideas for potential SDC projects. More than 30 ideas for syndrome definition work and refinement were suggested.*
- ISDS awarded second place for Most Engaged Group to the Data Quality Committee (DQC). More good news—the DQC has identified a potential new co-chair (details to follow). Also, thanks to the DQC, community volunteers are helping NSSP to improve data quality on projects.

*If you gave a presentation on a new or revised syndrome definition at the 2019 ISDS Conference, please upload it to the Knowledge Repository’s Syndrome Definition Library. A FREE account is required. Click here to register.
Note. Conference photos are posted on the ISDS website.
NSSP Community of Practice Call
Please join the monthly NSSP CoP call. This call is powered by community members who want to share resources and technical assistance and includes an open forum for discussion and questions. The next call will be held February 19, 2019, 3:00–4:30 PM ET. In observance of American Heart Health Month, the topic will be Cardiovascular Disease Surveillance. Click here to register for the entire call series.
To access slides and recordings from previous calls, visit the NSSP Community of Practice Group Page.
Implementation Guide for Syndromic Surveillance
| HL7 2.5.1 Implementation Guide Milestones* | |
|---|---|
| Time Frame | Activity |
| 2015 | Completed Version 2.0 Final RELEASE** |
| 2016 | Released Erratum and Clarification Documents for Version 2.0 |
| 2017 Summer | Released Version 2.2 Working Draft for Community Comment and Consensus |
| 2017 Winter | Released Version 2.3 for Review and Community Comment |
| 2018 March | Released Version .09 |
| 2018 Spring | Submitted DRAFT HL7 Guide for Balloting: Implementation Guide for Syndromic Surveillance Release 1.0 Standard for Trial Use (STU) HL7 Version 2.5.1 |
| 2018 Fall (October–December) |
|
| 2018 November– 2019 March |
|
| 2019 February |
|
| 2019 March | Submit Request to Publish Implementation Guide as a “Standard for Trial Use” |
| 2019 Spring (April–June) | 90-day Publication of Implementation Guide to HL7 Members |
| 2019 July | Release to Public: HL7 2.5.1 Implementation Guide for Syndromic Surveillance for Trial Use Version 1 |
* Milestones last updated January 30, 2019.
** Version 2.0 is currently being used; subsequent versions are working drafts only.
CDC Funding Recipients and Partnership Updates
Funding Opportunities Supporting Syndromic Surveillance
We want to make you aware of two funding opportunities that support syndromic surveillance:
- The National Center for Injury Prevention and Control (NSSP) has released the Overdose Data to Action (CDC-RFA-CE19-1904D), which is due May 2, 2019. This request for application builds upon the Enhanced State Opioid Overdose Surveillance (ESOOS) program. Contact your ESOOS coordinator for additional information.
- The Epidemiology and Laboratory Capacity (ELC) competitive funding announcement is anticipated to be released in March 2019. Activities previously funded under NSSP will now be included under project C, Health Information Systems Capacity (HIS). Contact the ELC HIS lead for additional information.
CDC Web Resources:
Enhanced State Opioid Overdose Surveillance (ESOOS), Opioid Overdose: State Information
Practice
Data Quality Corner
Data—the foundation for making sound public health decisions—must be managed from collection through analysis and reporting. NSSP can work with sites to assess and improve data quality. Each month, NSSP provides site-specific reports on three essential and integrated measures of data quality: completeness, timeliness, and validity. Reports can be accessed in each site’s secure shared folder and are available toward the end of the month. The Data Quality Corner can help you use these reports to bolster and maintain the integrity of your site’s data quality.
NSSP Posts BioSense Platform Enhancements
The NSSP team—with considerable guidance from the NSSP CoP Technical Committee—recently developed and posted the BioSense Platform Enhancements document. The Enhancements Document provides a historic record of enhancements being made to the Access & Management Center (AMC), data flow, and ESSENCE. Platform users will be able to view each enhancement’s review status, priority, description, and implementation stage. This document will be updated monthly and can be accessed in the NSSP Resource Center, BioSense Platform Enhancements tab.
We thank the NSSP CoP Technical Committee for prioritizing and clarifying enhancements that will benefit the syndromic surveillance community.
NSSP Adds Quarterly Metrics to Site Folders
NSSP has added a quarterly summary of data quality metrics to each site administrator’s Reports/Production folder. This summary includes high-level visualization of the site’s data quality (processing metrics, completeness of key fields) and identifies concerns that might warrant further investigation. The schedule was sent to site administrators in December 2018. Please contact your site inspector if you have questions or need help troubleshooting data quality concerns.
NSSP Updates Data Dictionary and Companion “Journeys” Guide
Last month, NSSP posted the NSSP Data Dictionary (Version 33) that describes each data element stored in NSSP data tables. Recent updates include:
Removal of the Data Flow Enhancements Tab (enhancements are now part of the new BioSense Platform Enhancements Document)
- Processing updates related to the BioSense Platform Archive Processed Table and ESSENCE (see Table of Contents Tab, Version Notes)
The companion guidance document, Data Dictionary: Data Elements Used in NSSP Data Processing Journey, has also been updated to reflect these changes. To access these and other useful materials, visit the NSSP Resource Center.
Questions and Tips
Q: How can I use an application programming interface (API) to analyze data in ESSENCE and run reports?
A: Let’s start by defining an application programming interface, or API. An API is a structured and consistent way for one machine (or application) to exchange information with another machine or application. All of us are used to interacting with data through a user interface. These interfaces are intuitive and answer most questions you typically ask without the need for additional programming. But, the downside is that you’re limited by the questions you can ask, limited by visualizations you can make, and limited by report formatting. Customized APIs, on the other hand, let you access and manipulate data from outside an application’s user interface, which, in this explanation, is ESSENCE, and set up new automated ways of exchanging data.
Currently, ESSENCE offers six APIs: time series data table, time series PNG image, table builder results, data details (line level), alert list detection table, and summary stats on unique facilities or regions in query results. These APIs will meet most of your needs. (You can get more information about each by accessing ESSENCE and looking under “More,” clicking “User Guide,” and then clicking “API Documentation.”)
ESSENCE users can compose their own API query in the form of a URL or have ESSENCE generate the URL. BioSense Platform-hosted programs such as SAS or RStudio (including add-on packages R Markdown and Shiny) or other preferred analytic programs can be used to do exploratory analyses and develop customized reports from ESSENCE data. In fact, NSSP programmers even use APIs to prototype functionality (create wish lists) for ESSENCE.
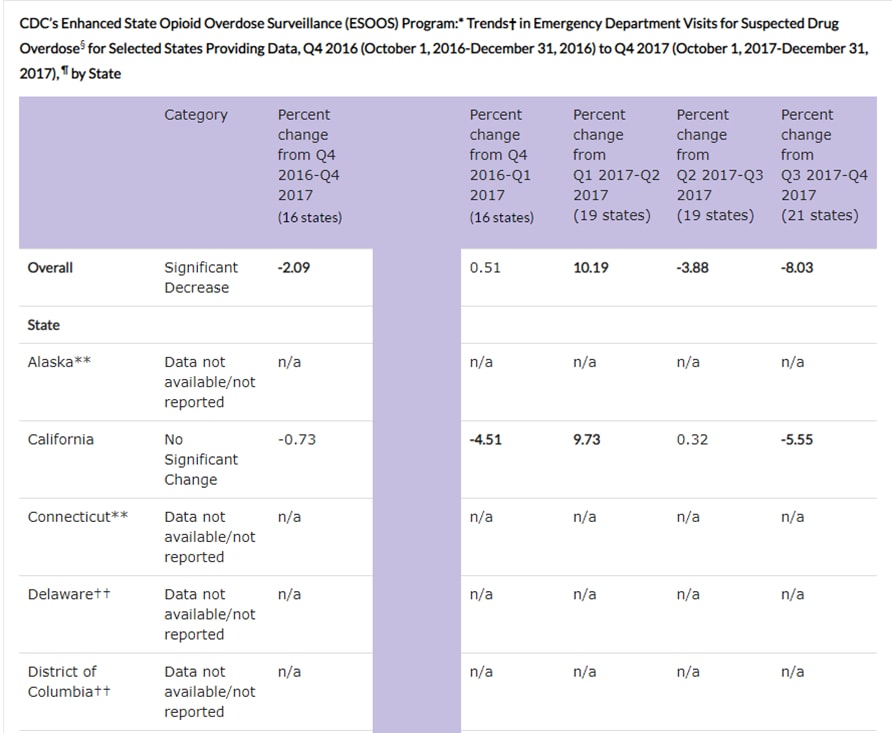
ESSENCE data can automatically generate reports. The report shown here was published by CDC in January 2019. To see current data and other visualizations, visit CDC’s Nonfatal Drug Overdoses website, click the All-Opioids tab, and then click the plus sign beside “About This Map.”
Here’s a practical, real-world example that shows how an API can save time and improve productivity. Each quarter, CDC’s Enhanced State Opioid Overdose Surveillance (ESOOS) Program looks at state trends (only those who have granted them access through ESSENCE) in suspected drug overdoses. An API was created to extract a subset of data for this routine report—eliminating what could have been a manual effort (lots of pointing and clicking). Just think, by using an API, you can extract detailed information from massive quantities of ESSENCE data to generate easy-to-read and focused reports containing charts, tables, and descriptive text—all in a matter of minutes!
Resources
R for Data Science, R Markdown: The Definitive Guide, Text Mining with R
This explanation for optimizing ESSENCE APIs was provided by CDC Health Scientist Aaron Kite-Powell from his presentation at the ISDS 2019 Annual Conference. Kite-Powell’s presentation—How to Use RStudio with ESSENCE Application Programming Interfaces—can be found in the ISDS conference notes. Upcoming newsletters will include more questions and answers about APIs. For more information, see ESSENCE documentation on APIs (login required).
Spotlight on Syndromic Surveillance Practice

The extreme cold in January prompted us to update and re-run a review from our December 2017 issue of NSSP Update. This article encourages epidemiologists to evaluate temperature thresholds that trigger public health alerts.
Characterizing the Effects of Extreme Cold using Real-time Syndromic Surveillance, Ontario, Canada, 2010–20161
The authors begin by stating that “chaotic weather patterns” associated with climate change can produce not only extreme heat but extreme cold.2 Citing Gasparrini et al,3 the authors write “cold was responsible for a substantially higher proportion of deaths than heat.” This makes a compelling case for understanding the relationship between exposure to cold and adverse health effects, including death.
The relationship between temperature and health is influenced by a confluence of factors (e.g., a person’s age, duration of exposure, amount of precipitation). Thus, the authors looked at weather conditions and visits to emergency departments—all in real time—to understand the relationship and get a better idea about when to issue health alerts and do emergency planning.
Hospital emergency department data were collected by the Acute Care Enhanced Surveillance (ACES) system that is used in Ontario. (ACES includes data on people with different socioeconomic backgrounds and insurance types due to Canada’s universal healthcare system.) The authors detailed their comparison of C1, C2, and C3 algorithms of increasing sensitivity to detect aberrant ED visit counts and generate alerts. Then they launched into a comprehensive analysis of the alerts being generated and present their results.
The bottom line is the importance of choosing an alerting algorithm that minimizes false alerts. This paper describes a thorough process for doing just that and demonstrates how better alerts can improve public health warnings associated with cold weather.
1VanStone N, van Dijk A. Chisamore T, Mosley B, Hall G, Belanger P, Moore KM. Characterizing the Effects of Extreme Cold Using Real-time Syndromic Surveillance, Ontario, Canada, 2010–1016. Public Health Reports [Internet]. 2017 July/August [cited 2017 Oct 30];132(1 Suppl):48S–52S. Available from: http://journals.sagepub.com/doi/full/10.1177/0033354917708354#articleCitationDownloadContainer
2Cohen J, Screen JA, Furtado JC, Barlow M, Whittleston D, Coumou D, Francis J, Dethloff K, Entekhabi D, Overland J, Jones J. Recent Arctic Amplification and Extreme Mid-latitude Weather. Nature Geoscience 2014;7(9):627–37.
3Gasparrini A, Guo Y, Hashizume M, Lavigne E, Zanobetti A, Schwartz J, Tobias A, Tong S, Rocklöv J, Forsberg B, Leone M, De Sario M, Bell ML, Guo YL, Wu C, Kan H, Yi SM, Coelho MS, Saldiva P, Honda Y, Kim H, Armstrong B. Mortality Risk Attributable to High and Low Ambient Temperature: A Multicountry Observational Study. Lancet 2015;386(9991):369–75.
Program
Technical Updates
NSSP Introduces “Batch Add”
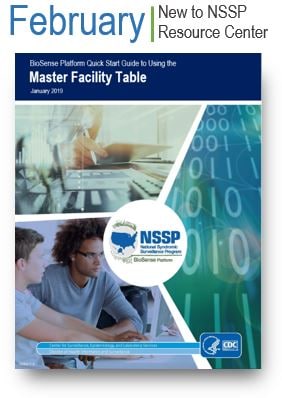
This update to the BioSense Platform Quick Start Guide to Using the Master Facility Table describes how to add multiple primary facilities with Batch Add. This time-saving feature coupled with new designators that track the review status of facilities will help site administrators improve data transmission and quality.
On January 31, 2019, we released an enhancement to the Access and Management Center (AMC) Master Facility Table that lets site administrators upload multiple primary facilities at the same time. This enhancement streamlines the uploading of new facility metadata.
The NSSP Team is working with a small group of volunteers to define additional enhancements to the facility management process.
Active Facility Audit Underway
An operational review of the Master Facility Table shows some production facilities are not sending data to the BioSense Platform despite being set to “Active.” We want to help site administrators determine whether these facilities need support to send data or should be deactivated. In January, we began sharing baseline reports of facilities that have not submitted visit data within 90 days. A new policy to deactivate facilities that fail to send data for 90 or more days begins March 2019.
AMC Update Rescheduled for April
Supports Federal Data Security Requirements
The next AMC update has been rescheduled for mid-April. This update is a response to recent federal data security requirements. BioSense Platform users who are contractors or foreign nationals (neither a citizen nor permanent U.S. resident) must be identified as such on their user profiles. Site administrators will be required to update their users’ accounts for these two status indicators.
BioSense Platform AMC passwords will also be affected. Users will be required to follow new federal guidelines such as ensuring passwords are 12 characters long, making sure passwords are not reused for 24 cycles, and setting up new passwords where 75 percent of the characters used are different from those in the previous password.
The NSSP team is examining if further changes will be needed. Stay tuned for details.
Assessment of 2018 Hurricane Season Response
Last month, team members from NSSP and the Assistant Secretary for Preparedness and Response (ASPR) met to discuss previous efforts, needed improvements, and potential collaborations in 2019. They also discussed organizational changes within ASPR that were made after the two groups collaborated during the 2018 hurricane season.
ASPR leads our nation’s public health and medical response to disasters and public health emergencies. For example, in 2018 after Hurricane Michael struck the Florida Panhandle, ASPR deployed Disaster Medical Assistance Teams (DMATs) to provide medical services to people displaced by flooding and storm damage. The ASPR DMAT data source provided insight into the event and response—in near real time. Data were made available to CDC’s Emergency Operations Center and to public health partners affected.
This type of after-action meeting helps ASPR and NSSP improve processes and keeps data needs at the forefront of response discussions. For example, the teams discussed IT support, exportation of batch versus new or updated records, message structure and quality, staff training, requirements for general response support, and opportunities to test code and response processes. Both organizations have benefitted from working with state public health departments during natural disasters and see the need to prepare for other large events (e.g., state funerals, state of the union) that will affect multiple states and public health jurisdictions.
More Tech Updates
- Dashboards and Facility Management: The NSSP team is working with the syndromic surveillance community to define requirements for dashboards and operational reports for managing facilities. These dashboards and reports will help site personnel monitor data processing and system backlogs. This is part of a larger NSSP-wide effort to improve data quality.
- Service Desk Gets Facelift: The NSSP Service Desk is sporting a new look, but the functionality remains the same.
Current Month and Upcoming Events
| February 6 | Data Validation Conference Call, 3:00–4:00 PM ET |
| February 19 | NSSP CoP Call; 3:00–4:30 PM ET; Topic: Cardiovascular Disease Surveillance; register here |
| February 19 | Scheduled vendor patches in staging environment: 6:00–10:00 AM ET |
| February 21 | Scheduled vendor patches in production environment: 6:00–10:00 AM ET |
Last Month’s Technical Assistance
| January 2 | Held Data Validation Conference Call |
| January 22 | Applied vendor patches in staging environment |
| January 24 | Applied vendor patches in production environment |
| January 31 | Deployed update to Access & Management Center |
NSSP Participation
A total of 57 sites from 47 states, including the District of Columbia, participate in NSSP. Currently, there are 4,141 facilities, including 2,766 emergency departments (ED), actively contributing data to the NSSP BioSense Platform. Data from these EDs cover about 65% of all ED visits in the country.
NSSP publishes data for ED visit coverage each quarter. These data and the coverage map shown below were updated January 2019.
Definitions: NSSP consolidates facilities that provide data under a single data administrative authority called a site administrator. These facilities and single-site administrator constitute a site.
The community and NSSP team have put considerable effort into streamlining new-site onboarding and improving data collection, management, and reporting. Consequently, NSSP now has timely, high-quality data that can be used to estimate ED visit coverage.
If you missed the article that describes the new calculation method, check out the December 2018 issue of NSSP Update.
