Technical Frequently Asked Questions (FAQs)
The Data Flow tab provides both an at-a-glance and a detailed view of Processed, Exceptions, and Filtered records.
By default, the DQ Dashboard shows all your site’s data—every feed, every facility. The view you’ll see in the bar chart will look something like this:
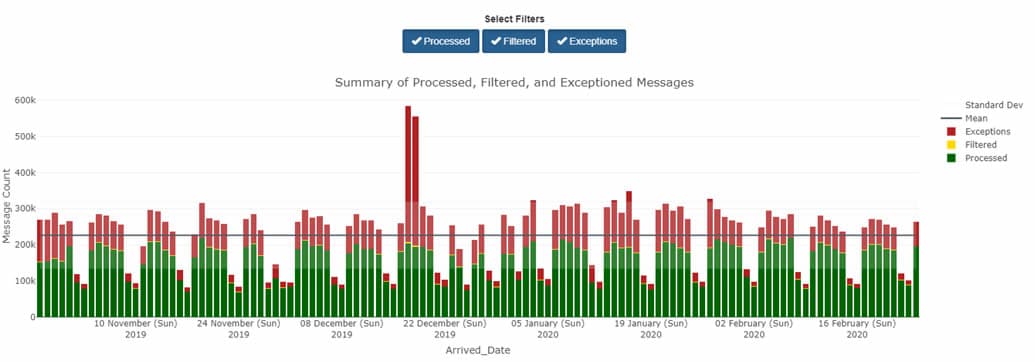
By using other tabs, however, you can see different views that apply different metrics—and each serves a different purpose.
For example, you can use the DQ Dashboard’s Data Flow tab to identify ESSENCE backlogs and other processing issues. To do this, select the Data Flow tab and click the Visit Count Comparison graph. This option lets you see a bar chart with the Count of your site’s Processed Messages by arrived_date as well as your site’s Processed and ESSENCE visit counts by c_visit_date. The y-axis shows the message count, and the x-axis shows the arrived_date. You can drill down even more by selecting any one metric (e.g., Processed Visits versus Processed Messages) to get a better sense of comparison.
If you notice a backlog or see only the sent messages from an earlier Visit Date, you should see a jump in the Processed Message count without a corresponding increase in the ESSENCE and Processed Visit trendlines. Here is an example:
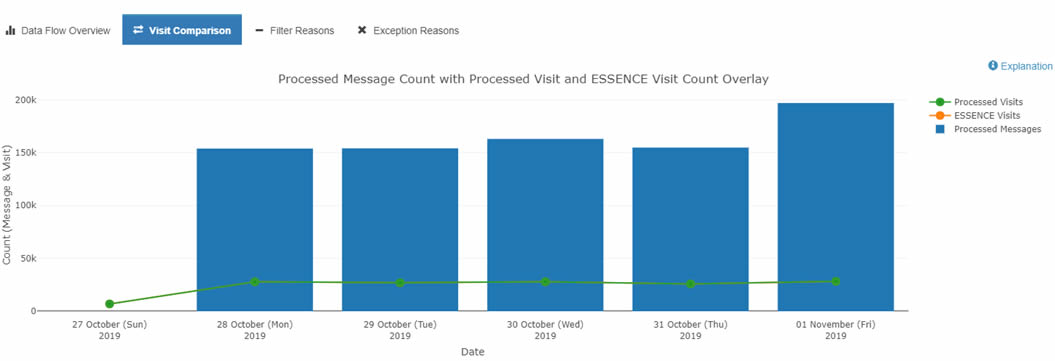
Detailed information about these graphs can be found in the BioSense Platform User Manual for the Data Quality Dashboard. Contact your site inspectors for more information by emailing NSSP@cdc.gov.
Posted in NSSP Update, March 2020.
To get Processed, Exceptions, or Filtered records for the site, you need to make a few changes. The default selection for Feed is All Feeds. To see Filtered or Exceptions by facility, start by clicking Deselect All feeds.
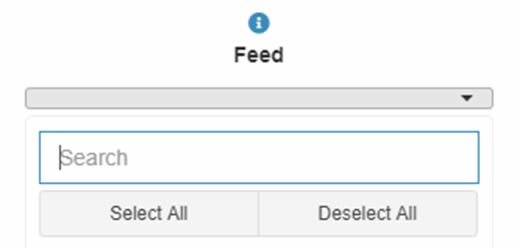
Once done, select the facility of interest. Change the Date Range to match dates of interest. Give the dashboard a few minutes to realign and display facility-level metrics.
Now you will see data flow metrics for the facility of interest. Here is an example:

Posted in NSSP Update, March 2020.
The “Daily Summary” is an automated email sent to site administers and their designees each morning. The Daily Summary provides a snapshot of processing metrics and issues and is designed to help site administrators identify potential data processing issues quickly. These emails contain collated details on the data’s journey through various processing steps. In addition, the Monday email displays changes in weekly facility status and anomalies associated with visit and message volume.
The Daily Summary has two parts: (1) Site Overview, which contains six sections that delve into how a site’s data are processed, and (2) Feed and Facility Alerts. At the top of the Daily Summary there are convenient links to lead you to each section. The Daily Summary is organized as follows:
- Site Overview
- Daily Processing Summary
- Daily Filtered Records
- Daily Exceptions Records
- Daily Production Data Flow Backlog Metrics
- Weekly Summary of New Active Facilities*
- Weekly Summary of Facilities Pending Activation*
- Feed and Facility Alerts
- Daily Facility Alerts
- Weekly Feed and Facility Visit Volume Anomalies*
- Weekly Site Record Volume Anomalies*
*Appears in Monday emails only.
TIP—Refer to the Daily Summary Often. (Yes, each day!) A quick scan of the email will show the status of your site’s data. For in-depth guidance, NSSP is developing a Quick Start Guide that will be posted in the Resource Center. The Guide will describe each section and how data are calculated. If you have questions, suggestions for improving the Daily Summary, or concerns about data processing, please submit a Service Desk ticket to support.syndromicsurveillance.org.external icon
The “Quarterly Summary” provides a high-level assessment of production data accompanied by a qualitative review of the findings. For example, the Quarterly Summary shows data timeliness, completeness, and validity for the previous quarter. This will help you identify key Priority 1 data elements that could require your immediate attention. The qualitative findings will provide insight on why certain data elements may be incomplete or invalid. For example, you will be provided with the number of facilities sending valid Facility_Type _Code metrics, which, in turn, contributes to calculated C_Fac_Type_Patient_Class validity. The Quarterly Summary complements the Daily Site Processing Summary and Monthly Data Quality reports by providing a bottom line on data quality for the previous quarter. Here’s what the Quarterly Summary will contain:
- Processing Overview—High-level metrics that show the volume of messages and visits and distribution of those processed successfully.
- Timeliness—Summary of time taken for site messages to arrive on the BioSense Platform.
- Completeness—Visit-level percentages of Priority 1 data elements that were accurately received in the incoming message on the BioSense Platform and are available for downstream processing.
- Validity—Information about adherence of facility type, patient class, and chief complaint to current PHIN Guide Standards.
- Personally Identifiable information (PII)—Indicates known PII issues with data (in accord with NSSP’s routine monitoring of PII).
- High-Level Summary of Findings—Qualitative review of data that can be used to identify key issues a site might want to focus on to improve data quality.
Tip—Refer to the Quarterly Site Summary after you’ve looked at other sections of the reports independently. Review the Quarterly Site Summary in tandem with the monthly Data Quality reports for the same quarter. Then reach out to your site inspector and request a walkthrough of the report. Site inspectors will gladly schedule a call with you and provide granular information about the report. They will answer your questions and suggest ways to improve data quality.
Data is the foundation for making sound public health decisions. NSSP distributes reports that flag potential problems early so that corrective actions can be taken immediately. If you have questions about the reports described above—the Daily Site Processing Summary or Quarterly Summary—our NSSP site inspectors are willing to assist. Please contact the NSSP Service Deskexternal icon to ask questions or speak with a site inspector.
Due to licensing limitations, NSSP has a limited number of Posit (RStudio) licenses available. As a site administrator, if you or someone in your site requires access to Posit (RStudio), go into their AMC User Profile and check the box for RStudio to request a seat (license). That will send a request to the AMC admins to review and grant the access if there are seats available. Please note: Licensed user accounts are reviewed every 90 days. Users who have not used their Posit (RStudio) accounts within the past 90 days may be removed and will need to request access to be restored.
Drive space for SAS and RStudio resides on the same file server, so your Home directory (folder) and your site’s shared directory are common storage, and you can see both your SAS and RStudio files there.
Each user may store up to 500 gigabytes of data in any combination using the Home directory (folder) and your site’s shared folder. This includes both SAS datasets and RStudio data. For example, if you had a SAS dataset with 100 GB and an RStudio extract of 50 GB stored in your Home folder and several data extracts for RStudio analysis amounting to 250 GB stored in your site’s shared folder, you would have 100 GB of free storage left.
In other words, all your saved files are counted whether they are saved in your Home folder or your site’s share folder.
If you exceed your 500 GB maximum, you will receive a warning message and have 7 days to reduce your total storage below 500 GB. During this grace period, you will continue to receive warning messages but will not be prevented from creating or extending files because each user has a 100 GB temporary buffer. You may use up to 600 GB if work in progress requires more data or workspace than expected. However, 600 GB is a hard limit and, if exceeded, further attempts to write to the disk will fail with an error message, even if the grace period has not yet expired.
If a user exceeding the 500 GB limit allows the 7-day grace period to expire without reducing storage to 500 GB or less, the user will not be permitted to create new files or extend existing files until space usage is adequately reduced.
Effectively, your site’s shared folder has no size limitation. If each user on your team contributes files to the shared site folder and each remains under their individual drive space allocation, this folder can be added to as needed.
For example, suppose you and two other team members are working on a project in the same shared site folder, and everyone has less than a total of 100 GB of data stored in their individual Home folders and the shared site folder. If each of you saves 300 GB of data to your shared site folder, then you each will have allocated space usage of 400 GB (which is under your individual limits), but your shared site folder would have stored 900 GB of data. This is not a quota violation.
If you require more than 500 GB of storage on a continuing basis, special provisions can be made. We will need to know why the additional space is needed (for example, “I manage a 750-gigabyte data file that is shared with a dozen different sites”) and how much space is necessary (“I need 1.5 terabytes so I can store both the new and old copy of the file while it is being re-created, but my ongoing usage will be 750 gigabytes”).
Please send any request such as this to the NSSP Service Desk at support.syndromicsurveillance.org, and be sure to include your business case for this need.
In ESSENCE, ZIP Codes are used for Patient Location (Region). ESSENCE “Regions” are aggregations of data from the ZIP Codes with centroids within the county or territory border.
The Patient_Zip starts as a direct input from the HL7 message. The first 5 digits of the Patient_Zip are sent to the ZipCode field.
When invalid, blank, or null values are sent, the Patient Region is categorized as OTHER_REGION. This category is selectable by going to the ESSENCE Query Portal, under the Patient Region, and then selecting the Patient Location (Full Details) data source. Any patient with an invalid ZIP Code is grouped under OTHER_REGION by Patient HHS Region and by Patient State, and is grouped as OTHER under the Patient Zipcode List.
A patient with an invalid ZIP Code will NOT be grouped under strata for Patient Core-based Statistical Area, Metropolitan Statistical Area, or Patient County Federal Information Processing Standards (FIPS) approximation. If you attempt to stratify or query by these strata, the results will exclude visits and show blank, null, and invalid ZIP Codes.
An application programming interface, or API, helps machines or applications exchange information in a manner that is structured and consistent. For these reasons, APIs are ideal for generating reports published at regular intervals from the same data source (ESSENCE). Examples include daily situational reports and weekly or monthly bulletins. Plus, you can pull data from ESSENCE in various formats (aggregated tables, counts, proportions across various stratifications, etc.) and tailor findings to different formats of your choosing to suit your audiences. For example, you can use APIs to share trends by syndrome with other analysts, create reports for public health officials that compare weekly visits for opioid overdose trends, more efficiently combine information from ESSENCE and other data sources in one report, or create infographics for nontechnical audiences (38% of hospitals in region X show X).
Public health surveillance is all about gathering and sharing data so that informed decisions can be made. Epidemiologists work hard to make sense of messy syndromic data and present it in ways that are meaningful and actionable. Once you’ve honed the approach you want to use in a report, use the API to update the data used in your charts and tables. You’ll experience a boost in productivity (and accuracy) once you programmatically incorporate the API into your analysis.
Resources
R for Data Scienceexternal iconexternal icon, R Markdown: The Definitive Guideexternal iconexternal icon, Text Mining with Rexternal iconexternal icon
This explanation was provided by CDC Health Scientist Aaron Kite-Powell from his presentation at the ISDS 2019 Annual Conference: How to Use RStudio with ESSENCE Application Programming Interfaces. Upcoming newsletters will include more info about APIs. Also see ESSENCE documentation on APIsexternal iconexternal icon (login required ).
No, patient identifiers are not included in the Lab A data transmitted to NSSP, nor are there currently plans to create or gain patient identifiers. Patient identifying information like names and addresses are also not included in these data.
Yes, Lab A provides specimen (accession) identifiers to NSSP for the agreed-upon list of health conditions. If a patient received testing for multiple health conditions at the same time, such as influenza and COVID-19, those results will be linked. However, if a patient received additional testing not included in the health conditions list, such as a CBC panel or cholesterol screening, Lab A would NOT send the results of that additional testing to NSSP.
All access to Lab A data requires active, documented collaboration with an NSSP–ESSENCE or CDC user. For approval guidelines, please email NSSP@cdc.gov.
To request Lab A access, contact NSSP@cdc.gov. CDC staff need supervisor approval and must submit an official data access request. Each CDC user will need to submit an individual data access request. It’s always a good idea to discuss new projects with NSSP staff before submitting the request.
NSSP–ESSENCE users can be granted access to the Laboratory A data by their site administrator. Site administrators can update rules for laboratory data access inside of the Access & Management Center (AMC) in the same way access rules are created for emergency department data. Please contact NSSP@cdc.gov with questions.
Twice daily, except on Sundays, data are updated and sent electronically via HL7 messaging. Sunday data are backfilled with the first Monday update. Tests are included in the file at the time Lab A receives a specimen; therefore, NSSP sometimes receives initial data about a test before the result is ready. When the result is ready, it is included in the next data transmission as an update.
The lag between the initial data and obtaining the result depends on the condition. Some tests take longer than others to finish. However, the time between the result being complete and NSSP receiving the result is generally <1 day (Monday–Saturday).
Lab Data Flow

If a patient sees a medical provider and gets tested for both influenza and COVID-19 at the same visit, those results will be linked via the specimen identifier. However, if that patient returns for additional testing, say to see if the infection has cleared, those results will NOT be linked to previous results.
Since early 2019, CDC’s National Syndromic Surveillance Program (NSSP) has had an agreement with a large, national commercial laboratory (“Lab A,” per the agreement) to receive electronic laboratory testing orders and results for select health conditions. Data fields are described in the Laboratory User Tables, Lab by Result Data Dictionary tab. The Laboratory User Tables can be found in the NSSP Technical Resource Center under Data Dictionaries.
Health conditions sent by Lab A are listed in the Laboratory User Tables, Lab Test Standard tab. The Laboratory User Tables can be found in the NSSP Technical Resource Center under Data Dictionaries.
NSSP Laboratory A Included Conditions, June 2023
NSSP receives basic information on patient demographics (sex, state, age in years, and race and ethnicity), the provider (state, provider type [primary care, OBGYN, hospital, etc.]), and the laboratory facility (state). Information about the commonly used fields in the NSSP data are described in the Laboratory User Tables (see the NSSP Technical Resource Center under Data Dictionaries).
NSSP receives all possible laboratory results. This includes negative, positive, detected, not detected, flora growth, and quantitative results. For ease of querying, NSSP created categories for each of these results. To learn more about result categories, see the Laboratory User Tables, Lab Result Standard tab. The Laboratory User Tables can be found in the NSSP Technical Resource Center under Data Dictionaries.
An MFT contains all information (metadata) needed by the BioSense Platform to process data from a facility. Each MFT is site-specific. The MFT fields make sure data map correctly from facility to BioSense Platform and that data are easily identifiable when queried.
All site administrators can access their site’s Master Facility Table (MFT). To grant access to others, site admins may update the user’s Privilege Level in the AMC User Profile. There are two MFT user roles:
- MFT View-Only User who can access the MFT for that site and view entries but NOT make changes or
- MFT Edit User who can view and edit that site’s MFT.
NSSP’s onboarding team can also access MFTs to confirm requested updates and verify data entered by site admins and MFT Edit Users. Because the MFT user interface is the site’s key to processing facility data, MFT access is restricted to just those users who may need to update, add, or review facility information.
Everyone wants the onboarding process to progress smoothly and be error free. By updating the Master Facility Table (MFT) regularly and keeping it current, you decrease the likelihood for discrepancies once the facility begins transmitting data to NSSP. Any discrepancies between what the site administrator enters into the MFT versus what the facility sends could raise issues. For example, if the site administrator entered a FacilityID_UUID into the MFT different from that submitted in the data, the mismatched identifiers will prevent incoming data from mapping accurately to the facility listed in the MFT. Worse yet, data will not process and will continuously route to the exceptions table until the issue is resolved. (Tip: This is a good reason to check Data Quality reports in WinSCP for staging exceptions data or the Data Quality Dashboard and SAS Data Quality [DQ] On Demand for production exceptions data.)
Posted in NSSP Update, April 2020.
There is no cost to the site to send or access mortality data in the BioSense Platform.
No. If your site submits mortality data to State and Territorial Exchange of Vital Events (STEVE), an application programming interface (API) can transport data automatically, securely, and electronically to the NSSP mailbox.
- For additional transport questions, please contact the NSSP mailbox: nssp@cdc.gov.
- For technical assistance with STEVE, please contact the National Association for Public Health Statistics and Information Systems (NAPHSIS): systems@naphsis.org.
Site (jurisdictional) data user view
- The Access & Management Center (AMC) lets public health jurisdictions control data being shared, identify users with access, and specify timeframe for sharing data. The AMC enables site-based data governance—data access is managed by the jurisdiction rather than CDC.
- For more information about the AMC, see the BioSense Platform User Manual for the Access & Management Center.
Federal data user view
Access rules for mortality data will follow the same data use policies used for emergency department data.
- CDC’s Division of Health Informatics and Surveillance (DHIS) and the CDC contractors supporting the BioSense Platform have access to each jurisdiction’s data for routine operational and data quality support.
- In the future, CDC staff outside of DHIS will be able to apply to the CDC NSSP program lead to access data at the national and U.S. Department of Health and Human Services (HHS) Regional levels, as they do for emergency department data. However, data access at the HHS Regional level will be contingent upon additional jurisdictions joining NSSP. Currently, several sites are still in the onboarding process and, as a result, HHS Regions are incomplete.
Executing a DUA is at the discretion of the site. NSSP does not require a DUA but can provide one.
General use
- Incorporating mortality data into NSSP–ESSENCE will allow integration with illness, injury, and other health-related data. This will give health officials an additional resource to support more timely, robust analysis and response to public health threats and events of concern.
- CDC will develop products focused on national- and regional-level analysis.
Public Health Emergency
- In a public health emergency (PHE), CDC may access and use data received by the NSSP BioSense Platform, including a site’s mortality data, to carry out public health functions necessary for the response and may present the data through secure CDC and U.S. Department of Health and Human Services (HHS) platforms.
Vital statistics data may have different data–sharing rules and regulations across jurisdictions. Site administrators can speak to their Office of Vital Statistics for more information. Additional assistance for connecting across communities is available by contacting the National Association for Public Health Statistics and Information Systems (NAPHSIS) (systems@naphsis.org) or Council of State and Territorial Epidemiologists (CSTE) (syndromic@cste.org).
NSSP’s onboarding procedures have been developed and streamlined to minimize the level of effort needed by a site. See the NSSP Onboarding Data Workflow diagram for mortality data below:
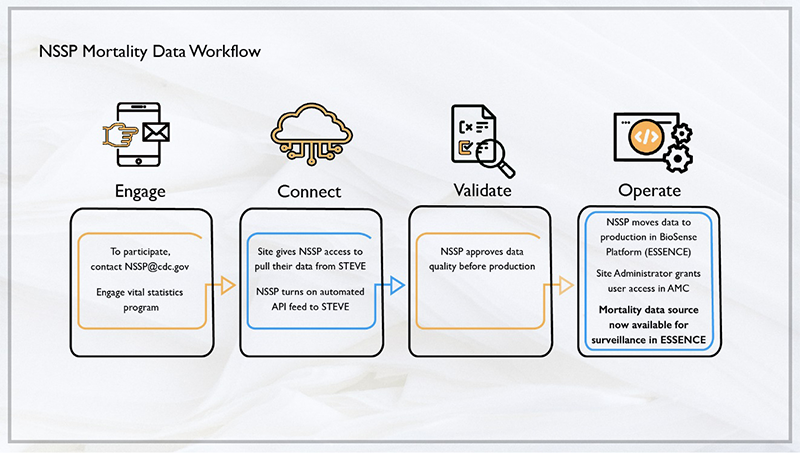
The timeline will vary depending on site readiness, data feed connection, and issues identified during onboarding.
Once a site establishes a data flow to the onboarding environment, the site administrator may request a review of the data by submitting a ticket to the NSSP Service Desk:
- If no data quality issues are identified, the site will usually be approved within 1 to 2 business days.
- If data quality issues are identified or site prioritization is a concern, approval for production can take about 2 weeks. On average, 2 weeks are needed for the NSSP onboarding team to communicate issues to the site administrator and for the site administrator either to resolve or respond to each problem.
Site administrators are primarily responsible for ensuring the mortality data meet and maintain the NSSP production data quality metrics for their site. A best practice is a shared, collaborative responsibility between the site administrator and mortality data liaison.
Mortality data have e-VITAL standards for information entered on the death certificate, including electronic death certificates, so they are expected to have moderately high data quality.
There is no requirement that the mortality data meet the HL7 FHIR standards to be onboarded at this time.
The NSSP onboarding team has the capacity to work with your site to add mortality data today.
See onboarding guides for technical FAQs, or email nssp@cdc.gov for answers to additional questions. Also see the FAQs for the Master Facility Table.
A new site onboarding window typically lasts 10 to 12 weeks depending on how many sites participate. Length of site preparation before each new site onboarding window will vary.
The speed of onboarding varies depending on facility readiness and issues identified during onboarding. For New-facility Onboarding, once a facility has established data flow to the staging environment, the site administrator may request a review of the data by submitting a ticket to the NSSP Service Desk or by changing the facility’s MFT status to Active. If no data quality issues are identified, a facility can be approved within 1 to 2 business days. If data quality issues are identified or NSSP has other priorities, approval for production can take longer. See the Onboarding Guide or New Facility “STEPS TO VALIDATE” Job Aid for details on when to request a facility for production review.
The timeline will vary depending on facility and vendor readiness, facility connection to the data feed, and identification of issues throughout onboarding.
Once a new facility establishes a data flow to the onboarding environment, the site administrator may request a review of the data by submitting a ticket to the NSSP Service Desk or by changing the Facility Status on the Master Facility Table (MFT) to Active:
- If no data quality issues are identified, the facility will usually be approved within 1 to 2 business days.
- If data quality issues are identified or facility prioritization is a concern, approval for production can take about 2 weeks. On average, 2 weeks are needed for the NSSP onboarding team to communicate the issue to the site administrator and for the site administrator either to resolve or respond to each problem.
Posted in NSSP Update, April 2020.
For facilities that use unique identifiers (IDs) for the same building, how you enter this information determines how NSSP–ESSENCE will view these data. A batch template can contain only one facility ID, but additional associated IDs may be added manually:
- To create multiple facilities, enter separate lines for each identifier during the batch upload.
- To create (and view as) a single facility, enter one identifier during the batch upload. Later, add additional identifiers either as an associated facility or as an additional Both methods will map messages from unique identifiers to the main facility.
An ideally formed HL7 message will have the main facility ID in the MSH-4.2 and the individual departments in the EVN-7.2.
Posted in NSSP Update, July 2020.
Yes, these can be the same number if that is what the site chooses to use as its FacilityID_UUID.
Posted in NSSP Update, July 2020.
NSSP’s approach to validating data quality provides two levels of minimum data quality requirements:
- Priority 1 Data Elements—Minimum Required Data Elements to onboard to NSSP BioSense Platform (compliance with PHIN Messaging Guide for Syndromic Surveillance); and
- Priority 2 Data Elements—Minimum Required Data Elements to comply with the Office of the National Coordinator for Health Information Technology (ONC) certification. ONC supports adoption of health information technology and promotes nationwide health information exchange to improve healthcare. See HealthIT.gov at https://www.healthit.gov/topic/about-onc.
NSSP encourages sites and facilities to achieve 100% compliance with data completeness, timeliness, and validation. Sometimes, however, considerable effort is needed to develop production-ready HL7 messages that fully comply with the messaging guide. Changes to messages can require considerable time and planning to implement correctly. Some nice-to-have changes might not be identified until late in the onboarding process, becoming prime candidates for integration into vendor software upgrades. Issues can also result from outdated documentation, vendor mergers, and user errors. Given these potential obstacles, having two levels of minimum data quality requirements is a practical solution.
Posted in NSSP Update, April 2020.
The guides and job aids are designed to help site administrators onboard new facilities to the BioSense Platform and set up initial feeds in a manner consistent with NSSP guidelines. Facility managers, administrators, technical staff, vendors, health information exchanges, and individual hospitals or medical facilities that transmit syndromic data will also find the information useful. (For onboarding information specific to your local public health jurisdiction, please work directly with your site administrator.)
Posted in NSSP Update, April 2020.
Please avoid—or limit—sending personally identifiable information (PII) to the BioSense Platform. NSSP can scrub PII from specific fields listed in the New Facility Onboarding Guide for the BioSense Platform. PII sent in other fields (those not listed) cannot be scrubbed and should not be sent. NSSP issues weekly PII reports to alert sites of problems and works with site administrators to identify solutions.
Posted in NSSP Update, April 2020.
The facilities in the DQ Dashboard are updated once a week. If more than a week has passed and you don’t see the facility but are certain data have been received, please submit an NSSP Service Desk ticket.
The onboarding team recently asked that site administrators check their MFT for facilities with a Review Status of “Pending Site Review.” The reason for this review is that a site administrator or MFT Edit User might have requested that the facility status be updated to Active and, following a review, the NSSP onboarding team declined the activation request.
The only way to clear this status is for a site administrator or MFT Edit User to click Cancel Requested Changes to revert the facility entry to its previous status before the activation request was made. If you’re a site administrator or MFT Edit User, please review your site’s MFT Review Status column for facilities with a Review Status of “Pending Site Review,” and then click Cancel Requested Changes.
