Key points
- Data on suspected and confirmed norovirus outbreaks reported to CDC by participating state health departments are updated monthly.
- NoroSTAT combines a subset of NORS and CaliciNet data.
- NoroSTAT data are used to assess current and past norovirus activity and impact of future norovirus genotypes
About the current norovirus season
- During August 1, 2025–June 11, 2026, there were 1,287 norovirus outbreaks reported by NoroSTAT-participating states. During the same period last seasonal year, there were 2,596 norovirus outbreaks reported by these states.
- The total number of outbreaks reported during the 2025-2026 seasonal year is within the middle 50% of outbreaks (interquartile range) reported in the same period during the 2012–2025 seasonal years.
Graph
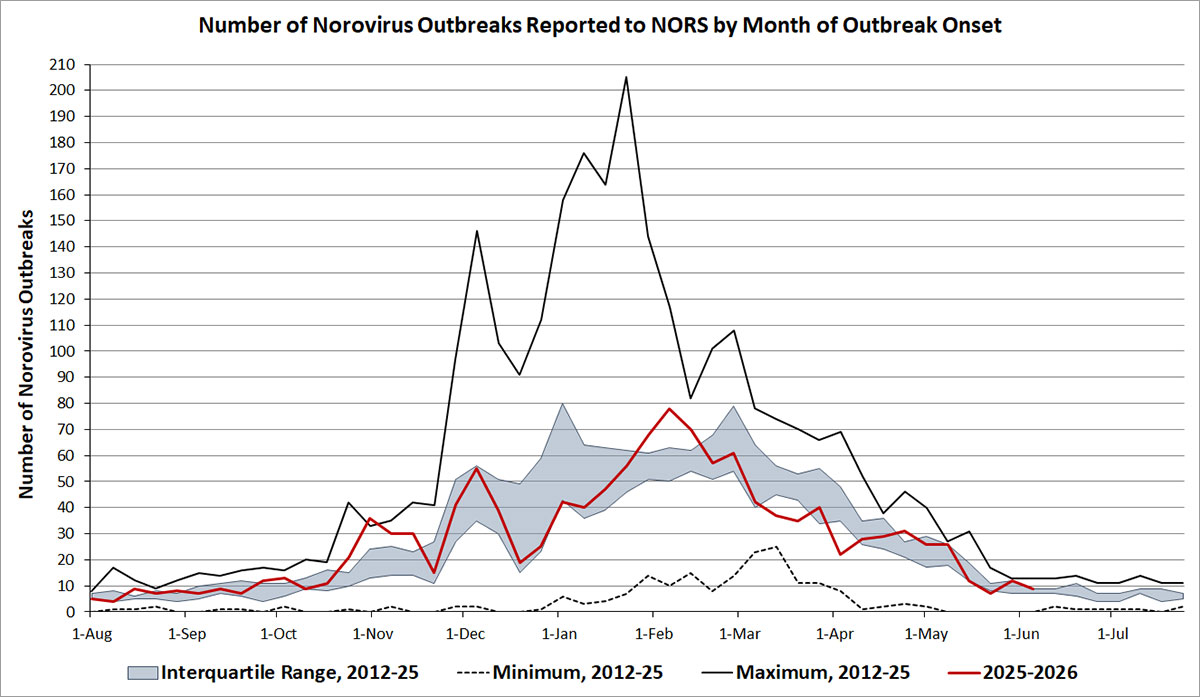
Number of Suspected or Confirmed Norovirus Outbreaks Reported by NoroSTAT-Participating States Per Week, 2012–2026
Keep Reading
NoroSTAT Data Table
What this graph shows:
The total number of suspected and confirmed norovirus outbreaks reported each week to CDC by the state health departments in Colorado, Massachusetts, Michigan, Minnesota, Nebraska, New Hampshire, New Mexico, North Carolina, Ohio, Oregon, South Carolina, Tennessee, Virginia, and Wisconsin through the National Outbreak Reporting System (NORS) by week of illness onset, 2012–2026.
- Dotted line (minimum): The lowest number of weekly norovirus outbreaks reported for the 2012–2013 through 2024–2025 seasonal years (August through July).
- Solid black line (maximum): The highest number of weekly norovirus outbreaks reported for the 2012–2013 through 2024–2025 seasonal years.
- Blue area (interquartile range): The range of the middle 50% of weekly norovirus outbreaks reported for the 2012–2013 through 2024–2025 seasonal years.
- Solid red line: Latest data for the current seasonal year (2025–2026). State health departments participating in NoroSTAT have 7 business days to report norovirus outbreaks to CDC.
Graph trends
A seasonal year's line that consistently falls outside of the blue area, especially during the peak of the season (December to March), might indicate unusually high or low norovirus activity.