At a glance
- Industry and occupation data are now publicly available in the National Vital Statistics System (NVSS).
- Data are collected from all 50 states, New York City, and Washington, D.C.
- We offer suggestions to help funeral directors document industry and occupation on death certificates.
- We offer tips and tools to analyze these data.
About this program
NOMS is a collaboration between NIOSH, the National Center for Health Statistics (NCHS), and jurisdictions.
Working together, we assemble and code industry and occupation as part of death certificate data processing. The data then become part of the NVSS.
This surveillance program was developed in the 1980s to monitor changes in cause of death by usual occupation or industry in the United States. The initiative has evolved over time. Including industry and occupation data as part of the NVSS is a step forward for occupational health research.
Having industry and occupation in the NVSS enables researchers to:
- examine changes in cause of death by usual occupation and industry,
- identify new work-related health hazards, and
- guide research and prevention activities.
Do you have questions about NOMS or industry and occupation death certificate data? Email us!
Completing the death certificate
Each jurisdiction has its own electronic death registration system (EDRS) with information collected based on the 2003 US Standard Certificate of Death. Jurisdictions use this information to issue death certificates.
Data for death certificates can be divided into two parts:
- Cause of death is filled out by the medical examiner, coroner, or another type of medical certifier.
- Demographic information is filled out by the funeral director with help from a decedent's informant. It includes narrative fields which describe the decedent's usual industry and occupation.
Analyzing death certificate data
Preparing the data for analysis
- Each jurisdiction collects and transmits the death certificate information to NCHS.
- NCHS pulls industry and occupation narratives and sends them to NIOSH.
- NIOSH then translates text to codes with expert coders and the NIOSH Industry and Occupation Computerized Coding System (NIOCCS).
- Once all industry and occupation information has been assigned a code, NIOSH returns the coded data to NCHS.
- The industry and occupation codes are then sent back to the jurisdictions and added to the NVSS.
Jurisdiction participation
- 47 Vital Statistics Jurisdictions
- Not included: Iowa, Arizona, North Carolina, Rhode Island, and Washington, D.C.
- 50 Vital Statistics Jurisdictions
- Not included: Rhode Island, Washington, D.C.
- 52 Vital Statistics Jurisdictions
- Includes 50 states, New York City, and Washington, D.C
Resources and publications
Suggested citation
NIOSH (2024). National Occupational Mortality Surveillance (NOMS). U.S. Department of Health and Human Services, Public Health Service, Centers for Disease Control and Prevention, National Institute for Occupational Safety and Health, Division of Field Studies and Engineering, Health Informatics Branch. Date accessed._mm/dd/yyyy.
Frequently asked questions
Who codes the cause of death information on the death certificate? What classification system is used?
The medical certifier enters the cause of death into EDRSs. NCHS then codes cause of death narratives from death certificates according to the International Classification of Diseases (Mortality). Currently, they use the 10th Revision (ICD–10).
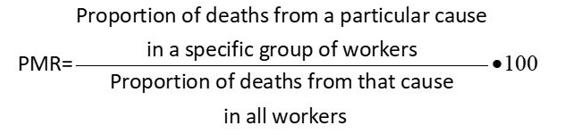
What is a Proportionate Mortality Ratio (PMR)?
PMRs are a common way of analyzing death certificate data. They are computed when the population at risk of death for a specific occupation is not known. Learn more and see an example of how PMRs can be used.
To calculate a PMR, the proportion of deaths due to a specific cause for a group of workers is divided by the proportion of deaths due to that cause in all workers. PMRs can be computed for occupation or industry.
How to interpret a PMR
A PMR greater than 100 indicates that a particular cause accounts for a greater proportion of deaths in the population of interest than is expected based on the proportion of deaths due to this cause in all workers.
Confidence intervals that do not include 100 indicate that the PMR is unexpectedly high or low.
What to consider when using PMRs
PMRs can be computed when the underlying population at risk cannot be determined (lack of denominator data for calculating rates). For example, data can be analyzed by demographic subgroups including racial/ethnic groups to monitor for inequities.
A PMR for one cause of death is dependent on other causes of death, if one cause of death is elevated other causes of death will be depressed. PMRs may bias risk estimates toward the null.
An elevated PMR does not indicate a direct causal relationship between the industry or occupation and the cause of death.
Strengths and limitations
- The NVSS includes all US vital statistics jurisdictions' industry and occupation data, starting with 2022 (and the majority in 2020).
- Researchers can analyze specific occupation, industry, and demographic groups due to the large number of records.
- Baseline surveillance data on mortality by occupation and industry are available.
- Data can be used to monitor trends and associations between occupational risk factors and specific health outcomes, particularly in chronic disease mortality.
- Data can inform policy and direct intervention or prevention efforts for the specific industry, occupation, and demographic groups with the greatest burden of disease.
- Death certificate data only includes information on the usual or longest-held occupation and industry.
- The usual occupation and industry or cause of death may be reported inaccurately. This may result in misclassification, which could be a source of bias.
- Occupational exposure information is not available, aside from what can be inferred from a person's occupation or industry.