At a glance
Seafood processing workers are at high risk for injury and illness. Strategies exist to address ergonomic hazards, language barriers, and fatigue hazards.

Overview
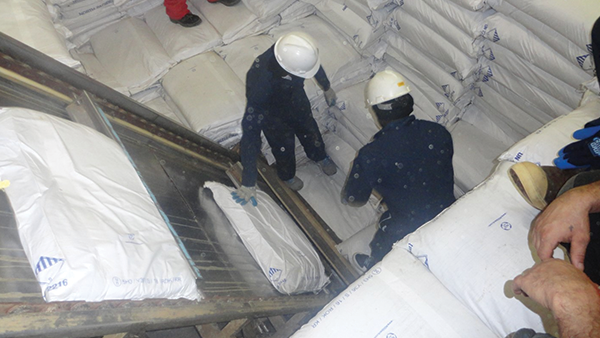
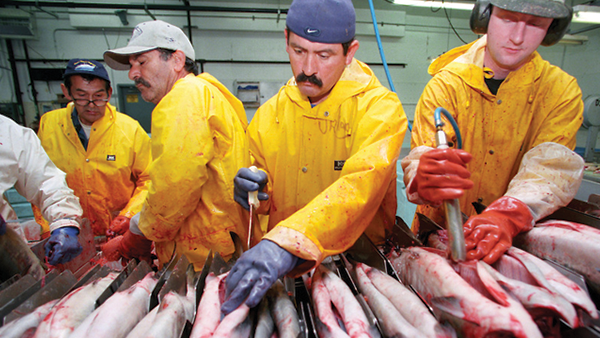
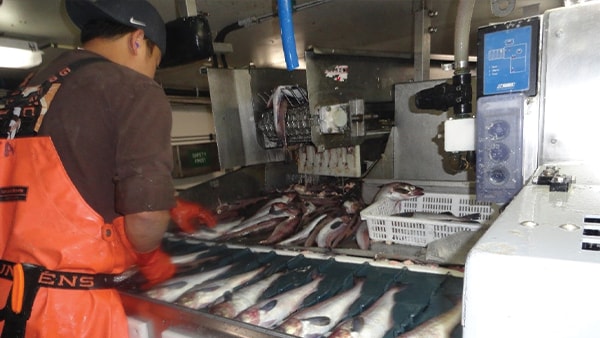
After seafood is harvested, it is processed in onshore and offshore factories in preparation for delivery to consumers. Seafood processing can include eviscerating, filleting, freezing, canning, and packaging fish and shellfish. In 2017, the estimated value of seafood processed in the U.S. was $12 billion, with processing adding value to the product.[1]
In the U.S. during 2018, the seafood processing industry included approximately 815 establishments and 35,000 workers.[2] In many establishments, the number of workers fluctuates seasonally, with higher employment during peak seafood harvesting seasons. During peak seasons, work shifts may last 8-16+ hours per day. Entry-level positions often have few requirements for education or experience. Seafood processors are a diverse workforce.
During 2011-2017, seafood processing workers had the highest injury/illness rate of any U.S. maritime workers at 6,670 injuries/illnesses per 100,000 workers.[3] Occupational hazards in this industry include ergonomic hazards; poor workplace organization; contact with objects, equipment, and machinery; and exposures to biological aerosols and organisms, excessive noise levels, wet walking and working surfaces, and low temperatures. You can use the information in the following pages to address ergonomic issues, fatigue issues, and language barriers can produce a less hazardous workplace environment for seafood processing workers.
- NMFS (National Marine Fisheries Service) [2018]. Fisheries of the United States, 2017. Silver Spring, MD: National Oceanic and Atmospheric Association, National Marine Fisheries Service, Office of Science and Technology.
- BLS [2018]. Table: NAICS 3117 Seafood product preparation and packaging, all counties, 2017 Annual Averages, all establishment sizes. In Quarterly Census of Employment and Wages. Washington, DC: U.S. Department of Labor, Bureau of Labor Statistics.
- BLS [2019]. Table 2. Numbers of nonfatal occupational injuries and illnesses by industry and case types, 2011 – 2017. In Survey of Occupational Injuries and Illnesses. Washington, DC: U.S. Department of Labor, Bureau of Labor Statistics.