


What to know
Summary
A data story from the National Center for Health Statistics
Authors: Julie Weeks, PhD; Nazik Elgaddal, MS; and Natalie Young, PhD
Get the data story
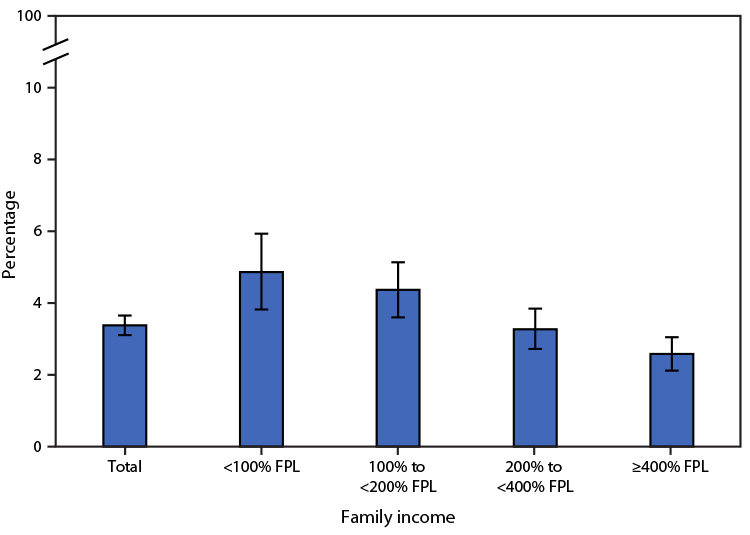
This figure is a vertical bar chart showing percentages by family income category. The y-axis is labeled "Percentage" and ranges from 0% to 10%, with a scale break extending to 100%. The x-axis is labeled "Family income" and includes five categories: Total, less than 100% of the federal poverty level (FPL), 100% to less than 200% FPL, 200% to less than 400% FPL, and 400% FPL or greater. Error bars represent 95% confidence intervals.
Estimated percentages
The highest percentage is among individuals with family income below 100% of the federal poverty level (4.9%), followed by those with family income between 100% and less than 200% of the federal poverty level (4.4%). Percentages decline as family income increases, with the lowest percentage among those with family income at or above 400% of the federal poverty level (2.6%). The overall percentage is 3.4%.
During 2020–2022, 3.4% of children and adolescents aged 3–17 years had received a diagnosis of autism spectrum disorder. The prevalence of autism spectrum disorder among children and adolescents decreased as family income increased.
https://www.cdc.gov/mmwr/volumes/73/wr/mm7315a5.htm
Supplementary Table: https://stacks.cdc.gov/view/cdc/152917
Source: National Center for Health Statistics, National Health Interview Survey, 2020–2022. https://www.cdc.gov/nchs/nhis.