


What to know

Get the data story
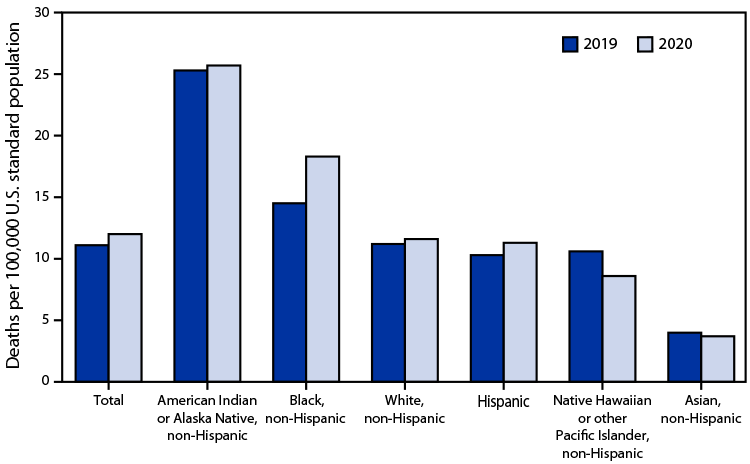
Age-adjusted death rates for motor vehicle traffic injury increased from 11.1 per 100,000 population in 2019 to 12.0 in 2020.
The rates increased from 10.3 to 11.3 for Hispanic persons, from 14.5 to 18.3 for non-Hispanic Black persons, and from 11.2 to 11.6 for non-Hispanic White persons.
The changes in rates among other groups were not statistically significant. During 2019 and 2020, the rates were highest for non-Hispanic American Indian or Alaska Native persons (25.3 and 25.7) and lowest for non-Hispanic Asian persons (4.0 and 3.7), respectively.
https://www.cdc.gov/mmwr/volumes/71/wr/mm7126a4.htm
Source: National Vital Statistics System, Underlying Cause of Death by Single-Race Categories, 2018–2020. https://wonder.cdc.gov/ucd-icd10- expanded.html.