


What to know

Summary
A data story from the National Center for Health Statistics
Authors: Ellen A. Kramarow, PhD, and Nazik Elgaddal, MS
Get the data story
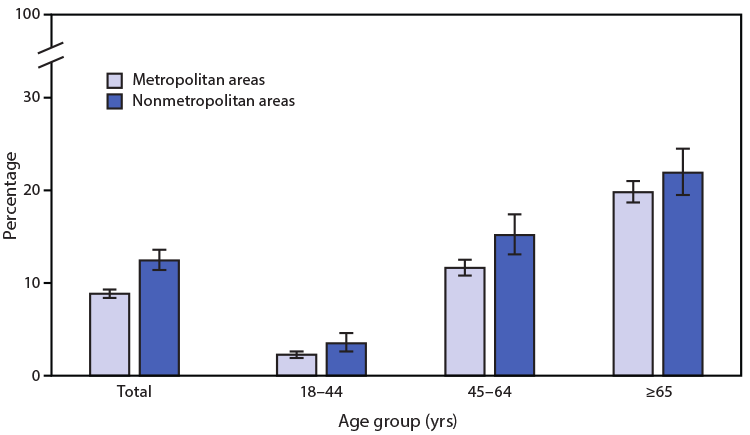
In 2019, the percentage of adults aged 18 years or older with diagnosed diabetes was higher among those living in nonmetropolitan areas (12.4%) than among those living in metropolitan areas (8.9%).
Percentages of adults with diagnosed diabetes were higher in nonmetropolitan than metropolitan areas for those aged 18–44 years (3.5% versus 2.3%) and 45–64 years (15.2% versus 11.6%).
Among adults aged 65 years or older, the difference by urbanization level (21.9% in nonmetropolitan areas versus 19.8% in metropolitan areas) did not reach statistical significance.
The prevalence of diagnosed diabetes increased with age in both nonmetropolitan and metropolitan areas.
https://www.cdc.gov/mmwr/volumes/70/wr/mm7018a4.htm
Source: National Center for Health Statistics, National Health Interview Survey, 2019. https://www.cdc.gov/nchs/nhis.