


What to know
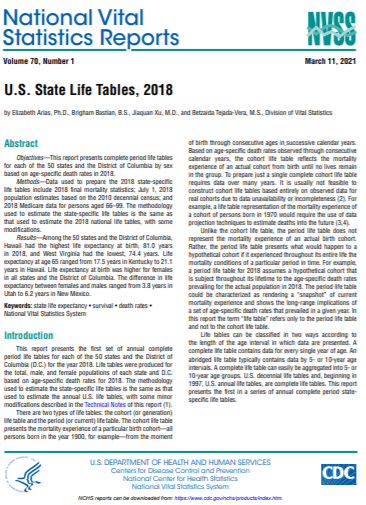
New NCHS report presents complete period life tables for each of the 50 states and the District of Columbia by sex based on age-specific death rates in 2018.
Get the data story
New NCHS report presents complete period life tables for each of the 50 states and the District of Columbia by sex based on age-specific death rates in 2018.
Key Findings:
- Among the 50 states and the District of Columbia, Hawaii had the highest life expectancy at birth, 81.0 years in 2018, and West Virginia had the lowest, 74.4 years.
- Life expectancy at age 65 ranged from 17.5 years in Kentucky to 21.1 years in Hawaii.
- Life expectancy at birth was higher for females in all states and the District of Columbia.
- The difference in life expectancy between females and males ranged from 3.8 years in Utah to 6.2 years in New Mexico.
Content Source:
National Center for Health Statistics