


What to know

Summary
A data story from the National Center for Health Statistics
Authors: Michael E. Martinez, MPH, MHSA; Tainya C. Clarke, PhD
Get the data story
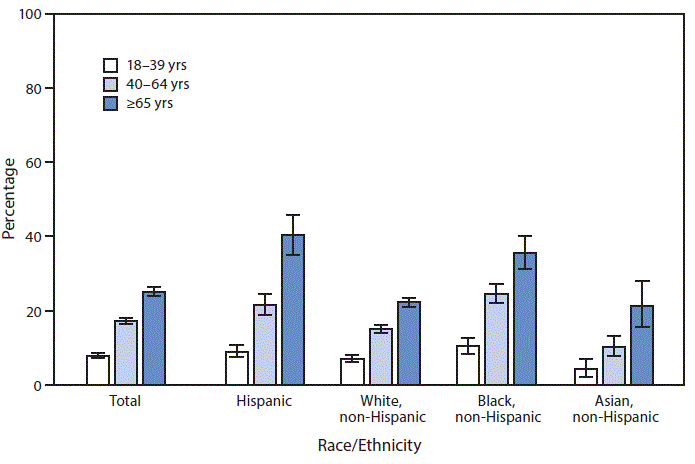
In 2019, the percentage of adults in fair or poor health increased by age (7.8% for those aged 18–39 years, 17.2% for those 40–64 years, and 25.1% for those ≥65 years) and for each racial/ethnic group shown.
Hispanic and non-Hispanic Black adults were most likely to be in fair or poor health in each age group.
Among persons aged 18–39 and 40–64 years, non-Hispanic Asian adults were least likely to be in fair or poor health.
Among persons aged ≥65 years, non-Hispanic Asian and non-Hispanic White adults were least likely to be in fair or poor health.
Hispanic and non-Hispanic Black adults aged ≥65 years had the highest percentages of fair or poor health (40.3% and 35.5%, respectively), and non-Hispanic Asian adults aged 18–39 years had the lowest percentage of fair or poor health (4.1%).
https://www.cdc.gov/mmwr/volumes/70/wr/mm7009a5.htm
Source: National Center for Health Statistics, National Health Interview Survey, 2019 data. https://www.cdc.gov/nchs/nhis.