


What to know
A new NCHS report provides national trends in motor vehicle traffic deaths by sex, age group, and type of road user (i.e., motor vehicle occupant, motorcyclist, pedestrian, or pedal cyclist) from 1999 through 2019.

Get the data story
A new NCHS report provides national trends in motor vehicle traffic deaths by sex, age group, and type of road user (i.e., motor vehicle occupant, motorcyclist, pedestrian, or pedal cyclist) from 1999 through 2019 using the latest mortality data from the National Vital Statistics System.
Findings:
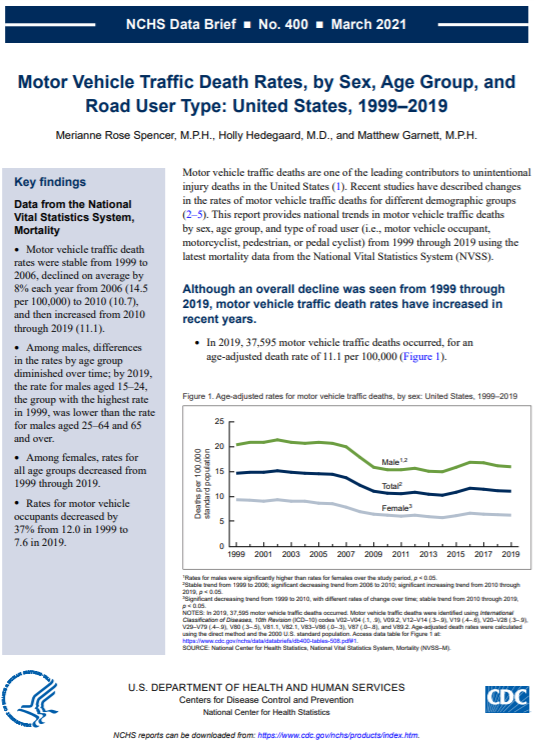
- Motor vehicle traffic death rates were stable from 1999 to 2006, declined on average by 8% each year from 2006 (14.5 per 100,000) to 2010 (10.7), and then increased from 2010 through 2019 (11.1).
- Among males, differences in the rates by age group diminished over time; by 2019, the rate for males aged 15–24, the group with the highest rate in 1999, was lower than the rate for males aged 25–64 and 65 and over.
- Among females, rates for all age groups decreased from 1999 through 2019.
- Rates for motor vehicle occupants decreased by 37% from 12.0 in 1999 to 7.6 in 2019.
Content Source:
National Center for Health Statistics