QuickStats: Rate of Emergency Department (ED) Visits by Homeless Status and Geographic Region§ — National Hospital Ambulatory Medical Care Survey, United States, 2015–2018

For Everyone

What to know

During 2015–2018, there were annual averages of 42 ED visits per 100 total population, 42 ED visits per 100 nonhomeless persons, and 203 ED visits per 100 homeless persons.
"QuickStats" over blue line, then "From the National Center for Health Statistics", then blue line + green/blue gradient

Summary

A data story from the National Center for Health Statistics

Authors: Susan M. Schappert, MA; Loredana Santo, MD; and Jill J. Ashman, PhD

Get the data story
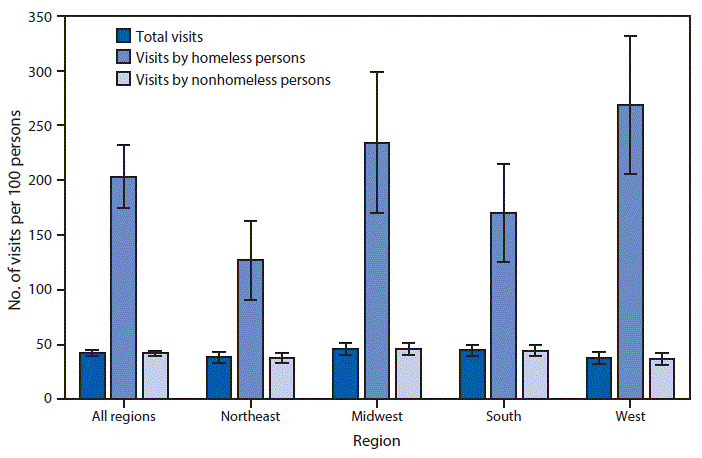
The figure is a bar graph showing the rate of emergency department visits in the United States during 2015–2018, by homeless status and geographic region, based on data from the National Hospital Ambulatory Medical Care Survey. During this period, there were annual averages of 42 ED visits per 100 total population, 42 ED visits per 100 nonhomeless persons, and 203 ED visits per 100 homeless persons.
Rate of emergency department visits in the United States during 2015–2018, by homeless status and geographic region

During 2015–2018, there were annual averages of 42 ED visits per 100 total population, 42 ED visits per 100 nonhomeless persons, and 203 ED visits per 100 homeless persons.

Within each region, the rate of ED visits among homeless persons was higher than the rate for nonhomeless persons.

The rates of visits for nonhomeless persons did not differ by region; however, among homeless persons, visit rates were higher in the West (268) than in the Northeast (127) and South (170) and higher in the Midwest (234) than in the Northeast.

https://www.cdc.gov/mmwr/volumes/69/wr/mm6950a8.htm

Source: National Center for Health Statistics, National Hospital Ambulatory Medical Care Survey, 2015–2018. https://www.cdc.gov/nchs/namcs/documentation/about-the-data-2018.html.