


What to know
During 2016–2018, women aged 18 years or older were more likely to volunteer or work in a hospital, medical clinic, doctor’s office, dentist’s office, nursing home, or some other health care facility than were men.
Get the data story
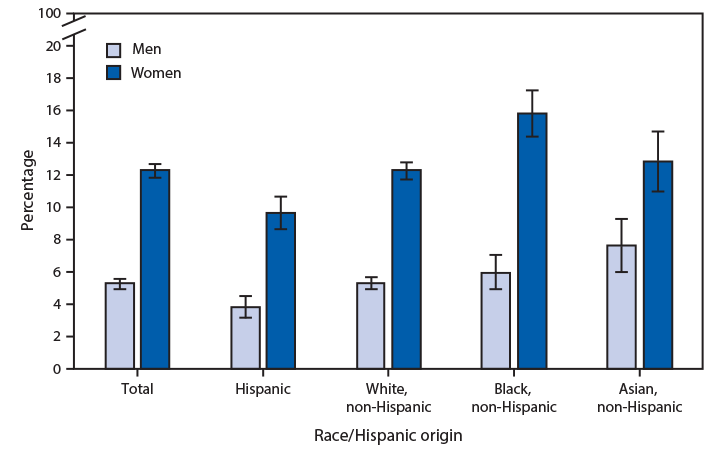
During 2016–2018, women aged 18 years or older were more likely to volunteer or work in a hospital, medical clinic, doctor’s office, dentist’s office, nursing home, or some other health care facility (health care settings) than were men (12.3% compared with 5.2%).
Non-Hispanic black (15.8%), Asian (12.8%), and white women (12.3%) were more likely to volunteer or work in health care settings than were Hispanic women (9.6%).
Non-Hispanic Asian men (7.6%) were more likely to volunteer or work in health care settings than were black (6.0%), white (5.3%), and Hispanic men (3.8%).
https://www.cdc.gov/mmwr/volumes/69/wr/mm6928a7.htm
Source: National Health Interview Survey, 2016–2018 data. https://www.cdc.gov/nchs/nhis.
Content Source:
National Center for Health Statistics