


What to know
The percentage of Hispanic adults aged 18–64 years who had a usual place to go for medical care was higher in 2018 than in 2008.

Summary
A data story from the National Center for Health Statistics
Authors: Michael E. Martinez, MPH, MHSA, and Tainya C. Clarke, PhD
Get the data story
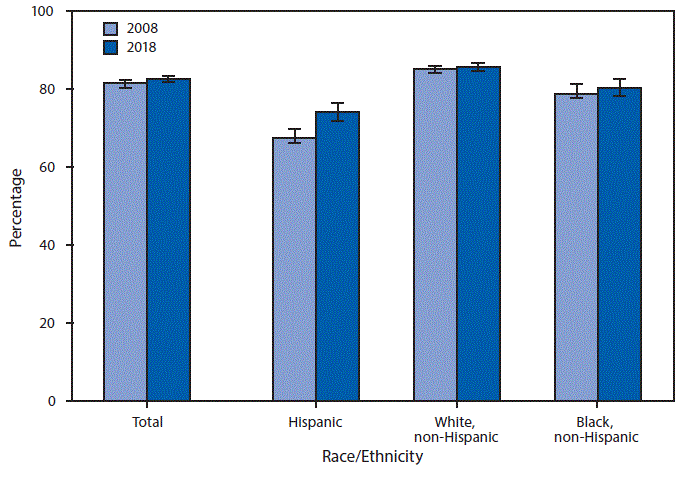
Although the percentage of Hispanic adults aged 18–64 years who had a usual place to go for medical care was higher in 2018 (74.1%) than in 2008 (67.3%), Hispanic adults remained the least likely to have a usual place to go for medical care.
Non-Hispanic white adults were the most likely to have a usual place for medical care in both 2008 (85.0%) and 2018 (85.5%).
In 2008, 78.7% of non-Hispanic black adults had a usual place for health care compared with 80.4% in 2018.
https://www.cdc.gov/mmwr/volumes/69/wr/mm6905a6.htm
Source: National Health Interview Survey, 2008 and 2018 data. https://www.cdc.gov/nchs/nhis.
Content Source:
National Center for Health Statistics