QuickStats: Percentage of Emergency Department Visits for Pain at Which Opioids Were Given or Prescribed, by Geographic Region of the Hospital — United States, 2005–2017

For Everyone

What to know

The percentage of emergency department visits for pain at which an opioid was given or prescribed increased from 37.4% in 2005 to 43.1% in 2010 and then decreased to 30.9% in 2017.
"QuickStats" over blue line, then "From the National Center for Health Statistics", then blue line + green/blue gradient

Summary

A data story from the National Center for Health Statistics

Authors: Susan M. Schappert, MA, and Loredana Santo, MD

Get the data story
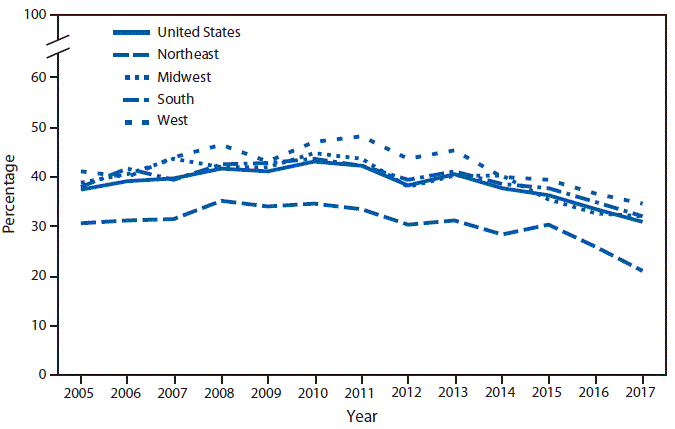
The figure is a line chart showing that the percentage of emergency department visits for pain at which an opioid was given or prescribed increased from 37.4% in 2005 to 43.1% in 2010 and then decreased to 30.9% in 2017. A similar pattern was observed in all four regions. Percentages for the Northeast were lower than for the nation as a whole for all years analyzed. In 2017, the percentage was 21.1% in the Northeast, compared with 32.0% in the Midwest, 32.0% in the South, and 34.7% in the West.
Percentage of emergency department visits for pain at which an opioid was given or prescribed.

The percentage of emergency department visits for pain at which an opioid was given or prescribed increased from 37.4% in 2005 to 43.1% in 2010 and then decreased to 30.9% in 2017.

A similar pattern was observed in all four regions. Percentages for the Northeast were lower than for the nation as a whole for all years analyzed.

In 2017, the percentage was 21.1% in the Northeast, compared with 32.0% in the Midwest, 32.0% in the South, and 34.7% in the West.

https://www.cdc.gov/mmwr/volumes/69/wr/mm6902a6.htm

Source: National Center for Health Statistics. National Hospital Ambulatory Medical Care Survey, 2005–2017. https://www.cdc.gov/nchs/namcs.