Key points
- High-Impact Prevention (HIP) is a public health approach to disease prevention.
- HIP aims to prevent the greatest number of new infections, save life-years, and reduce population disparities.
- HIP works to achieve these outcomes through the most cost-effective and scalable interventions.

What it is
High-Impact Prevention (HIP) is a public health approach to disease prevention. It uses proven, cost-effective, and scalable interventions to target specific populations based on disease burden. It provides a strategy for using data to maximize the impact of available resources and interventions.
The main goals of HIP are to prevent the largest number of new infections, save life-years, and reduce disparities in populations. This approach to disease prevention uses resources aligned with disease burden in specific locations and within populations.
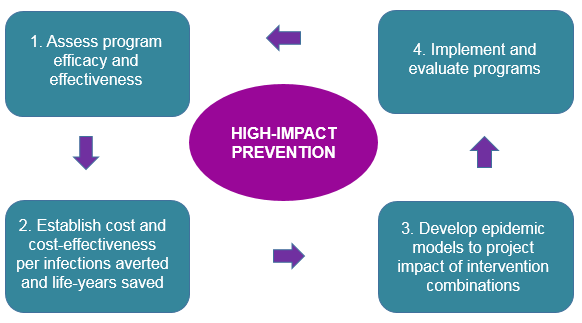
HIP involves four steps to choose which interventions will lead to the largest reduction in disease or disparities given available resources:
- Assess program efficacy and effectiveness.
- Establish cost and cost-effectiveness per infection averted and life-years saved.
- Develop epidemic models to project impact of intervention combinations.
- Implement and evaluate programs.
Impact
HIP uses data for identifying or monitoring a priority area, choosing the best intervention for the jurisdiction, and providing ongoing observation and evaluation.
CDC coordinates this effort in a more structured framework to direct national priorities, evaluate interventions, and provide the most effective ones. CDC can also develop cost-effective models and provide funding and technical assistance to jurisdictions.
Overall, HIP can help:
- Define the public health problem
- Focus resources
- Increase efficiency
- Identify the most cost-effective services for a jurisdiction
HIP can also help to:
- Prevent new infections
- Increase years of life
- Reduce disparities and save lives
Program priorities
CDC funds jurisdictions by aligning the amount of funding by the disease burden in an area. It calculates the amount of cases in an area by using surveillance data. Funding amounts are then set on the basis of disease burden in an area.
Other factors are sometimes considered, including:
- Merit
- Disease severity among patients
- Reducing disparities in populations with low disease burden but high rates of poor outcomes
All jurisdictions receive a baseline amount to fund required HIP program activities. Populations with low burden but high disparities are considered high priority for receiving HIP resources.
HIP is implemented through a two-part process. HIP does this by:
- Aligning resources with disease burden in specific locations and within populations
- Implementing programs that are cost-effective, scalable, and evaluated over time
What we've accomplished
HIP approach to HIV screening and testing
From 2007 to 2010, the CDC-funded Expanded Testing Initiative sites provided more than 2.8 million human immunodeficiency virus (HIV) tests. This resulted in approximately 18,000 new HIV diagnoses. This helped prevent $1.2 billion in direct medical costs because every $1.00 spent on HIV testing saved the public $2.00.
Since then, approximately one-third of all new HIV diagnoses in 2013 were through a CDC-funded HIV test. These persons, who had been living with undiagnosed HIV, then had the opportunity to receive life-saving treatment. This also reduces the risk of transmitting the virus to others.
HIP TB program funding alignment
More than a decade ago, CDC changed the way that it gave out tuberculosis (TB) program funding to meet the needs of all jurisdictions that needed it. The previous program endured a flat-level budget while the study of TB in the United States changed.
The new formula for funding TB programs in the U.S. used the average number of TB cases and considered risk factors that make it harder to treat. The TB elimination formula helped allocate program funding to local areas burdened with TB with two performance indicators:
- Number of TB patients who completed treatment in 12 months
- Number of TB patients who had TB isolates that underwent testing for drug susceptibility