Viral and Vaccination History
‹View Table of Contents
Male Registry participants with hemophilia A or B born in 1985 or later were much less likely to have a history of HBV, HCV, or HIV infection compared to males born before 1985 (Table 6).
Table 6. Overview of HBV, HCV, and HIV viral and vaccination status among male Registry participants with hemophilia, by year of birth
| Hemophilia A | Hemophilia B | |||||||
|---|---|---|---|---|---|---|---|---|
| Born pre–1985 | Born 1985 or later | Born pre–1985 | Born 1985 or later | |||||
| n | % | n | % | n | % | n | % | |
| History of HBV | ||||||||
| Yes | 368 | 17.4% | 65 | 1.3% | 144 | 21.6% | 19 | 1.5% |
| No | 1,507 | 71.5% | 4,709 | 91.1% | 444 | 66.6% | 1,107 | 90.0% |
| Unknown | 234 | 11.1% | 393 | 7.6% | 79 | 11.8% | 104 | 8.5% |
| History of HCV | ||||||||
| Yes | 1,544 | 73.2% | 143 | 2.8% | 396 | 59.4% | 47 | 3.8% |
| No | 527 | 25.0% | 4,697 | 90.9% | 249 | 37.3% | 1,087 | 88.4% |
| Unknown | 38 | 1.8% | 327 | 6.3% | 22 | 3.3% | 96 | 7.8% |
| History of HIV | ||||||||
| Yes | 523 | 24.8% | 16 | 0.3% | 76 | 11.4% | * | * |
| No | 1,530 | 72.5% | 4,808 | 93.1% | 559 | 83.8% | 1,124 | 91.4% |
| Unknown | 56 | 2.7% | 343 | 6.6% | 32 | 4.8% | * | * |
Due to rounding, percentages may not add up to exactly 100%
* Counts less than six have been suppressed to protect patient confidentiality
Viral Status and Severity
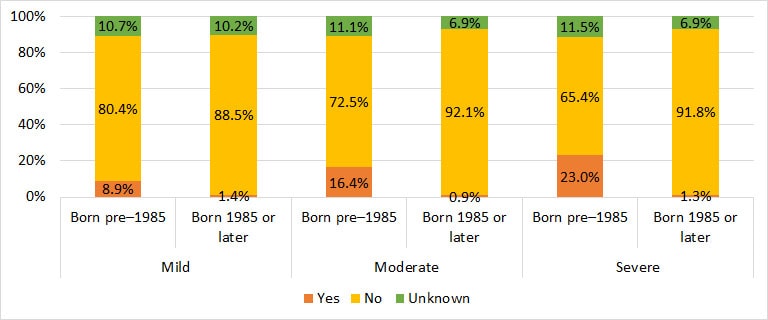
Among male Registry participants with hemophilia A who were born before 1985, 23% of those categorized as severe had a history of HBV, compared to 16% of those categorized as moderate and 9% of those categorized as mild. Regardless of severity, few hemophilia A participants born in 1985 or later had a history of HBV (Figure 11).
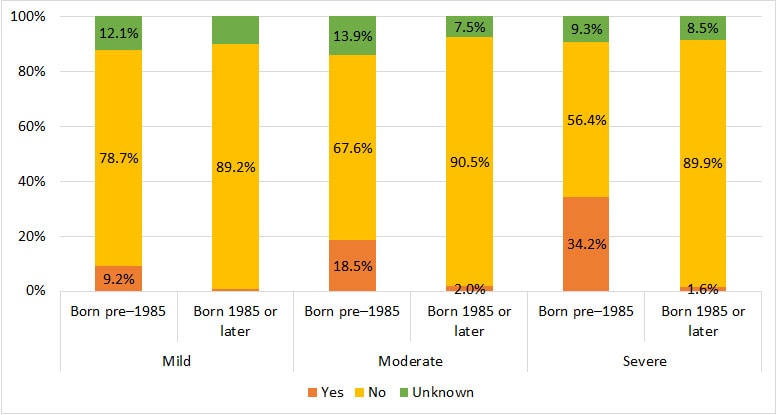
Among male Registry participants with hemophilia B born before 1985, 34% of those categorized as severe had a history of HBV, compared to 19% of participants categorized as moderate and 9% categorized as mild (Figure 12).
Figure 11. History of HBV among male Registry participants with hemophilia A, by severity and year of birth
| Mild | Moderate | Severe | ||||||||||
|---|---|---|---|---|---|---|---|---|---|---|---|---|
| Born pre–1985 | Born 1985 or later | Born pre–1985 | Born 1985 or later | Born pre–1985 | Born 1985 or later | |||||||
| Yes | 57 | 8.9% | 14 | 1.4% | 65 | 16.4% | 8 | 0.9% | 242 | 23.0% | 43 | 1.3% |
| No | 516 | 80.4% | 912 | 88.5% | 287 | 72.5% | 798 | 92.1% | 687 | 65.4% | 2,980 | 91.8% |
| Unknown | 69 | 10.7% | 105 | 10.2% | 44 | 11.1% | 60 | 6.9% | 121 | 11.5% | 223 | 6.9% |
Figure 12: History of HBV among male Registry participants with hemophilia B, by severity and year of birth
| Mild | Moderate | Severe | ||||||||||
|---|---|---|---|---|---|---|---|---|---|---|---|---|
| Born pre–1985 | Born 1985 or later | Born pre–1985 | Born 1985 or later | Born pre–1985 | Born 1985 or later | |||||||
| Yes | 16 | 9.2% | * | * | 48 | 18.5% | 9 | 2.0% | 77 | 34.2% | 8 | 1.6% |
| No | 137 | 78.7% | 231 | 89.2% | 175 | 67.6% | 410 | 90.5% | 127 | 56.4% | 464 | 89.9% |
| Unknown | 21 | 12.1% | * | * | 36 | 13.9% | 34 | 7.5% | 21 | 9.3% | 44 | 8.5% |
* Counts less than six have been suppressed to protect patient confidentiality
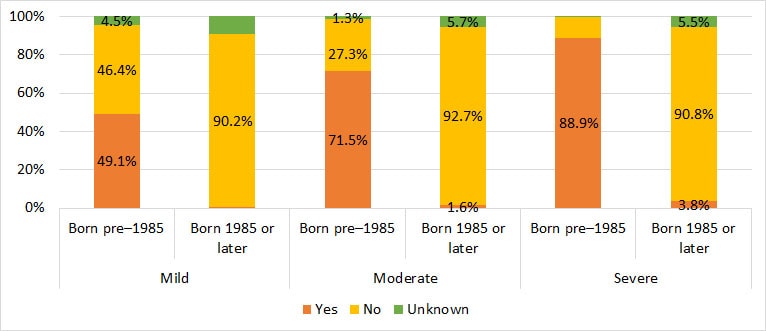
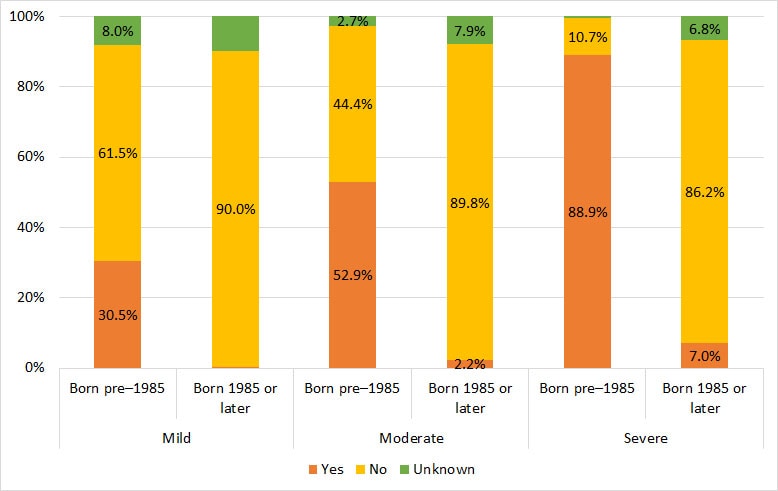
Among male Registry participants with hemophilia A or B born before 1985, history of HCV increased with severity. Eighty-nine percent of males born before 1985 with severe hemophilia A and 89% with severe hemophilia B had a history of HCV. Seventy-two percent with moderate hemophilia A, 53% with moderate hemophilia B, 49% with mild hemophilia A, and 31% with mild hemophilia B had a history of HCV. (Figures 13 and 14).
Figure 13. History of HCV among male Registry participants with hemophilia A, by severity and year of birth.
| Mild | Moderate | Severe | ||||||||||
|---|---|---|---|---|---|---|---|---|---|---|---|---|
| Born pre–1985 | Born 1985 or later | Born pre–1985 | Born 1985 or later | Born pre–1985 | Born 1985 or later | |||||||
| Yes | 315 | 49.1% | * | * | 283 | 71.5% | 14 | 1.6% | 933 | 88.9% | 123 | 3.8% |
| No | 298 | 46.4% | 930 | 90.2% | 108 | 27.3% | 803 | 92.7% | * | * | 2946 | 90.8% |
| Unknown | 29 | 4.5% | * | * | 5 | 1.3% | 49 | 5.7% | * | * | 177 | 5.5% |
* Counts less than six have been suppressed to protect patient confidentiality
Figure 14: History of HCV among male Registry participants with hemophilia B, by severity and year of birth
| Mild | Moderate | Severe | ||||||||||
|---|---|---|---|---|---|---|---|---|---|---|---|---|
| Born pre–1985 | Born 1985 or later | Born pre–1985 | Born 1985 or later | Born pre–1985 | Born 1985 or later | |||||||
| Yes | 53 | 30.5% | * | * | 137 | 52.9% | 10 | 2.2% | 200 | 88.9% | 36 | 7.0% |
| No | 107 | 61.5% | 233 | 90.0% | 115 | 44.4% | 407 | 89.8% | 24 | 10.7% | 445 | 86.2% |
| Unknown | 14 | 8.0% | * | * | 7 | 2.7% | 36 | 7.9% | * | * | 35 | 6.8% |
* Counts less than six have been suppressed to protect patient confidentiality
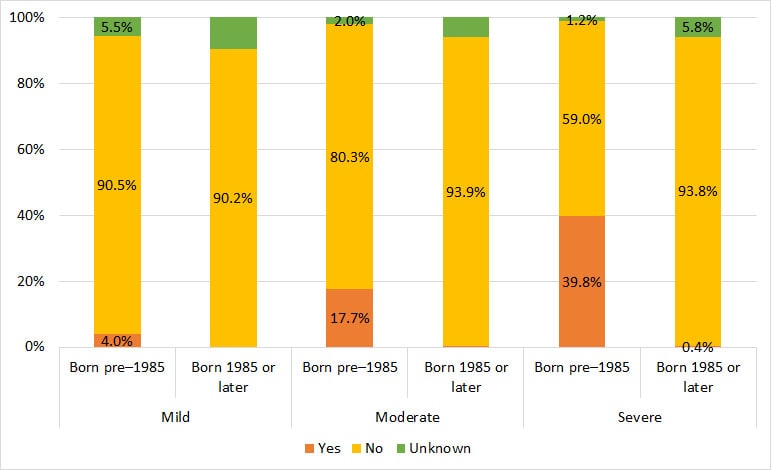
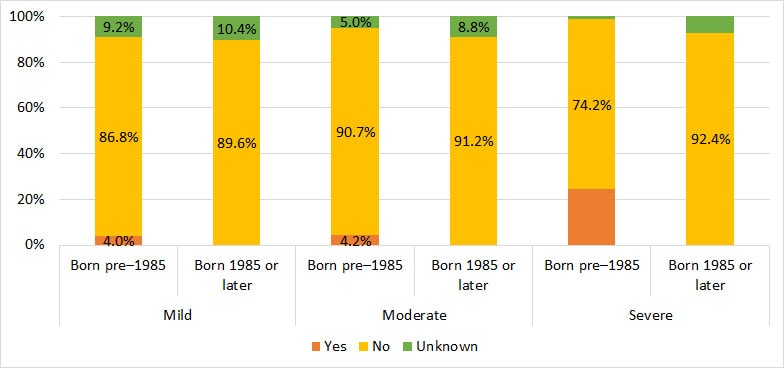
Among male Registry participants with hemophilia A or B born before 1985, those categorized as severe were more likely to have a history of HIV. Among male Registry participants born before 1985 with severe hemophilia A or severe hemophilia B, 40% and 24%, respectively, had a history of HIV. Among male Registry participants, a history of HIV was present in 18% with moderate hemophilia A, 4% with moderate hemophilia B, and 4% with mild hemophilia A or B (Figures 15 and 16).
Figure 15: History of HIV among male Registry participants with hemophilia A, by severity and year of birth
| Mild | Moderate | Severe | ||||||||||
|---|---|---|---|---|---|---|---|---|---|---|---|---|
| Born pre–1985 | Born 1985 or later | Born pre–1985 | Born 1985 or later | Born pre–1985 | Born 1985 or later | |||||||
| Yes | 26 | 4.0% | * | * | 70 | 17.7% | * | * | 418 | 39.8% | 13 | 0.4% |
| No | 581 | 90.5% | 930 | 90.2% | 318 | 80.3% | 813 | 93.9% | 619 | 59.0% | 3046 | 93.8% |
| Unknown | 35 | 5.5% | * | * | 8 | 2.0% | * | * | 13 | 1.2% | 187 | 5.8% |
* Counts less than six have been suppressed to protect patient confidentiality
Figure 16: History of HIV among male Registry participants with hemophilia B, by severity and year of birth
| Mild | Moderate | Severe | ||||||||||
|---|---|---|---|---|---|---|---|---|---|---|---|---|
| Born pre–1985 | Born 1985 or later | Born pre–1985 | Born 1985 or later | Born pre–1985 | Born 1985 or later | |||||||
| Yes | 7 | 4.0% | * | * | 11 | 4.2% | * | * | * | * | * | * |
| No | 151 | 86.8% | 232 | 90% | 235 | 90.7% | 413 | 91.2% | 167 | 74.2% | 477 | 92.4% |
| Unknown | 16 | 9.2% | * | * | 13 | 5.0% | * | * | * | * | * | * |
* Counts less than six have been suppressed to protect patient confidentiality
Vaccination Status
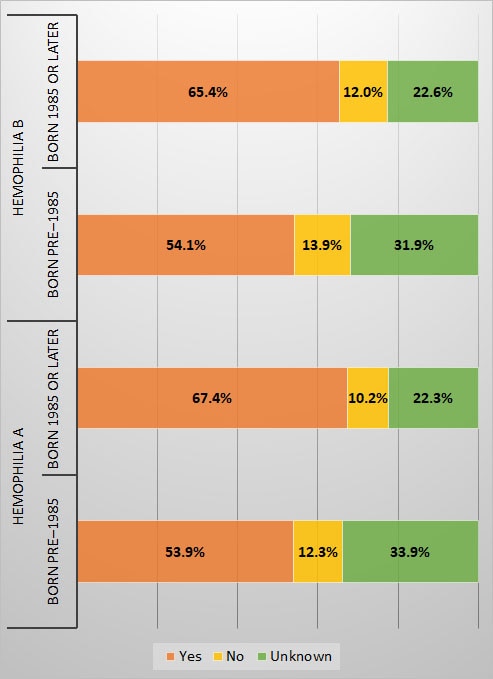
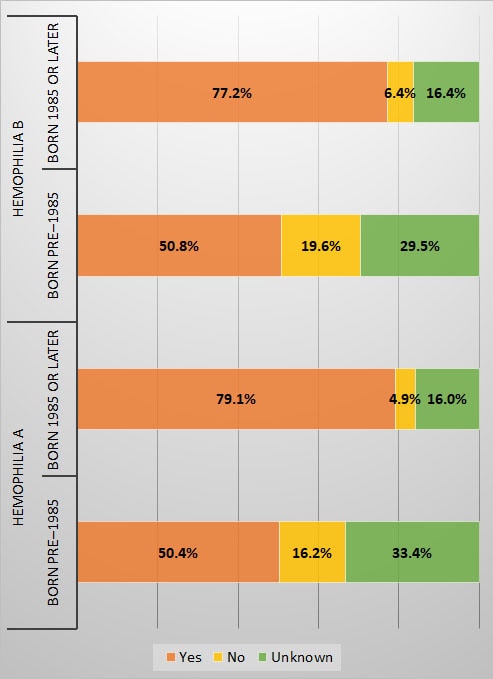
Male Registry participants with hemophilia, who were born in 1985 or later, received vaccination for HAV and HBV more often than the male Registry participants born before 1985; vaccination rates were similar for both hemophilia A and B (Figures 17 and 18).
Figure 17. History of HAV vaccination among male Registry participants with hemophilia, by diagnosis and year of birth
| Hemophilia A | Hemophilia B | |||||||
|---|---|---|---|---|---|---|---|---|
| Born pre–1985 | Born 1985 or later | Born pre–1985 | Born 1985 or later | |||||
| Yes | 1,136 | 53.9% | 3,485 | 67.4% | 361 | 54.1% | 804 | 65.4% |
| No | 259 | 12.3% | 529 | 10.2% | 93 | 13.9% | 148 | 12.0% |
| Unknown | 714 | 33.9% | 1,153 | 22.3% | 213 | 31.9% | 278 | 22.6% |
Figure 18. History of HBV vaccination among male Registry participants with hemophilia, by diagnosis and year of birth
| Hemophilia A | Hemophilia B | |||||||
|---|---|---|---|---|---|---|---|---|
| Born pre–1985 | Born 1985 or later | Born pre–1985 | Born 1985 or later | |||||
| Yes | 1,062 | 50.4% | 4,088 | 79.1% | 339 | 50.8% | 949 | 77.2% |
| No | 342 | 16.2% | 254 | 4.9% | 131 | 19.6% | 79 | 6.4% |
| Unknown | 705 | 33.4% | 825 | 16.0% | 197 | 29.5% | 202 | 16.4% |
Pages in this Report
- Highlights & Acknowledgements
- Background
- Methods
- Geographic Distribution of Registry Participants
- Diagnosis & Severity
- Registry Characteristics
- Age
- Race/Ethnicity
- Education
- Weight Status
- Health Insurance Coverage
- ›Viral and Vaccination History
- Healthcare Utilization and Absenteeism
- Family History and Genetic Mutation
- Complications
- Treatment
- Procedures and Comorbid Conditions
- Technical Notes
- Participating HTCs