Newborn Screening (NBS) Data, Michigan, 2014–2018

The Bloodline is a quarterly newsletter that provides updates about the SCDC program. Click here to read past newsletters, and subscribe to the newsletter to stay updated on the SCDC program’s health communications activities, data, presentations, and more.
The Sickle Cell Data Collection (SCDC) program monitors and reports on the health of people with sickle cell disease (SCD) over time. Data from the state’s newborn screening (NBS) program are an important part of the SCDC program because they provide information about the SCD births that occur every year. Michigan’s most recent NBS data, 2014–2018, are presented below.
The data provide the number of babies born with SCD in the state, their demographics, and their type of SCD. The people included in these data were born in Michigan during 2014–2018 and reported by the state NBS program with a confirmed diagnosis of SCD.
The individuals in the NBS data are also included in the Michigan SCDC program data for the years during which they were living in the state.

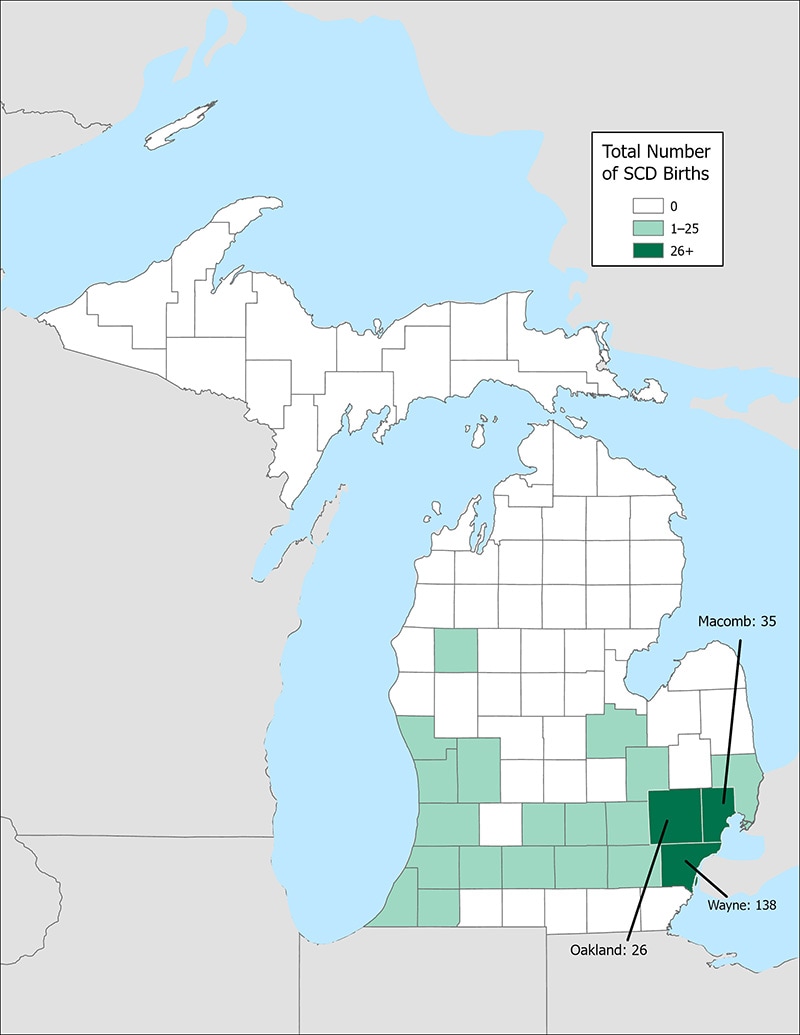
Map 1: Almost 25% of the counties in Michigan had at least one SCD birth during 2014–2018. More than 45% of the SCD births in Michigan occurred in Wayne County.

Figure 1. There was an average of 59 SCD births per year in Michigan during 2014–2018.

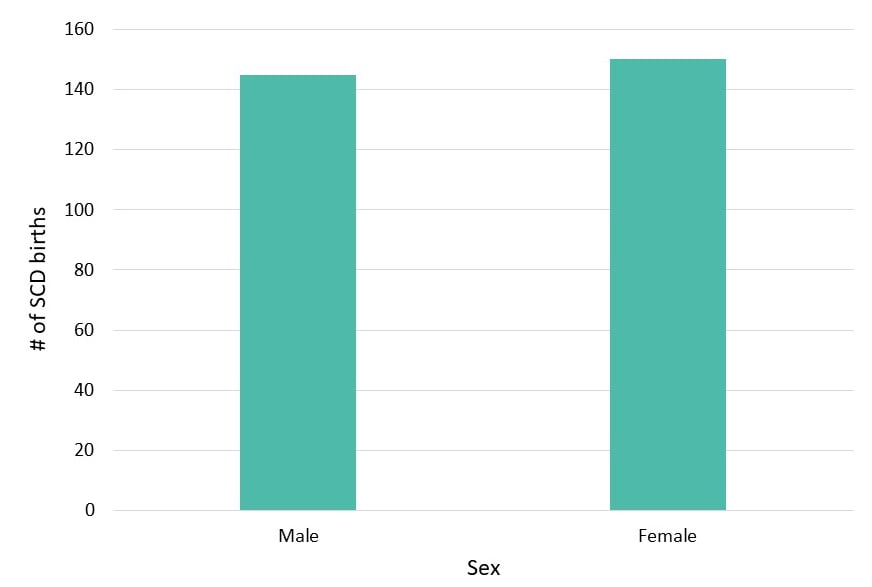
Figure 2: There was a total of 295 SCD births in Michigan during 2014–2018. There were 145 male births (49%) and 150 female births (51%).
*NOTE: The sum of all categories may be less than the total number of births if there are individuals with missing data.

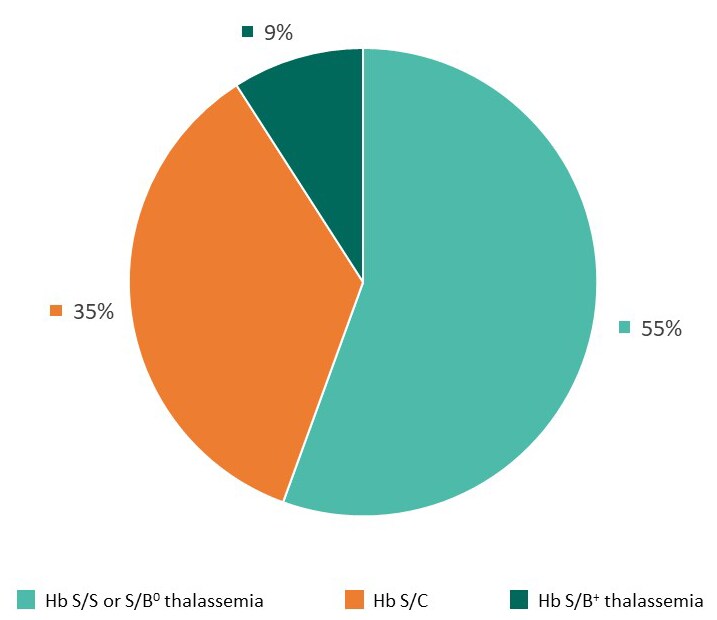
Figure 3: Fifty-five percent of the SCD births in Michigan during 2014–2018 were babies with hemoglobin (Hb) S/S or S/β0 thalassemia, 35% were Hb S/C, and 9% were Hb S/β+ thalassemia. The remaining babies had other or unknown types of SCD.
*NOTE: The sum of all categories may not total to 100% due to rounding errors.
