A Deeper Dive
‹View Table of Contents
Frequently Asked Questions About the ADDM Network Data
How was this information collected?
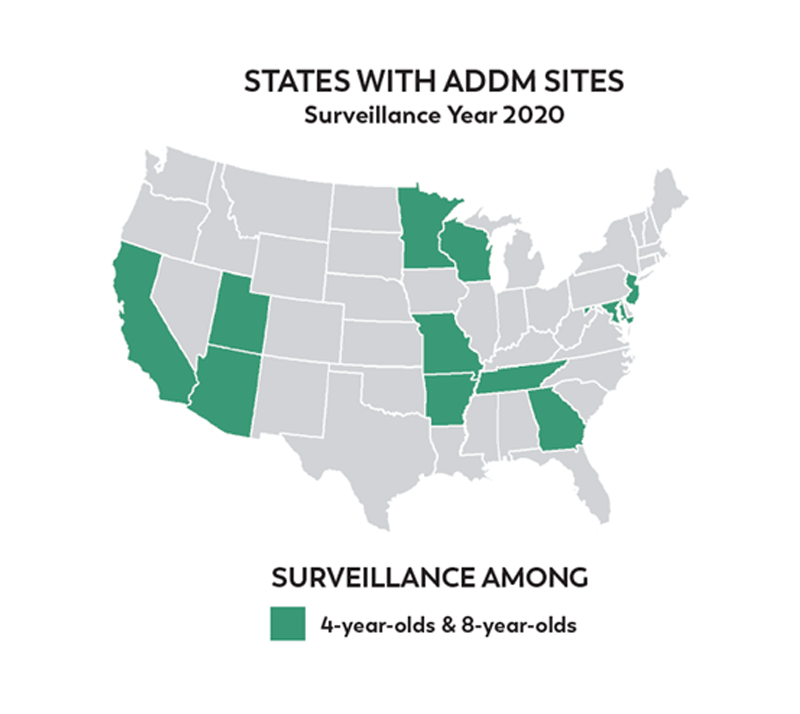
The ADDM Network uses a systematic record review method. Specifically, the information reported by the ADDM Network is based on the analysis of data collected from the health and special education records of 4-year-old and 8-year-old children who lived in one of 11 different areas throughout the United States in 2020. In 2018, CDC updated and simplified the way the ADDM Network collects and reviews data, resulting in faster publication of these data.
Where was this information collected? Which children does it include?
2020 Tracking area: specific sites in Arizona, Arkansas, California, Georgia, Maryland, Minnesota, Missouri, New Jersey, Tennessee, Utah, and Wisconsin (see “Site pages” for more information)
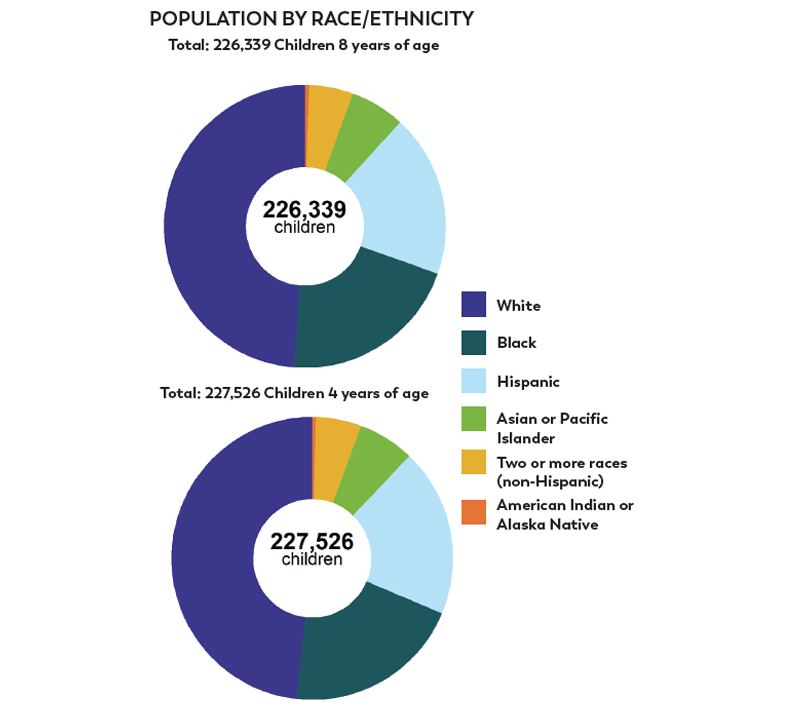
Population of 8-year-old children in tracking area: 226,339
- 49% White
- 21% Black
- 19% Hispanic
- 6% Asian or Pacific Islander
- 1% American Indian or Alaska Native
- 5% Two or more races (non-Hispanic)
Population of 4-year-old children in tracking area: 227,526
- 48% White
- 20% Black
- 19% Hispanic
- 6% Asian or Pacific Islander
- Less than 1% American Indian or Alaska Native
- 5% Two or more races (non-Hispanic)
What is the key message?
The COVID-19 pandemic brought disruptions to early ASD identification among young children. These disruptions may have long-lasting effects as a result of delays in identification and initiation of services. Communities could benefit from assessing local disruptions and continued monitoring of access to evaluation and support services for all children. ADDM data show that ASD is common across all groups of children. These findings highlight the need for timely and equitable access to early identification and support services.

Why was the percentage of children identified with ASD higher in some areas than in others?
Currently, research does not show that living in certain communities puts children at greater risk for developing ASD. These differences in the percentage of children identified with ASD across areas may be due to differences in availability of services for early detection and evaluation and diagnostic practices. For example, there may be differences in whether children have insurance or meet the eligibility criteria for access to early intervention services (1). These differences can help us learn more about the policies and programs that have contributed to advancements in early identification and better support for children.
Why does the ADDM ASD percentage estimates differ from other ASD percentage estimates?
Estimates from the ADDM Network, the National Survey of Children’s Health (NSCH), and the National Health Interview Survey (NHIS) cannot be directly compared because they use different methods to collect their information and look at different age groups. NSCH and NHIS, based on national surveys of parental experiences, can provide insight into how many children have been diagnosed with ASD and other developmental disabilities. The ADDM Network further enriches our understanding of ASD by working with communities across the United States to collect information on specific characteristics of children with ASD and track changes over time in those communities and within groups with similar characteristics.
Pages in this Report
- 2023 Community Report on Autism
- Executive Summary
- Key Findings from the ADDM Network
- ›A Deeper Dive
- Spotlight On: Progress in Early Identification Disrupted during the COVID-19 Pandemic
- Spotlight On: A New Pattern in Racial and Ethnic Differences
- Data for Action
- ADDM Network Site Snapshots Overview
- A Snapshot of Autism Spectrum Disorder in Arizona
- A Snapshot of Autism Spectrum Disorder in Arkansas
- A Snapshot of Autism Spectrum Disorder in California
- A Snapshot of Autism Spectrum Disorder in Georgia
- A Snapshot of Autism Spectrum Disorder in Maryland
- A Snapshot of Autism Spectrum Disorder in Minnesota
- A Snapshot of Autism Spectrum Disorder in Missouri
- A Snapshot of Autism Spectrum Disorder in New Jersey
- A Snapshot of Autism Spectrum Disorder in Tennessee
- A Snapshot of Autism Spectrum Disorder in Utah
- A Snapshot of Autism Spectrum Disorder in Wisconsin
- Glossary
- References

