Early Hearing Detection and Intervention Among Infants — Hearing Screening and Follow-up Survey, United States, 2005–2006 and 2009–2010
Corresponding author: Marcus Gaffney, Division of Human Development and Disability, National Center on Birth Defects and Developmental Disabilities, CDC. Telephone: 404-498-3031; E-mail: mgaffney@cdc.gov.
Introduction
Two to three infants per 1,000 live births are born deaf or hard of hearing (1). When left undetected, a hearing loss can delay a child's speech and language development. Approximately 40% of young adults with hearing loss identified during childhood reported experiencing at least one limitation in daily functioning (2). A total of 41 states, Guam, and the District of Columbia have passed statutes or regulatory guidance related to the identification of deaf and hard of hearing infants. All U.S. jurisdictions also have now established Early Hearing Detection and Intervention (EHDI) programs. These programs represent an evidence-based public health approach that connects public health and clinical preventive services to address the needs of infants who are deaf and hard of hearing (3,4). With support from public health agencies at both the jurisdictional and federal levels, EHDI programs help ensure that infants are screened for hearing loss and receive recommended follow-up through active tracking, surveillance, and coordination with clinical service providers and families.
National benchmarks for the EHDI process include screening no later than age 1 month, diagnostic audiologic testing no later than age 3 months (for infants failing the screening), and enrollment in early intervention no later than age 6 months (for those identified with a hearing loss). Progress towards these 1-3-6 benchmarks is measured by Healthy People 2020 Objective ENT-VSL-1 and three child health quality measures that were endorsed by the National Quality Forum (NQF) in August 2011 (NQF #1354: hearing screening before discharge from the hospital, NQF #1360: audiological evaluation no later than age 3 months [for those failing the screening], and NQF #1361: intervention no later than age 6 months [for those identified with a hearing loss]) (5,6). The lifetime educational cost of hearing loss has been estimated at $115,600 per child (year 2007 value for >40 dB permanent loss without other disabilities) and is determined on the basis of average annual expenditures of $15,992 for elementary and secondary school students who were receiving special education services for hearing loss or deafness during the 1999–2000 school year (7). During the 1999–2000 school year, the total cost in the United States for special education programs for children who were deaf or hard of hearing was $652 million, or $11,006 per child (8).
Newborn hearing screening has been recommended by three national organizations. The U.S. Preventive Services Task Force (USPSTF) recommends screening for hearing loss in all newborn infants. This is a USPSTF Grade B recommendation, which means USPSTF recommends the service. There is moderate certainty that the net benefit of screening all newborn infants for hearing loss is moderate (3). Hearing screening also is one of the core conditions included in the Recommended Uniform Screening Panel that was developed by the U.S. Department of Health and Human Services Secretary's Advisory Committee on Heritable Disorders in Newborns and Children (SACHDNC) (3,9). Newborn hearing screening also has been endorsed by the Joint Committee on Infant Hearing (JCIH), whose members include multiple national professional and advocacy organizations (10). Hearing level is measured in decibels (dB) and classified on the basis of laterality (unilateral or bilateral), type (e.g., conductive, sensorineural, mixed, or central), and severity (e.g., mild, moderate, severe, or profound) (11). If a newborn fails the hearing screening typically administered before discharge from the birthing facility, diagnostic testing is needed to confirm if a hearing loss is present. This testing is to be performed by a qualified health-care provider (e.g., pediatric audiologist). Because of the potential effect of hearing loss on a child's ability to develop speech, language, and social skills, intervention services should start as soon as possible and no later than age 6 months (12).
The reports in this supplement provide the public and stakeholders responsible for infant, child, and adolescent health (including public health practitioners, parents or guardians and their employers, health plans, health professionals, schools, child care facilities, community groups, and voluntary associations) with easily understood and transparent information about the use of selected clinical preventive services that can improve the health of infants, children, and adolescents. The topic in this report is one of 11 topics selected on the basis of existing evidence-based clinical practice recommendations or guidelines for the preventive services and availability of data system(s) for monitoring (13). This report analyzes 2009–2010 data from the CDC EHDI Hearing Screening and Follow-up Survey (HSFS) and compares it to data from 2005–2006 to assess progress in key areas. These comparisons include the provision of recommended hearing screening, diagnostic, and early intervention services both irrespective of age and in accordance with the 1-3-6 benchmarks. Public health authorities and health-care providers can use these data to assess progress towards national benchmarks and identify areas that require additional attention to ensure infants with hearing loss can reach their full potential.
Methods
To determine the percentage of infants screened for hearing loss, in receipt of a diagnostic audiologic evaluation, and enrolled in early intervention services, CDC analyzed 2009–2010 data from EHDI HSFS. Additional calculations were made to determine the percentage of infants screened before age 1 month, those who received a diagnostic evaluation before age 3 months, and enrolled in early intervention before age 6 months. Descriptive statistics for each year of data were generated using Microsoft Excel (Table 1). The percentage of infants screened for hearing loss was calculated by dividing the total number documented as screened for hearing loss by the total number of occurrent births in the same reporting year multiplied by 100. The percentage of infants screened before age 1 month was calculated by dividing the number screened before age 1 month by the total screened for hearing loss multiplied by 100. The percentage of infants diagnosed (i.e., hearing loss or no hearing loss) was calculated by dividing the total number identified with hearing loss plus the number reported with no diagnosed hearing loss divided by the total number failing the hearing screening multiplied by 100. The percentage of infants diagnosed before age 3 months was calculated by dividing the number identified with hearing loss before age 3 months plus the number reported with no diagnosed hearing loss before age 3 months divided by the total number diagnosed (i.e., hearing loss or no hearing loss) multiplied by 100. The percentage of infants lost to follow-up (LFU) / lost to documentation (LTD) was calculated by dividing the number unable to contact plus the number unresponsive plus the number unknown divided by the total number failing the hearing screening multiplied by 100. The percentage of infants enrolled in early intervention (of those with a diagnosed, permanent hearing loss) was calculated by dividing the total number enrolled in intervention divided by the total number diagnosed with a hearing loss multiplied by 100. The percentage of infants enrolled in early intervention before age 6 months was calculated by dividing the number of infants with hearing loss enrolled in intervention before age 6 months divided by the total number with hearing loss enrolled in intervention multiplied by 100.
To assess progress and highlight areas for continued improvement, CDC compared the 2009–2010 screening, diagnostic, and intervention data to the same data set for the combined period 2005–2006, which is the earliest information available through this CDC survey (Figure). Because of the incompleteness of data during 2005–2006, a similar comparison between the demographic data for 2009–2010 and 2005–2006 was not possible. For all comparisons, statistical significance was determined using a two-sided z test; differences were considered statistically significant at p<0.05.
The HSFS is an annual, online survey administered by CDC and sent to the EHDI Program Coordinator in each U.S. state, territory, freely associated state, and the District of Columbia. The survey requests aggregate, nonestimated information related to the receipt of hearing screening, diagnostic testing, and enrollment in early intervention for every occurrent birth within the jurisdiction. Infants were classified as LFU if they did not receive recommended follow-up services or LTD if they received services without the results being reported to the jurisdictional EHDI program. Cases where the infant died or the parents refused services were not classified as LFU/LTD. Although strategies used to target LFU and LTD differ, these two categories are grouped together because it is problematic for most programs to differentiate between infants who did not receive services and those whose receipt of services was not reported (14). The survey also requests demographic data, such as infant's sex, maternal age, education, race, and ethnicity, for infants who were screened, diagnosed, and enrolled in early intervention. After consultation with representatives from the jurisdictional EHDI program, data were excluded if found to be incomplete or derived from estimated information because the survey requires that only nonestimated data be reported.
The rules and regulations related to newborn hearing screening vary by jurisdiction and birthing facilities and providers might or might not be required to report screening and follow-up data to their EHDI program. As a result, some jurisdictions were either not able to respond to the HSFS or were only able to provide limited data (e.g., only screening data). In addition, some responses were excluded because the data were incomplete or estimated. This resulted in screening data being available from at least 48 jurisdictions for 2005 and 49 jurisdictions for 2006, which in the United States accounted for approximately 3,431,884 (83%) of births in 2005 and 3,288,626 (77%) of births in 2006. Screening data were available from at least 50 jurisdictions for 2009, which accounted for more than 4,018,885 (97%) of births in the United States (15). Demographic data about maternal age, education, and race for infants screened for hearing loss were available from at least 13 jurisdictions in 2009, which accounted for 699,637 (16.9%) of U.S. births. Screening data were available from at least 54 jurisdictions for 2010, which accounted for approximately 3,965,744 (99%) of U.S. births in 2010 (16). These same demographic data related to screening were available from at least 20 jurisdictions in 2010, which accounted for 947,831 (24%) of births (Table 2). Additional information about these data is available at www.cdc.gov/ncbddd/hearingloss/ehdi-data.html.
For the demographic data (Table 2), the percentage of infants diagnosed (i.e., hearing loss or no hearing loss) by maternal age was calculated by dividing the number identified with hearing loss plus the number reported with no diagnosed hearing loss (within each maternal age category) by the total number failing the hearing screening (within each maternal age category) multiplied by 100. The percentage of infants diagnosed (i.e., hearing loss or no hearing loss) by maternal education was calculated by dividing the number identified with hearing loss plus the number reported with no diagnosed hearing loss (within each maternal education category) by the total number failing the hearing screening (within each maternal education category) multiplied by 100. The percentage of infants diagnosed (i.e., hearing loss or no hearing loss) by maternal race/ethnicity was calculated by dividing the number identified with hearing loss plus the number reported with no diagnosed hearing loss (within each maternal race/ethnicity category) by the total number failing the hearing screening (within each maternal race/ethnicity category) multiplied by 100.
Results
During 2009–2010, a total of 7,796,448 (97.6%) of the approximately 8 million births in the jurisdictions responding to the HSFS were documented as having been screened for hearing loss. Of infants screened, 7,280,197 (93.4%) were screened before age 1 month. A total of 58,567 (50.3%) of infants that failed the final hearing screening were documented as receiving a diagnosis (i.e., hearing loss or no hearing loss). Of those diagnosed, 41,119 (70.2%) were diagnosed before age 3 months. Of the infants failing the hearing screening, 49,109 (42.1%) were not documented to have a diagnosis and were LFU/LTD. A total of 6,795 (67.0%) of the approximately 10,000 infants with a diagnosed permanent hearing loss were documented as being enrolled in early intervention. Of those infants receiving intervention, 4,433 (65.2%) were enrolled before age 6 months. During 2005–2006, a total of 6,361,179 (94.7%) of the approximately 6.7 million infants born in the jurisdictions responding to the survey were documented as having been screened for hearing loss. Of these infants screened, 5,177,583 (81.4%) of infants were screened before age 1 month. A total of 40,715 (31.9%) of infants who failed the final hearing screening were documented as receiving a diagnosis. Of those diagnosed, 19,937 (49.0%) were diagnosed before age 3 months. Of the infants failing the hearing screening, 70,600 (55.4%) were not documented to have a diagnosis and were LFU/LTD. A total of 3,225 (56.5%) of the approximately 6,000 infants with a diagnosed permanent hearing loss were documented as being enrolled in early intervention. Of infants receiving intervention, 1,841 (57.1%) were enrolled before age 6 months. The improvements in the screening, diagnosis, and early intervention rates in 2009–2010, compared with 2005–2006, were statistically significant (p<0.05 for all) (Table 1).
Although only a small number of jurisdictions were able to consistently provide complete demographic data, some trends are apparent. Data for 2009–2010 indicate that infants born to mothers aged 15–19 years are less likely to return for recommended follow-up services (43%) than infants born to mothers aged 35–50 years (59%). Infants born to mothers with less than a high school education were less likely to return for follow-up services than mothers with college degrees (45% vs. 71%). Additionally, some groups, such as Native Hawaiians and Pacific islanders (24%) and American Indians (15%), were less likely to return for follow-up services than Asians (57%), whites (57%), and blacks (44%) (Table 2). The differences within each demographic category were statistically significant (p< 0.05).
Discussion
Substantial progress has been made since 2005–2006 in identifying deaf and hard of hearing infants. This is reflected in the 2009–2010 data, which show that more infants received recommended screening, diagnostic, and early intervention services both overall and in accordance with the 1-3-6 benchmarks and the approximately 10,000 cases of hearing loss identified during this period. However, despite recent progress, approximately 49,000 (42.1%) U.S. infants were not documented as receiving recommended follow-up services after failing a screening, and therefore were classified as LFU/LTD. Although additional data are needed before conclusive opinions can be drawn, the 2009–2010 demographic data indicate that some groups (e.g., young mothers, certain racial groups, and mothers with low educational attainment) are more likely to have infants that become LFU/LTD.
Without the timely receipt of recommended follow-up services, the benefits of newborn hearing screening can be severely diminished. The importance of follow-up and early identification is underscored by research from England, which found that total education expenditures for children with hearing loss was 22% lower among those screened at birth than those who were not offered a newborn hearing screening (17,18). The progress made from 2005–2006 to 2009–2010 towards providing recommended services to infants occurred in conjunction with increased collaboration and adoption of evidence-based strategies by clinical care providers and EHDI programs. The successful implementation of these strategies and collaborations were the result of efforts by federal agencies (e.g., CDC, Health Resources and Services Administration (HRSA), and USPSTF), SACHDNC, jurisdictional EHDI programs, clinical service providers, families, and professional organizations (i.e., the American Academy of Audiology, the American Academy of Otolaryngology-Head and Neck Surgery, the American Academy of Pediatrics [AAP], and the American Speech-Language-Hearing Association).
To achieve further reductions in LFU/LTD, additional efforts are required so that providers can more efficiently coordinate and document the receipt of follow-up services. This can be achieved by improving existing clinical and public health infrastructures and leveraging opportunities in emerging areas, such as health information technology (HIT) (19). Standardization and adoption of HIT, including Electronic Health Records (EHR) and clinical decision support tools, can improve the exchange of clinical data between health-care providers and public health programs. This improved exchange of information can help increase awareness about the need for follow-up among all of a patient's providers and ensure that infants who are deaf and hard of hearing are identified as early as possible. The benefits of HIT are supported by findings that have shown EHR technology can improve the quality of care and assist providers in delivering services more efficiently when properly used. In addition, the efficacy of HIT in improving the efficiency of health care has been demonstrated (20,21,22).
Ongoing changes in the U.S. health-care system offer opportunities to improve the use of clinical preventive services among infants, children, and adolescents. The Patient Protection and Affordable Care Act of 2010 (as amended by the Health Care and Education Reconciliation Act of 2010 and referred to collectively as the Affordable Care Act [ACA]) expands insurance coverage, consumer protections, and access to care and places a greater emphasis on prevention (23). As of September 23, 2010, ACA § 1001 requires nongrandfathered private health plans to cover, with no cost-sharing, a collection of four types of clinical preventive services, including 1) recommended services of USPSTF graded A (strongly recommended) or B (recommended) (24); 2) vaccinations recommended by the Advisory Committee on Immunization Practices (25); 3) services adopted for infants, children, and adolescents under the Bright Futures guidelines supported by HRSA and AAP (26) and those developed by the Discretionary Advisory Committee on Heritable Disorders in Newborns and Children (27); and 4) women's preventive services as provided in comprehensive guidelines supported by HRSA (28). Hearing screening is recommended by USPSTF as a Grade B service for all newborn infants (3). The Bright Futures guidelines recommend hearing screening and appropriate follow-up for all infants at multiple points as the child ages (10,26). State Medicaid programs cover hearing screening, diagnosis, and intervention as part of the Early and Periodic Screening, Diagnostic and Treatment benefit.
The Health Insurance Marketplace (or Health Insurance Exchange) began providing access to private health insurance for small employers and to persons and families interested in exploring their options for coverage, with policies taking effect as early as January 2014.* Federal tax credits are available on a sliding scale to assist those living at 100%–400% of the federal poverty level who purchase health insurance through the Marketplace (ACA § 1401). Insurance plans sold on the Marketplace must cover the four types of recommended clinical preventive services without cost-sharing, including recommended hearing screening. Monitoring within the medical home and additional hearing screenings during early childhood and in school aged populations is recommended by JCIH and AAP. This is a result of the increasing prevalence of hearing loss throughout childhood from the additions of late‐onset, late identified, and acquired hearing loss (11,29).
Limitations
The findings in this report are subject to at least five limitations. First, some jurisdictions either did not respond to HSFS or were only able to provide limited data in one or more reporting years. This includes instances where some jurisdictions were either not able to report any demographic data or were only able to provide a few of the requested data items. As a result, differences existed in the number of jurisdictions reporting data in the periods 2005–2006 and 2009–2010. Second, although data collection is standardized across jurisdictions, HSFS data are voluntarily reported and subject to inaccuracies. Third, the data reported only reflect services that infants were documented to have received. Because the rules related to the reporting of newborn hearing screening, diagnostic, and intervention data vary by jurisdiction, the percentage of infants receiving recommended services might be higher than what is being reported. Fourth, information about the health insurance and socioeconomic status of families of infants is not available through HSFS. Therefore it is not possible to assess if and to what extent these factors contribute to LFU/LTD. Finally, the data from 2009–2010 are now more than 3 years old and do not reflect recent progress within jurisdictions.
Conclusion
The universal and timely provision of newborn hearing screening and recommended diagnostic and early intervention services makes it possible to assist infants who are deaf and hard of hearing to be identified early and able to reach their full potential. However, sustained efforts are needed to ensure infants receive recommended follow-up services. If available health information technologies are adopted by providers and public health programs, service coordination can improve between public health and early intervention providers, and implementation of health-care reform increases the number of infants with access to health care, there will be a substantial and lifelong effect on the outcome for all infants who are deaf and hard of hearing and their families in the U.S. population.
References
- Vohr B. Overview: infants and children with hearing loss—part I. Ment Retard Dev Disabil Res Rev 2003;9:62–4.
- Van Naarden Braun K, Yeargin-Allsopp M, Lollar D. Activity limitations among young adults with developmental disabilities: a population-based follow-up study. Res Dev Disabil 2009:179–91.Epub 2008.
- US Preventive Services Task Force. Universal screening for hearing loss in newborns: US Preventive Services Task Force recommendation statement. Pediatrics 2008;122:143–8.
- Brownson RC, Chriqui JF, Stamatakis KA. Understanding evidence-based public health policy. Am J Public Health 2009;99:1576–83.
- US Department of Health and Human Services. Healthy people 2020. Topics and objectives: hearing and other sensory or communication disorders. Washington, DC: US Department of Health and Human Services; 2013. Available at www.healthypeople.gov/2020/topicsobjectives2020/objectiveslist.aspx?topicId=20.
- National Quality Forum. Audiological evaluation no later than 3 months of age (EHDI-3), hearing screening prior to hospital discharge, newborn hearing screening, and outpatient hearing screening of infants who did not complete screening before hospital discharge (EHDI-1c). Washington, DC: National Committee for Quality Assurance; 2014. Available at http://www.qualityforum.org/Measures_Reports_Tools.aspx.
- Grosse SD. Education cost savings from early detection of hearing loss: new findings. Volta Voices 2007;14:38–40.
- Chambers J, Shkolnik J, Perez M. Total expenditures for students with disabilities, 1999–2000: spending variation by disability. Report. Special Education Expenditure Project (SEEP). Palo Alto, CA: American Institutes for Research in the Behavorial Sciences; 2003. Available at http://eric.ed.gov/?id=ED481398.
- Health Resources and Services Administration. Secretary's Advisory Committee on Heritable Disorders in Newborns and Children. Rockville, MD: US Department of Health and Human Services; 2013. Available at www.hrsa.gov/advisorycommittees/mchbadvisory/heritabledisorders/recommendedpanel/uniformscreeningpanel.pdf.
- Joint Committee on Infant Hearing. Year 2007 position statement: principles and guidelines for early hearing detection and intervention programs. Pediatrics 2007;120:898–921.
- CDC. Types of hearing loss. Atlanta, GA: CDC; 2011. Available at www.cdc.gov/NCBDDD/hearingloss/types.html.
- CDC. Treatment and intervention services. Atlanta, GA: CDC; 2012. Available at www.cdc.gov/ncbddd/hearingloss/treatment.html.
- Yeung LF, Shapira SK, Coates RJ, et al. Rationale for periodic reporting on the use of selected clinical preventive services to improve the health of infants, children, and adolescents—United States. In: Use of selected clinical preventive services to improve the health of infants, children, and adolescents—United States, 1999–2011. MMWR 2014;63(No. Suppl. 2).
- Mason CA, Gaffney M, Green DR, Grosse SD. Measures of follow-up in early hearing detection and intervention programs: a need for standardization. Am J Audiol 2008;17:60–7.
- National Vital Statistics Reports. Births: Final Data for 2010. Atlanta, GA: CDC; 2012. Available at www.cdc.gov/nchs/data/nvsr/nvsr61/nvsr61_01.pdf.
- National Vital Statistics System. Key birth statistics. Atlanta, GA: CDC; 2012. Available at www.cdc.gov/nchs/births.htm.
- Schroeder L, Petrou S, Kennedy C, et al. The economic costs of congenital bilateral permanent childhood hearing impairment. Pediatrics 2006;117:1101–12.
- Grosse SD, Ross DS. Cost savings from universal newborn hearing screening. Pediatrics 2006;118:844–5.
- Ross DS, Visser SN. Pediatric primary care physicians' practices regarding newborn hearing screening. J Prim Care Community Health 2012;
3:256–63. - Frieden TR, Mostashari F. Health care as if health mattered. JAMA 2008;299:950–2.
- Congressional Budget Office. 2008. Evidence on the costs and benefits of health information technology. Washington, DC: Congressional Budget Office; 2008. Available at http://www.cbo.gov/sites/default/files/cbofiles/ftpdocs/91xx/doc9168/05-20-healthit.pdf.
- Chaudhry B, Wang J, Wu S, et al. Systematic review: Impact of health information technology on quality, efficiency, and costs of medical care. Ann Intern Med 2006;144:742–52.
- Patient Protection and Affordable Care Act of 2010. Pub. L. No. 114-148 (March 23, 2010), as amended through May 1, 2010. Available at www.healthcare.gov/law/full/index.html.
- US Preventive Services Task Force. USPSTF A and B recommendations. Rockville, MD: USPSTF; 2014. Available at http://www.uspreventiveservicestaskforce.org/uspstf/uspsabrecs.htm.
- CDC. Vaccine recommendations of the Advisory Committee on Immunization Practices. Atlanta, GA: US Department of Health and Human Services, CDC. Available at http://www.cdc.gov/vaccines/hcp/acip-recs/index.html.
- American Academy of Pediatrics. Bright futures guidelines for health supervision of infants, children, and adolescents. Elk Grove Village, IL: AAP. Available at http://brightfutures.aap.org/pdfs/guidelines_pdf/13-rationale_and_evidence.pdf.
- US Department of Health and Human Services. Discretionary Advisory Committee on Heritable Disorders in Newborns and Children: about the committee. Rockville, MD: US Department of Health and Human Services; HRSA. Available at http://www.hrsa.gov/advisorycommittees/mchbadvisory/heritabledisorders/about/index.html.
- Health Resources and Services Administration. Women's preventive services guidelines. Rockville, MD: US Department of Health and Human Services; 2014. Available at http://www.hrsa.gov/womensguidelines/.
- American Academy of Pediatrics. Recommendations for preventive pediatric health care. Elk Grove Village, IL: AAP; 2008. Available at http://pediatrics.aappublications.org/content/suppl/2007/12/03/120.6.1376.DC1/Preventive_Health_Care_Chart.pdf.
* The Health Insurance Marketplace was set up to provide a state-based competitive insurance marketplace. The Marketplace allows eligible persons and small businesses with up to 50 employees (and increasing to 100 employees by 2016) to purchase health insurance plans that meet criteria outlined in ACA (ACA § 1311). If a state did not create a Marketplace, the federal government operates it.
FIGURE: Percentage of infants screened, diagnosed, and enrolled in early intervention — Hearing Screening and Follow-up Survey, United States, 2005–2006 and 2009–2010
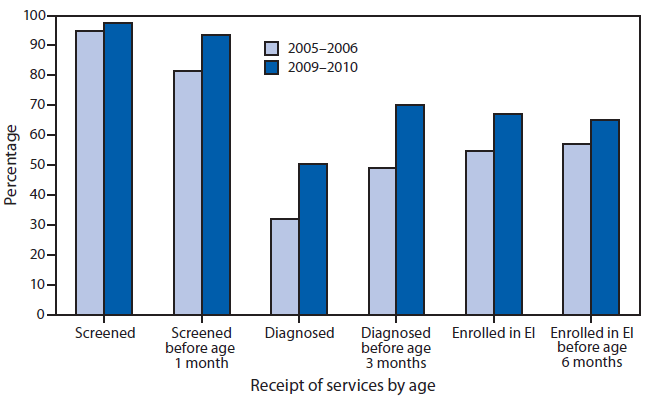
Abbreviation: EI = early intervention.
Alternate Text: This figure is a bar graph comparing the percentage of infants screened, diagnosed, and enrolled in early intervention during 2005-2006, and screened before age 1 month, diagnosed before age 3 months, and enrolled in early intervention during 2009-2010.
Use of trade names and commercial sources is for identification only and does not imply endorsement by the U.S. Department of
Health and Human Services.
References to non-CDC sites on the Internet are
provided as a service to MMWR readers and do not constitute or imply
endorsement of these organizations or their programs by CDC or the U.S.
Department of Health and Human Services. CDC is not responsible for the content
of pages found at these sites. URL addresses listed in MMWR were current as of
the date of publication.
All MMWR HTML versions of articles are electronic conversions from typeset documents.
This conversion might result in character translation or format errors in the HTML version.
Users are referred to the electronic PDF version (http://www.cdc.gov/mmwr)
and/or the original MMWR paper copy for printable versions of official text, figures, and tables.
An original paper copy of this issue can be obtained from the Superintendent of Documents, U.S.
Government Printing Office (GPO), Washington, DC 20402-9371;
telephone: (202) 512-1800. Contact GPO for current prices.
**Questions or messages regarding errors in formatting should be addressed to
mmwrq@cdc.gov.
