Outbreaks of Acute Gastroenteritis Transmitted by Person-to-Person Contact, Environmental Contamination, and Unknown Modes of Transmission — United States, 2009–2013
1Division of Viral Diseases, National Center for Immunization and Respiratory Diseases, CDC
2Division of Foodborne, Waterborne, and Environmental Diseases, National Center for Emerging and Zoonotic Infectious Diseases, CDC
Corresponding author: Mary Wikswo, Division of Viral Diseases, National Center for Immunization and Respiratory Diseases, CDC. Telephone: 404-639-0881; E-mail: ezq1@cdc.gov.
Abstract
Problem/Condition: Acute gastroenteritis (AGE) is a major cause of illness in the United States, with an estimated 179 million episodes annually. AGE outbreaks propagated through direct person-to-person contact, contaminated environmental surfaces, and unknown modes of transmission were not systematically captured at the national level before 2009 and thus were not well characterized.
Reporting Period: 2009–2013.
Description of System: The National Outbreak Reporting System (NORS) is a voluntary national reporting system that supports reporting of all waterborne and foodborne disease outbreaks and all AGE outbreaks resulting from transmission by contact with contaminated environmental sources, infected persons or animals, or unknown modes. Local, state, and territorial public health agencies within the 50 U.S. states, the District of Columbia (DC), five U.S. territories, and three Freely Associated States report outbreaks to CDC via NORS using a standard online data entry system.
Results: A total of 10,756 AGE outbreaks occurred during 2009–2013, for which the primary mode of transmission occurred through person-to-person contact, environmental contamination, and unknown modes of transmission. NORS received reports from public health agencies in 50 U.S. states, DC, and Puerto Rico. These outbreaks resulted in 356,532 reported illnesses, 5,394 hospitalizations, and 459 deaths. The median outbreak reporting rate for all sites in a given year increased from 2.7 outbreaks per million population in 2009 to 11.8 outbreaks in 2013. The etiology was unknown in 31% (N = 3,326) of outbreaks. Of the 7,430 outbreaks with a suspected or confirmed etiology reported, norovirus was the most common, reported in 6,223 (84%) of these outbreaks. Other reported suspected or confirmed etiologies included Shigella (n = 332) and Salmonella (n = 320). Outbreaks were more frequent during the winter, with 5,716 (53%) outbreaks occurring during December–February, and 70% of the 7,001 outbreaks with a reported setting of exposure occurred in long-term–care facilities (n = 4,894). In contrast, 59% (n = 143) of shigellosis outbreaks, 36% (n = 30) of salmonellosis outbreaks, and 32% (n = 84) of other or multiple etiology outbreaks were identified in child care facilities.
Interpretation: NORS is the first U.S. surveillance system that provides national data on AGE outbreaks spread through person-to-person contact, environmental contamination, and unknown modes of transmission. The increase in reporting rates during 2009–2013 indicates that reporting to NORS improved notably in the 5 years since its inception. Norovirus is the most commonly reported cause of these outbreaks and, on the basis of epidemiologic data, might account for a substantial proportion of outbreaks without a reported etiology. During 2009–2013, norovirus accounted for most deaths and health care visits in AGE outbreaks spread through person-to-person contact, environmental contamination, and unknown modes of transmission.
Public Health Action: Recommendations for prevention and control of AGE outbreaks transmitted through person-to-person contact, environmental contamination, and unknown modes of transmission depend primarily on appropriate hand hygiene, environmental disinfection, and isolation of ill persons. NORS surveillance data can help identify priority targets for the development of future control strategies, including hygiene interventions and vaccines, and help monitor the frequency and severity of AGE outbreaks in the United States. Ongoing study of these AGE outbreaks can provide a better understanding of certain pathogens and their modes of transmission. For example, certain reported outbreak etiologies (e.g., Salmonella) are considered primarily foodborne pathogens but can be transmitted through multiple routes. Similarly, further examination of outbreaks of unknown etiology could help identify barriers to making an etiologic determination, to analyze clinical and epidemiologic clues suggestive of a probable etiology, and to discover new and emerging etiologic agents. Outbreak reporting to NORS has improved substantially since its inception, and further outreach efforts and system improvements might facilitate additional increases in the number and completeness of reports to NORS.
Introduction
Acute gastroenteritis (AGE) is a major cause of illness in the United States, with an estimated 179 million episodes annually (1). Until 2009, national surveillance for AGE outbreaks in the United States was limited to foodborne or waterborne disease outbreaks. AGE outbreaks propagated through direct person-to-person contact, contaminated environmental surfaces, and unknown modes of transmission were not systematically captured at the national level and thus were not well characterized. To better understand the characteristics of epidemic gastroenteritis, CDC launched the National Outbreak Reporting System (NORS) in 2009. NORS supports reporting of all waterborne and foodborne disease outbreaks and all AGE outbreaks resulting from transmission by contact with contaminated environmental sources, infected persons or animals, or unknown modes.
The information collected through NORS can help guide the development of appropriate strategies to prevent and control AGE outbreaks. This information is vital to improving understanding of these outbreaks, their frequency, and population-level risk factors for severe illness and death. To characterize the frequency and characteristics of AGE outbreaks transmitted through person-to-person contact, environmental contamination other than food and water, and unknown modes of transmission, CDC analyzed 2009–2013 outbreak data from NORS. This report summarizes those findings and is intended for use by health departments and regulatory agencies to identify settings and populations for interventions likely to yield the greatest public health benefits.
Methods
Data Source
NORS is a voluntary national reporting system. Local, state, and territorial public health agencies report outbreaks to CDC via NORS using a standard online data entry system. The NORS data entry system was launched in February 2009 to 59 reporting sites, comprised of the 50 U.S. states, the District of Columbia (DC), five U.S. territories (American Samoa, Guam, the Commonwealth of the Northern Mariana Islands, Puerto Rico, and the U.S. Virgin Islands), and three Freely Associated States (the Federated States of Micronesia, the Republic of the Marshall Islands, and the Republic of Palau). Sites were encouraged to report outbreaks occurring since January 1, 2009 as well as those occurring prospectively. AGE outbreaks reported in NORS in which the primary mode of transmission was person-to-person contact, environmental contamination, or unknown, with a first illness onset during January 2009–December 2013 and marked as finalized by a state administrator are included in this summary. Data were extracted from NORS on June 10, 2015.
Case Definitions and Classification
An outbreak is defined as ≥2 cases of a similar AGE illness associated with a common exposure. Only outbreaks that were identified as being spread by person-to-person contact, contaminated environmental surfaces, and unknown modes of transmission are included in this report. The initial or source case of each person-to-person outbreak, defined as the patient with the earliest reported illness onset, is included among the outbreak-associated cases. All cases included in each NORS report were assumed to have met the case definition used for that outbreak investigation. Cases and modes of transmission were classified as primary when associated with the initial or largest outbreak cluster, as determined during the outbreak investigation. Secondary modes of transmission were classified as those modes suspected of contributing to the outbreak spread but to a lesser degree than the primary mode of transmission. Standardized guidance documents are provided to reporting sites to promote consistency (2), although case definitions or classification schemes might differ across sites. The following outbreaks were excluded from analysis: all outbreaks in which the total number of cases was not entered, the total number of primary cases was <2, the reported etiology does not cause AGE (e.g., measles, Hepatitis A), and outbreaks with a primary mode of transmission other than person-to-person contact, contaminated environmental surfaces, and unknown (i.e., foodborne, waterborne, or animal contact). However, outbreaks with secondary transmission by foodborne, waterborne, and/or animal contact were included.
The date of first illness onset is defined in NORS as the date of outbreak occurrence. Data are reported on general outbreak characteristics (e.g., dates, number of illnesses, and locations), general demographic characteristics of cases (e.g., age and sex), symptoms, clinical outcomes, and laboratory testing information and results. NORS permits reporting of aggregated numbers of patients who were hospitalized, sought care in an emergency department, or sought any other type of health care during each outbreak; however, because overlap between these numbers cannot be ascertained, classification within these categories are not mutually exclusive. A reported etiology is considered "confirmed" if ≥2 laboratory confirmed cases were reported, which is consistent with CDC guidelines for confirmation of etiologies in foodborne disease outbreaks (3). If a reported etiology was associated with <2 laboratory confirmed cases, or designated solely on the basis of clinical or epidemiologic criteria, it was classified as a suspected outbreak etiology.
For this analysis, the etiology of each outbreak was categorized as norovirus, Shigella, or Salmonella, if one of those was the only suspected or confirmed etiology reported. These included outbreaks in which multiple genotypes or serotypes were reported. If any other suspected or confirmed etiology was reported or multiple etiologies were reported, the outbreak etiology was categorized as other/multiple; if no etiology was reported, etiology was categorized as unknown. Unless otherwise specified, outbreaks reported in which the primary mode of transmission was environmental contamination or person-to-person contact were combined for analysis. Data were combined because of the comparatively low number of environmental contamination reports and to distinguish outbreaks with known transmission modes from those with unknown modes. NORS allows reporting sites to edit, add, or delete reports at any time. Only reports marked as "finalized" by the reporting site administrators were included in the analyses. Report data are also subjected to basic logic checks by CDC at the conclusion of each calendar year to improve data quality and completeness.
Until August 2013, the setting of exposure and attack rate data were not captured for environmental contamination or unknown mode of transmission outbreaks. Reporting sites were encouraged to retrospectively add these data when that information was available. Attack rates were calculated by dividing the number of ill persons by the number of persons exposed. To calculate attack rates, states were asked to classify cases into two groups: residents or guests, and staff. The former group is intended to capture the number of persons who did not work in the setting of exposure (e.g., children attending child care facilities, residents of a long-term–care facility [LTCF], or guests of a hotel). The latter group is intended to capture the number of persons who work in those settings (e.g., health care providers, teachers, child care facility employees, and hotel staff).
Analysis
The outbreak reporting rate in each reporting site was calculated using the mean of the population estimates from the U.S. Census Bureau during 2009–2013 for each reporting site and expressed per 1 million population per year (4,5). Reporting rate quartiles were calculated and used to categorize the reporting sites (Figure 1). The number of outbreaks each state reported during 2009–2013 was averaged over the 5 years to calculate the AGE outbreak reporting rate per 1 million population per year.
During 2009–2010, NORS only allowed reporting of the percentage of the number of cases in each age and sex category. For those outbreaks in which only the percentage in each age group or sex was entered, numbers of cases were approximated by multiplying the percentages by the total number of primary cases for each outbreak. The category "unknown" is included in the analyses of age and sex distribution because states were allowed to enter the percentage of cases that were of unknown age or sex as part of the total. Only outbreaks with known age or sex for at least one case were included in each analysis; reports in which age or sex data were not entered, were entered only as "unknown", or percentages did not add to 100 (+/- 1% to account for rounding errors) were excluded from those analyses.
Comparisons of the proportion of cases with specific symptoms and outcomes by etiology were performed using Pearson's chi square test. Comparisons of the median attack rates between the staff and guest or resident groups and of the median number of cases and median attack rates reported in outbreaks with different etiologies were performed between each pair of etiologies using the Wilcoxon rank-sum test. All analyses were performed using statistical software. Significance was determined by p<0.05 for all analyses.
Results
Reporting Sites
During 2009–2013, a total of 10,884 AGE outbreaks in which transmission occurred through person-to-person contact, environmental contamination, and unknown mode of transmission were reported to CDC through NORS as of June 10, 2015. A total of 10,756 outbreak reports were marked as finalized by a state administrator and met the inclusion criteria and thus were included in the analysis. Of these, 9,148 (85%) outbreaks had a primary transmission mode of person-to-person contact, 1,563 (15%) had an unknown mode of transmission, and 45 (0.4%) were spread by contact with contaminated environmental surfaces. A total of 1,118 (10%) outbreaks reported at least one secondary mode of transmission. Person-to-person contact was the most commonly reported secondary mode of transmission (775 [7%] outbreaks), followed by unknown modes (278 [3%] outbreaks), foodborne transmission (23 [2%] outbreaks), and environmental contamination (15 [1%] outbreaks).
These outbreaks were reported by 52 reporting sites, including all 50 states, DC, and Puerto Rico (Figure 1). Four U.S. territories (American Samoa, Guam, the Commonwealth of the Northern Mariana Islands, and the U.S. Virgin Islands) and three Freely Associated States (the Federated States of Micronesia, the Republic of the Marshall Islands, and the Republic of Palau) reported no AGE outbreaks with primary transmission through person-to-person contact, environmental contamination, or unknown mode of transmission during 2009–2013. One multistate outbreak of Salmonella serotype Typhimurium spread by environmental contamination, which began in 2010 and affected cases in 38 U.S. states, was not attributed to a single state's reporting numbers.
Of the 52 reporting sites with at least one finalized report of an AGE outbreak primarily transmitted through person-to-person contact, environmental contamination, and unknown mode of transmission, 46 either began entering data in 2009 (the year NORS launched) or reported these outbreaks retrospectively. Four additional sites began reporting these outbreaks beginning in 2010, and one additional site began reporting outbreaks in each year during 2011 and 2012. Nine sites that began reporting in 2009 (range: 1–15 outbreaks per site) did not report any outbreaks during at least one calendar year during 2010–2013. Of the 52 reporting sites, four reported <10 outbreaks each, 24 reported 10–99 outbreaks each, and 24 reported >100 outbreaks each. The median outbreak reporting rate across all 52 sites was 7.5 outbreaks per million population per year (range: 0.03–49.1) (Figure 1).
Temporal Trends
From 2009 to 2013, the annual number of AGE outbreaks primarily transmitted through person-to-person contact, environmental contamination, and unknown mode of transmission reported to NORS nearly doubled. A total of 10,756 outbreaks were reported to NORS during the 5-year period (Figure 2). The number of outbreaks reported each year increased from 1,427 reports in 2009 to 2,699 in 2013. The number of reports increased regardless of mode of transmission or reported etiology. The median outbreak reporting rate for all sites improved from 2.7 outbreaks per million population in 2009 to 11.8 outbreaks per million population in 2013. Additionally, although 45 sites began reporting these outbreaks to NORS in 2009, only 33 sites reported at least one outbreak per million population that year. During 2013, the number of sites reporting at least one outbreak per million population had increased to 43 sites.
Etiologies
Of the 10,756 AGE outbreaks primarily transmitted through person-to-person contact, environmental contamination, and unknown mode of transmission, 7,370 (69%) had a single suspected or confirmed etiology, 3,326 (31%) had an unknown etiology, and 60 (<1%) had multiple etiologies (Table 1) (Figure 3). Norovirus was the only suspected or confirmed etiology reported in 62% (n = 5,720) of 9,193 outbreaks transmitted through person-to-person contact and environmental contamination, and 32% (n = 503) of 1,563 outbreaks with unknown mode of transmission. Shigella was the second most commonly reported etiology, reported in 3% (n = 292) of 9,193 outbreaks transmitted through person-to-person contact or environmental contamination and 3% (n = 40) of 1,563 outbreaks with unknown transmission mode. Salmonella was also commonly reported in outbreaks with unknown transmission mode, with 202 (13%) outbreaks reported; however, in outbreaks transmitted through person-to-person contact or environmental contamination, Salmonella was reported in only 1% (n = 118) of 9,193 outbreaks. A total of 555 (5%) of all 10,756 outbreaks reported another suspected or confirmed etiology (Table 1).
Of the 7,430 outbreaks with at least one reported etiology, 4,112 (55%) reported at least one laboratory-confirmed etiology and 3,318 (45%) outbreaks reported only a suspected etiology. Of the 4,112 outbreaks with at least one laboratory-confirmed etiology, norovirus was the most common etiology, reported in 86% (n = 2,888) of 3,362 outbreaks transmitted through person-to-person contact or environmental contamination and 44% (n = 327) of 750 of those outbreaks with unknown transmission mode (Figure 4). Shigella was the second most commonly reported etiology, reported in 8% (n = 265) of outbreaks transmitted through person-to-person contact or environmental contamination and 5% (n = 36) of those with unknown transmission mode, followed by Salmonella, reported in 2% (n = 64) of outbreaks transmitted through person-to-person contact or environmental contamination and 25% (n = 187) of those with unknown transmission. A total of 345 (8%) of 4,112 outbreaks reported another laboratory-confirmed etiology (Table 1).
Seasonality
Outbreaks were more frequent during the winter as 5,716 (53%) of the 10,756 outbreaks occurred during December–February (Figure 5). This pattern can be primarily attributed to suspected and confirmed norovirus outbreaks, of which 59% occurred during December–February. Approximately 54% of outbreaks with unknown etiology also occurred during these winter months. In contrast, outbreaks caused by other suspected or confirmed etiologies occurred less frequently in the winter. Only 16% of suspected or confirmed salmonellosis outbreaks, 18% of suspected or confirmed shigellosis outbreaks, and 21% of outbreaks of another or multiple etiologies occurred during December–February.
Settings
Of the 7,001 outbreaks that included information on setting, the most common settings reported were LTCFs (70%), schools (8%), child care facilities (7%), and hospitals (4%) (Table 2). Outbreaks suspected or confirmed to be caused by norovirus or an unknown etiology most often occurred in LTCFs (78% and 71% of outbreaks, respectively). Shigella, Salmonella, and other etiology outbreaks were most often identified in child care facilities, in 59%, 36%, and 32% of outbreaks, respectively. Overall, other reported settings (9%) included restaurants (n = 140), other health care facilities (n = 124), camps (n = 64), events or receptions (n = 36), community-wide (n = 35), offices or indoor workplaces (n = 34), hotels or resorts (n = 30), prisons or jails (n = 29), group homes or shelters (n = 23), sporting events or facilities (n = 18), adult day care facilities (n = 16), religious facilities (n = 14), tour groups (n = 14), banquet facilities or caterers (n = 9), military bases or academies (n = 8), ships (n = 4), fairs/festivals/mobile settings (n = 3), parks (n = 3), sex offender programs (n = 3), youth centers (n = 3), institutions (n = 2), apple orchard (n = 1), bowling alley (n = 1), farm (n = 1), fire station (n = 1), harbor (n = 1), livestock arena (n = 1), "multiple" (n = 1), parking structure (n = 1), rustic cabin (n = 1), and untreated recreational water/beach (n = 1).
Outbreak-Associated Cases
Among the 10,756 AGE outbreaks reported, 356,532 cases were identified, with a median of 22 cases per outbreak (mean: 33; range: 2–2,500) (Table 3). The median number of cases per outbreak was significantly higher (p<0.0001) for suspected or confirmed norovirus outbreaks (29 cases) than for outbreaks caused by Shigella (seven cases), Salmonella (three cases), multiple or other etiologies (four cases), or an unknown etiology (18.5 cases).
Among the 6,099 outbreaks with information on distribution of cases by sex, 66% of cases occurred in females (Figure 6). Of the 3,421 outbreaks with a suspected or confirmed etiology of norovirus and the 1,658 outbreaks of unknown etiology, 67% and 66% of cases occurred among females, respectively. The proportion of cases among females in outbreaks of salmonellosis (N = 261 outbreaks), shigellosis (N = 317 outbreaks), and multiple or other etiologies (N = 442 outbreaks) was 48%, 53%, and 57%, respectively.
Among the 5,405 outbreaks with information on age distribution of cases, 12% of cases occurred in children aged <10 years, 21% of cases occurred in adolescents and adults aged 10–49 years, 49% of cases occurred in adults aged >49 years, and 18% of cases were of unknown age (Figure 7). Cases in norovirus outbreaks (N = 2,985 outbreaks) and outbreaks with unknown etiology (N = 1,416 outbreaks) were most often adults aged >49 years (53% and 51% of cases, respectively). Cases in shigellosis outbreaks (N = 317 outbreaks) or outbreaks caused by other/multiple etiologies (N = 430 outbreaks) were more often children aged <10 years (64% and 41% of cases, respectively). In the 257 salmonellosis outbreaks, 45% of cases were adolescents and adults aged 10–49 years.
Symptoms and Clinical Outcomes
Information on the proportion of cases reported with at least one symptom was available for 7,855 (73%) outbreaks, although information on each of the four major AGE symptoms analyzed in this report was not provided for all cases or all outbreaks (Figure 8). Among patients for whom symptom information was reported, diarrhea and vomiting were the most common symptoms (80% of 197,037 cases and 67% of 193,099 cases, respectively). Outbreaks suspected or confirmed to be caused by norovirus or an unknown etiology reported vomiting in a significantly higher percentage of cases (68% and 71%, respectively) than in outbreaks caused by Salmonella (39%), Shigella (37%), or another etiology (45%) (p<0.05, all comparisons). Fever and bloody stools were each reported significantly more often in outbreaks caused by Salmonella (58% and 28%, respectively) and Shigella (58% and 25%, respectively) than in outbreaks caused by norovirus (18% and 1%, respectively), another etiology (17% and 8%, respectively), or an unknown etiology (21% and 2%, respectively) (p<0.05, all comparisons).
During 2009–2013, a total of 459 deaths were reported among 7,692 outbreaks and 242,593 cases with information on death, and 5,394 hospitalizations were reported among 7,453 outbreaks and 229,372 cases with information on hospitalizations (Table 4). Of the 340 outbreaks with an associated death, 269 (79%) occurred in an LTCF, eight (2%) in a hospital, five (1%) in another health care facility, and 1 (<1%) each in a child care facility, restaurant, and a school; 55 (16%) did not provide information on setting. Norovirus was identified as the suspected or confirmed etiology in 267 (79%) of the 340 outbreaks with an associated death, accounting for 375 (82%) deaths. Six (1%) deaths were associated with six confirmed outbreaks of Salmonella enterica, four (1%) deaths were associated with four outbreaks of Clostridium spp., three (1%) deaths were associated with three outbreaks of STEC infections, and one outbreak each caused by Cryptosporidium sp., rotavirus, Shigella flexneri, rotavirus and norovirus, and adenovirus, Clostridium difficile, and norovirus were associated with one (<1%) death each. No etiology was reported in 54 (16%) outbreaks associated with 65 (14%) deaths.
Patients in outbreaks caused by Salmonella or Shigella were significantly more likely to be hospitalized, visit the emergency department, or seek any other form of health care than patients associated with norovirus outbreaks (p<0.0001, all comparisons); however, norovirus outbreaks contributed to the largest number of deaths and health care visits.
Attack Rates
Data were collected on the total number of persons exposed, categorized as either guests/residents or staff, thereby allowing for calculation of attack rates (Table 5). The median attack rate for guests/residents was highest in salmonellosis outbreaks (40.5%); this was significantly higher than the median guest/resident attack rates in shigellosis outbreaks (12.5%) and those of unknown etiology (22%) (p<0.0001 and p<0.0005, respectively). The median attack rate for guests and residents was significantly lowest in shigellosis outbreaks (12.5%) compared with outbreaks from any other etiology or unknown etiology (p<0.0001 for all comparisons). The median staff attack rate for outbreaks of norovirus (15%) was significantly higher than the median staff attack rate in outbreaks of Salmonella (0%) and Shigella (5%) (both p<0.0001). For each outbreak etiology, the median attack rates were significantly higher among guests and residents than among staff (p<0.0001, all comparisons).
Discussion
NORS is the first U.S. surveillance system that provides national data on AGE outbreaks spread through person-to-person contact, environmental contamination, and unknown modes of transmission. During 2009–2013, a total of 356,532 outbreak-related illnesses from 10,756 such AGE outbreaks were reported to NORS by 52 reporting sites. Of these, 9,193 outbreaks and 328,824 cases were associated with person-to-person contact and environmental contamination, and 1,563 outbreaks and 27,708 cases were associated with an unknown mode of transmission. In comparison, 3,967 outbreaks with primary foodborne transmission and 269 outbreaks with primary waterborne transmission were reported to NORS during 2009–2013 (6–8). Therefore person-to-person contact and environmental contamination accounted for 61% of all outbreaks reported to NORS during 2009–2013.
The number of reported AGE outbreaks transmitted through person-to-person contact, environmental contamination, and unknown mode of transmission reported to NORS each year nearly doubled from 2009 to 2013. In 2009, the median outbreak reporting rate was 2.7 outbreaks per million population, with 33 reporting sites reporting at least one outbreak per million population. By 2013, the median outbreak reporting rate had increased to 11.8 outbreaks per million population, with 43 reporting sites reporting at least one outbreak per million population. The increase in reporting occurred for all modes of transmission and all etiologies, indicating that reporting to NORS notably improved in the 5 years since its inception. This is likely, in part, because of considerable outreach efforts to reporting sites and various system improvements, including interface design and a new feature that allows states to upload bulk data from existing state databases into NORS rather than manually reentering those data (9). Further outreach efforts and system improvements might facilitate additional increases in the number and completeness of reports to NORS.
Norovirus was the most frequently reported cause of AGE outbreaks transmitted through person-to-person contact, environmental contamination, and unknown modes of transmission. Norovirus was also reported as the sole suspected or confirmed etiology more often in outbreaks transmitted through person-to-person contact or environmental contamination than in outbreaks transmitted through unknown modes of transmission. The data in this report are consistent with other studies indicating that norovirus is the leading cause of AGE outbreaks and that person-to-person transmission is the most common mode of transmission (10–12). Consistent with previous reports (10,11,13–16), LTCFs were the most frequent setting of norovirus outbreaks, which might partially explain the predominance of norovirus outbreak-associated cases among females and older adults. A 2013 report by the National Center for Health Care Statistics indicated that approximately 70% of nursing home and residential community care patients were female (17), which is similar to the proportion of females in norovirus outbreaks reported in NORS. However, among the 2,985 norovirus outbreaks that include information on age of cases, only 53% of cases occurred among persons aged >49 years. This might be explained, in part, by outbreaks in which not all ages of cases were known; age was unknown in 21% of cases in norovirus outbreaks for which at least some age information was provided for the outbreak report. In addition, information on patient age was reported in only 48% of norovirus outbreaks reported, possibly introducing some bias. LTCF outbreaks also included cases among staff members, which might have shifted the age of cases downward relative to the age of the resident populations. The majority of nursing home staff, similar to their residents, are female; thus, the percentage reported as female in outbreaks reported to NORS would not be expected to change because of the inclusion of staff cases (18).
The predominance of norovirus among AGE outbreaks demonstrated in this report is reflected by its leading role in causing sporadic disease. In the United States, an estimated 19–21 million illnesses, 56,000–71,000 hospitalizations, and 570–800 deaths are caused by norovirus annually (19). Adults aged ≥65 years and children aged <5 years have the highest rates of norovirus-associated deaths and health care visits, respectively (19). No specific treatment exists for norovirus illness, so patient management is focused on supportive care, primarily oral or intravenous rehydration therapy. However, multiple candidate norovirus vaccines are undergoing development and testing (20,21). Data from NORS can be used in conjunction with other studies and surveillance systems to identify potential targets for hygiene interventions and norovirus vaccines (e.g., residents in LTCFs).
The median attack rate reported for guests or residents was significantly higher in suspected and confirmed norovirus or salmonellosis outbreaks than for suspected and confirmed shigellosis outbreaks; however, the attack rates for shigellosis outbreaks in NORS are substantially lower than other published estimates (22,23). Shigellosis attack rates might be underestimated in NORS because of the difficulties in determining the number of exposed persons in child care facilities and schools, where 76% of shigellosis outbreaks were reported to have occurred; the number of exposed persons in LTCFs and private homes, where most norovirus and many salmonellosis outbreaks occurred, might be more easily defined. The high norovirus and salmonellosis attack rates are consistent with other attack rates reported in the literature (15,24–26). Salmonellosis outbreaks had the lowest median attack rate among staff, though fewer such outbreaks (N = 21) were reported, which might have led to skewed data. The consistently lower attack rates among staff compared with guests and residents might result from certain factors, such as better hand hygiene practices, immunity acquired from more frequent exposures to these pathogens from working in a high-risk setting (27,28), reluctance to report illness (29,30), or, in certain settings (e.g., LTCFs) staff members who are younger or typically healthier than their residents and therefore less likely to experience symptomatic or severe disease (10,26,31–34).
Although norovirus, Salmonella, and nondysenteriae Shigella infections often result in mild, self-limiting illness, infections in elderly, very young, and immunocompromised populations can be severe, resulting in hospitalization and death (26,31–36). The overall percentages of hospitalized patients and patients who died for reported norovirus and salmonellosis outbreaks are consistent with other studies (14,15,25,26,37,38). The reported percentage of hospitalized patients for shigellosis outbreaks (6%) was substantially lower than previous estimates (20%); nonetheless, shigellosis outbreaks resulted in approximately 600 emergency department visits and hospitalizations during this period (39). The reported percentages of hospitalized patients and patients who died were highest in salmonellosis outbreaks. However, salmonellosis outbreaks accounted for only 320 (3%) of all outbreaks transmitted through person-to-person contact, environmental contamination, and unknown mode of transmission. Although hospitalizations and deaths represented a much smaller fraction of norovirus outbreak-associated cases, the high frequency of these outbreaks resulted in most of the reported deaths and hospitalizations during 2009–2013.
Patients involved in shigellosis and salmonellosis outbreaks were more likely to report fever and bloody stools and substantially more likely to seek health care, including hospitalization or emergency care, than those in norovirus outbreaks. Although recommended only for severe illness, antimicrobial medications are commonly used to treat shigellosis patients (40,41). Multidrug resistance is common among Salmonella and Shigella bacteria, which might lead to increased costs, morbidity, and mortality (42–46). In addition, many states require ≥1 negative convalescent stool cultures before workers with shigellosis can resume handling food or providing patient care or child care and before children can return to child care settings or schools. This process might take weeks, result in excessive days of work lost, and propagate outbreaks by encouraging families to enroll convalescing children in new child care settings (40).
As previously reported (15), AGE outbreaks of unknown etiology reported through NORS in this surveillance period had epidemiologic characteristics consistent with norovirus outbreaks. Norovirus outbreaks tend to peak in winter months, whereas most enteric bacterial outbreaks predominate in summer (11,47–50). Both the confirmed and suspected norovirus outbreaks and outbreaks of unknown etiology reported through NORS exhibited a strong winter seasonality, whereas outbreaks caused by Salmonella, Shigella, or another etiology demonstrated slight peaks in the spring and summer months. Norovirus outbreaks and those of unknown etiology also exhibited similarly high frequencies of diarrhea and vomiting and relatively low frequencies of fever and bloody stools. A high proportion of patients with vomiting (≥50%) and a relatively low proportion with fever are characteristics that have been previously demonstrated as helpful in differentiating norovirus outbreaks from AGE outbreaks caused by other etiologies (51,52). Other characteristics common among norovirus outbreaks and those of unknown etiology reported through NORS included a higher frequency of cases among older adults and females, a high number of cases in LTCFs, and similarly low percentages of hospitalized patients and deaths. These findings indicate that many of the outbreaks of unknown etiology reported here might have been caused by norovirus.
Although norovirus accounted for most reported outbreaks transmitted through person-to-person contact, environmental contamination, and unknown modes of transmission, Shigella and Salmonella also were identified as major contributors. However, these findings likely vastly underrepresent the prevalence of shigellosis outbreaks in the United States. During 2009–2012, a total of 59,000 confirmed or probable cases of shigellosis were reported to the National Notifiable Diseases Surveillance System (53). Approximately 50% of shigellosis illnesses result from outbreaks transmitted from person-to-person contact within the United States, which suggests that the number of shigellosis cases and outbreaks in this analysis is underestimated fivefold (39). Similar to norovirus, Shigella has a low infectious dose and is commonly transmitted person-to-person (54–56). However, whereas most norovirus outbreaks occur in LTCFs, Shigella most frequently causes AGE outbreaks in child care facilities, schools, and communities (57).
During 2009–2013, Salmonella was the third most commonly reported etiology in outbreaks transmitted through person-to-person contact, environmental contamination, and unknown modes of transmission in NORS. Salmonella is the leading bacterial cause of foodborne disease outbreaks in the United States and is estimated to cause approximately 1 million epidemic and sporadic illnesses annually (37,39). Although less commonly reported, Salmonella also can be transmitted by person-to-person contact or fomites (36,58). The incidence of Salmonella infection is highest in children aged <5 years, although salmonellosis is also common among adolescents, adults, and the elderly (37). Cases in person-to-person, environmental contamination, and unknown mode of transmission Salmonella outbreaks reported to NORS were more often adolescents and adults aged 10–49 years rather than children aged <10 years. This might be, in part, because of some inherent differences in foodborne and nonfoodborne Salmonella outbreaks (e.g., setting of exposure or serotype). Although the most common setting reported in Salmonella outbreaks included in this analysis was child care facilities, these represented only 36% of the Salmonella outbreaks with a reported setting. Other common settings included LTCFs, in which most, if not all, cases are adults.
Some etiologies in outbreaks transmitted through person-to-person contact, environmental contamination, and unknown modes of transmission and reported to NORS are primarily considered foodborne pathogens (e.g., Salmonella and STEC); before 2009, national outbreak surveillance systematically captured only foodborne and waterborne outbreaks of these pathogens. Although foodborne outbreaks of these pathogens remain a critical and substantial cause of morbidity and mortality in the United States (11,59), surveillance for AGE outbreaks transmitted through person-to-person contact, environmental contamination, and unknown modes of transmission is also vital to forming a more complete understanding of outbreaks caused by these pathogens. During 2009–2013, a total of 320 salmonellosis outbreaks and 142 outbreaks of STEC infections spread by person-to-person, environmental contamination, and unknown modes of transmission were reported to NORS, which included nine deaths. In comparison, during 2009–2013, a total of 636 foodborne outbreaks of salmonellosis and 143 foodborne outbreaks of STEC infections were reported, including 30 deaths (8).
The primary differences between outbreaks transmitted through person-to-person contact and environmental contamination versus an unknown mode of transmission likely stem from reported etiologies of those outbreaks. The proportion of outbreaks reported with an unknown etiology was similar among outbreaks transmitted through person-to-person contact and environmental contamination (30%) and unknown mode of transmission (36%). However, although norovirus was common in both types of outbreaks, a much larger proportion of outbreaks with unknown mode of transmission reported Salmonella (13%) or multiple or other etiologies (16%). Sites reporting a salmonellosis outbreak without an identified food vehicle or a food-related setting (e.g., restaurant) might have been hesitant to declare a foodborne outbreak, instead opting to report the transmission mode as unknown. This scenario also might occur with other etiologies considered to be primarily foodborne pathogens (e.g., STEC and Campylobacter).
Very few (N = 45) outbreaks transmitted through environmental contamination were reported to NORS during 2009–2013, possibly because of the difficulty in distinguishing between environmental contamination and person-to-person spread in most settings and because outbreaks often involve both modes of transmission. Consistent with guidance provided to NORS users (2), reporting sites might be hesitant to report outbreaks with a mode of transmission of environmental contamination without clear evidence that it was the sole or predominant mode of transmission. Additionally, the definition of "environmental contamination" as a mode of transmission might be unclear to sites because it was also only reported as a secondary mode of transmission in 15 (1%) outbreaks.
Limitations
The findings in this report are subject to at least two limitations. First, similar to other passive reporting systems, NORS is subject to underreporting. NORS relies on private citizens, facility administrators, and health care providers to report potential outbreaks to state and local health departments, the latter of which in turn depends on the general public seeking medical care. However, only 15%–20% of persons with acute gastroenteritis seek medical care, and only 13%–19% of those submit a stool specimen for testing (60–62). In addition, underreporting to NORS likely occurs because state and local health departments, which often have limited resources and competing responsibilities, might be unable to investigate each potential outbreak or submit a completed report in NORS. Outbreaks in institutional settings (e.g., LTCFs or schools) or suspected or confirmed to be caused by certain pathogens also might be more likely to be reported and investigated. The net result can be observed through the tremendous variation in outbreak reporting rates, with a 1,000-fold difference between the highest and lowest state reporting rates. This variation likely reflects degrees in underreporting rather than differences in the true incidence of outbreaks. With the relatively recent advent of NORS, surveillance and reporting for AGE outbreaks spread through person-to-person contact, environmental contamination, and unknown modes of transmission has not yet been fully implemented or prioritized in all states. However, the number of outbreaks reported to NORS and median outbreak reporting rates steadily and substantially increased over the 5-year analysis period. Furthermore, the number of states reporting at least one outbreak per million population per year increased from 33 in 2009 to 43 in 2013, indicating that NORS coverage and use has improved substantially.
Second, only five variables (outbreak identification name, reporting site, primary mode of transmission, date of first illness, and number ill) are required to submit an outbreak report to NORS. Although this affords flexibility to sites that would like to report outbreaks for which they have only limited information available, it results in variable levels of completeness of other variables collected in the system (e.g., age, sex, etiology, and setting). In this report, 57% of the 10,756 outbreak reports included information on sex distribution of cases, 50% provided information on age distribution, and 65% included a setting of exposure. In a previous summary focusing on outbreaks transmitted through person-to-person contact (15), only 46%, 41%, and 53% of the outbreak reports provided information on sex, age, and setting, respectively. This increase in reporting completeness of variables might be in part because of improvements to NORS, as well as more intensive efforts by sites to investigate and report these outbreaks.
Conclusion
This is the first national data derived from NORS on AGE outbreaks spread through person-to-person contact, environmental contamination, and unknown modes of transmission, and highlights the associated morbidity and mortality. During 2009–2013, norovirus was the most frequently reported cause of AGE outbreaks transmitted through person-to-person contact, environmental contamination, and unknown mode of transmission. On the basis of epidemiologic characteristics, norovirus also might be responsible for a substantial portion of the 3,326 reported outbreaks of unknown etiology. An additional 332 shigellosis and 320 nontyphoidal salmonellosis outbreaks were also reported. No vaccines are licensed for any of these pathogens in the United States, and recommendations for prevention and control of AGE outbreaks transmitted through person-to-person contact, environmental contamination, and unknown modes of transmission depend primarily on appropriate hand hygiene, environmental disinfection, and isolation of ill persons. NORS surveillance data can help identify public health and research priorities for the development of future control strategies, including hygiene interventions and vaccines, and help assess their future impact toward decreasing the frequency and severity of AGE outbreaks in the United States.
Although norovirus was associated with most AGE outbreaks transmitted through person-to-person contact, environmental contamination, and unknown mode of transmission, other reported causes also merit attention. Approximately 11% of outbreaks, 5% of cases, and 7% of hospitalizations were caused by multiple etiologies or etiologies other than norovirus, Shigella, and Salmonella, many of which, (e.g., STEC), are considered primarily foodborne pathogens but can be transmitted through multiple routes. Further study of these AGE outbreaks transmitted through person-to-person contact, environmental contamination, and unknown mode of transmission should provide a better understanding of these pathogens and how they can be spread. Similarly, further examination of outbreaks of unknown etiology could help identify barriers to making an etiologic determination, to analyze clinical and epidemiologic clues indicating a probable etiology, and to discover new and emerging etiologic agents.
References
- Scallan E, Griffin PM, Angulo FJ, Tauxe RV, Hoekstra RM. Foodborne illness acquired in the United States—unspecified agents. Emerg Infect Dis 2011;17:16–22.
- CDC. National Outbreak Reporting System (NORS) guidance for reporting all enteric foodborne, person-to-person, environmental, animal contact, and unknown/indeterminate mode of transmission outbreaks and for the general sections for reporting waterborne outbreaks 2014. Atlanta, GA: US Department of Health and Human Services; CDC; 2014. Available at http://www.cdc.gov/nors/pdf/NORS-Guidance_FINAL508c.pdf.
- CDC. Guide to confirming a diagnosis in foodborne disease; 2006. Atlanta, GA: US Department of Health and Human Services; CDC; 2006. Available at http://www.cdc.gov/foodsafety/outbreaks/investigating-outbreaks/confirming_diagnosis.html.
- US Census Bureau. National, state, and Puerto Rico commonwealth totals datasets: population, population change, and estimated components of population change: April 1, 2010 to July 1, 2014. Washington, DC: US Census Bureau; 2014. Available at https://www.census.gov/popest/data/national/totals/2014/NST-EST2014-alldata.html.
- US Census Bureau. State intercensal estimates (2000–2010). Washington, DC; US Census Bureau; 2015. Available at https://www.census.gov/popest/data/intercensal/state/state2010.html.
- Beer KD, Gargano JW, Roberts VA, Beach MJ. Surveillance for waterborne disease outbreaks associated with drinking water and other nonrecreational water—United States, 2011–2012. MMWR Morb Mortal Wkly Rep 2015;64:842–8.
- Hlavsa MC, Roberts VA, Kahler AM, et al. Outbreaks of illness associated with recreational water—United States, 2011–2012. MMWR Morb Mortal Wkly Rep 2015;64:668–72.
- CDC. Foodborne Outbreak Online Database (FOOD). US Department of Health and Human Services, CDC. Available at http://wwwn.cdc.gov/foodborneoutbreaks/.
- Yoder JS, Roberts VA, Hall AJ, Gould LH, eds. NORSDirect: a database upload functionality for National Outbreak Reporting System (NORS) CSTE Annual Conference; 2014; Nashville, TN.
- CDC. Norovirus activity—United States, 2006–2007. MMWR Morb Mortal Wkly Rep 2007;56:842–6.
- Hall AJ, Wikswo ME, Manikonda K, et al. Acute gastroenteritis surveillance through the National Outbreak Reporting System, United States. Emerg Infect Dis 2013;19:1305–9.
- Patel MM, Hall AJ, Vinjé J, Parashar UD. Noroviruses: a comprehensive review. J Clin Virol 2009;44:1–8.
- Kirk MD, Fullerton KE, Hall GV, et al. Surveillance for outbreaks of gastroenteritis in long-term care facilities, Australia, 2002–2008. Clin Infect Dis 2010;51:907–14.
- Lopman BA, Adak GK, Reacher MH, Brown DW. Two epidemiologic patterns of norovirus outbreaks: surveillance in England and Wales, 1992–2000. Emerg Infect Dis 2003;9:71–7.
- Wikswo ME, Hall AJ; CDC. Outbreaks of acute gastroenteritis transmitted by person-to-person contact—United States, 2009–2010. MMWR Surveill Summ 2012;61(No. SS-9).
- Leshem E, Wikswo M, Barclay L, et al. Effects and clinical significance of GII.4 Sydney norovirus, United States, 2012–2013. Emerg Infect Dis 2013;19:1231–8.
- Harris-Kojetin L, Sengupta M, Park-Lee E, Valverde R. Long-term care services in the United States: 2013 overview. Hyattsville, MD: National Center for Health Statistics; 2013.
- CDC. Table 1. Number and percent distribution of all nursing home certified nursing assistants and those currently working in nursing homes, by selected nursing assistant characteristics: United States, 2004–2005. National Nursing Assistant Survey; 2008.
- Hall AJ, Lopman BA, Payne DC, et al. Norovirus disease in the United States. Emerg Infect Dis 2013;19:1198–205.
- Debbink K, Lindesmith LC, Baric RS. The state of norovirus vaccines. Clin Infect Dis 2014;58:1746–52.
- Richardson C, Bargatze RF, Goodwin R, Mendelman PM. Norovirus virus-like particle vaccines for the prevention of acute gastroenteritis. Expert Rev Vaccines 2013;12:155–67.
- Guerrant RL, Hughes JM, Lima NL, Crane J. Diarrhea in developed and developing countries: magnitude, special settings, and etiologies. Rev Infect Dis 1990;12(Suppl 1):S41–50.
- Brian MJ, Van R, Townsend I, et al. Evaluation of the molecular epidemiology of an outbreak of multiply resistant Shigella sonnei in a day-care center by using pulsed-field gel electrophoresis and plasmid DNA analysis. J Clin Microbiol 1993;31:2152–6.
- Abe K, Saito N, Kasuga F, Yamamoto S. Prolonged incubation period of salmonellosis associated with low bacterial doses. J Food Prot 2004;67:2735–40.
- Nguyen LM, Middaugh JP. Suspected transmission of norovirus in eight long-term care facilities attributed to staff working at multiple institutions. Epidemiol Infect 2012;140:1702–9.
- Rosenthal NA, Lee LE, Vermeulen BA, et al. Epidemiological and genetic characteristics of norovirus outbreaks in long-term care facilities, 2003–2006. Epidemiol Infect 2011;139:286–94.
- Johnson PC, Mathewson JJ, DuPont HL, Greenberg HB. Multiple-challenge study of host susceptibility to Norwalk gastroenteritis in US adults. J Infect Dis 1990;161:18–21.
- Lindesmith L, Moe C, Marionneau S, et al. Human susceptibility and resistance to Norwalk virus infection. Nat Med 2003;9:548–53.
- Boxman IL, Verhoef L, Dijkman R, et al. Year-round prevalence of norovirus in the environment of catering companies without a recently reported outbreak of gastroenteritis. Appl Environ Microbiol 2011;77:2968–74.
- Flemmer M, Oldfield EC 3rd. The agony and the ecstasy. Am J Gastroenterol 2003;98:2098–9.
- Friesema IH, Vennema H, Heijne JC, et al. Differences in clinical presentation between norovirus genotypes in nursing homes. J Clin Virol 2009;46:341–4.
- Harris JP, Edmunds WJ, Pebody R, Brown DW, Lopman BA. Deaths from norovirus among the elderly, England and Wales. Emerg Infect Dis 2008;14:1546–52.
- Mattner F, Sohr D, Heim A, et al. Risk groups for clinical complications of norovirus infections: an outbreak investigation. Clin Microbiol Infect 2006;12:69–74.
- van Asten L, Siebenga J, van den Wijngaard C, et al. Unspecified gastroenteritis illness and deaths in the elderly associated with norovirus epidemics. Epidemiology 2011;22:336–43.
- Greig JD, Lee MB. Enteric outbreaks in long-term care facilities and recommendations for prevention: a review. Epidemiol Infect 2009;137:145–55.
- Vilca LM, Bartolomé R, de Arquer M, et al. Mother as a vector of Salmonella enterica serotype Newport outbreak in a neonatal unit. Enferm Infecc Microbiol Clin 2015;S0213-005X(14)00357–7.
- CDC. Vital signs: incidence and trends of infection with pathogens transmitted commonly through food—foodborne diseases active surveillance network, 10 US sites, 1996–2010. MMWR Morb Mortal Wkly Rep 2011;60:749–55.
- Chai SJ, White PL, Lathrop SL, et al. Salmonella enterica serotype Enteritidis: increasing incidence of domestically acquired infections. Clin Infect Dis 2012;54(Suppl 5):S488–97.
- Scallan E, Hoekstra RM, Angulo FJ, et al. Foodborne illness acquired in the United States—major pathogens. Emerg Infect Dis 2011;17:7–15.
- Turabelidze G, Bowen A, Lin M, et al. Convalescent cultures for control of shigellosis outbreaks. Pediatr Infect Dis J 2010;29:728–30.
- Kimberlin D, Bardy M, Jackson M, Long S. Shigella infections. In: Pediatrics AAo, ed. Red book: 2015 Report of the Committee on Infectious Diseases. 30th ed. Elk Grove Village, IL: American Academy of Pediatrics; 2015.706–9.
- Collignon P. Clinical impact of antimicrobial resistance in humans. Rev Sci Tech 2012;31:211–20.
- Medalla F, Hoekstra RM, Whichard JM, et al. Increase in resistance to ceftriaxone and nonsusceptibility to ciprofloxacin and decrease in multidrug resistance among Salmonella strains, United States, 1996–2009. Foodborne Pathog Dis 2013;10:302–9.
- Arvelo W, Hinkle CJ, Nguyen TA, et al. Transmission risk factors and treatment of pediatric shigellosis during a large daycare center-associated outbreak of multidrug resistant Shigella sonnei: implications for the management of shigellosis outbreaks among children. Pediatr Infect Dis J 2009;28:976–80.
- CDC. Outbreaks of multidrug-resistant Shigella sonnei gastroenteritis associated with day care centers—Kansas, Kentucky, and Missouri, 2005. MMWR Morb Mortal Wkly Rep 2006;55:1068–71.
- Garrett V, Bornschlegel K, Lange D, et al. A recurring outbreak of Shigella sonnei among traditionally observant Jewish children in New York City: the risks of daycare and household transmission. Epidemiol Infect 2006;134:1231–6.
- Hall AJ, Curns AT, McDonald LC, Parashar UD, Lopman BA. The roles of Clostridium difficile and norovirus among gastroenteritis-associated deaths in the United States, 1999–2007. Clin Infect Dis 2012;55:216–23.
- Kroneman A, Verhoef L, Harris J, et al. Analysis of integrated virological and epidemiological reports of norovirus outbreaks collected within the Foodborne Viruses in Europe network from 1 July 2001 to 30 June 2006. J Clin Microbiol 2008;46:2959–65.
- Lopman BA, Hall AJ, Curns AT, Parashar UD. Increasing rates of gastroenteritis hospital discharges in US adults and the contribution of norovirus, 1996–2007. Clin Infect Dis 2011;52:466–74.
- CDC. Shigella surveillance: annual summary, 2006. Atlanta, Georgia: US Department of Health and Human Services; CDC; 2008.
- Kaplan JE, Feldman R, Campbell DS, Lookabaugh C, Gary GW. The frequency of a Norwalk-like pattern of illness in outbreaks of acute gastroenteritis. Am J Public Health 1982;72:1329–32.
- Turcios RM, Widdowson MA, Sulka AC, Mead PS, Glass RI. Reevaluation of epidemiological criteria for identifying outbreaks of acute gastroenteritis due to norovirus: United States, 1998–2000. Clin Infect Dis 2006;42:964–9.
- Adams DA, Jajosky RA, Ajani U, et al.; CDC. Summary of notifiable diseases—United States, 2012. MMWR Morb Mortal Wkly Rep 2014;61:1–121.
- CDC. Surveillance for foodborne disease outbreaks—United States, 2009–2010. MMWR Morb Mortal Wkly Rep 2013;62:41–7.
- DuPont HL, Levine MM, Hornick RB, Formal SB. Inoculum size in shigellosis and implications for expected mode of transmission. J Infect Dis 1989;159:1126–8.
- Mead PS, Slutsker L, Dietz V, et al. Food-related illness and death in the United States. Emerg Infect Dis 1999;5:607–25.
- Gupta A, Polyak CS, Bishop RD, Sobel J, Mintz ED. Laboratory-confirmed shigellosis in the United States, 1989–2002: epidemiologic trends and patterns. Clin Infect Dis 2004;38:1372–7.
- McAllister TA, Roud JA, Marshall A, Holland BM, Turner TL. Outbreak of Salmonella eimsbuettel in newborn infants spread by rectal thermometers. Lancet 1986;1:1262–4.
- CDC. Surveillance for foodborne disease outbreaks, United States, 2012, annual report. Atlanta, Georgia: US Department of Health and Human Services; CDC; 2014.
- Hall AJ, Rosenthal M, Gregoricus N, et al. Incidence of acute gastroenteritis and role of norovirus, Georgia, USA, 2004–2005. Emerg Infect Dis 2011;17:1381–8.
- Scallan E, Jones TF, Cronquist A, et al.; FoodNet Working Group. Factors associated with seeking medical care and submitting a stool sample in estimating the burden of foodborne illness. Foodborne Pathog Dis 2006;3:432–8.
- Kendall M, Scallan E, Greene S, et al., eds. Differences by age group in the prevalence of diarrhea and vomiting, rates of seeking health care, and stool sample submission: FoodNet population survey, 1996–2007. International Conference on Emerging Infectious Diseases; 2012 March 11–14; Atlanta, GA; 2012.
FIGURE 1. Rate* of outbreaks of acute gastroenteritis transmitted by person-to-person contact, environmental contamination, and unknown mode of transmission, by state — National Outbreak Reporting System, United States, 2009–2013
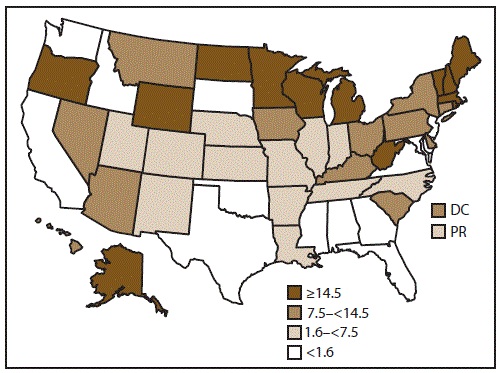
Abbreviations: DC = District of Columbia; PR = Puerto Rico.
* Average annual reporting rate of outbreaks by state, per million population, on the basis of U.S. Census Bureau population estimates.
Alternate Text: This figure is a map of the United States that presents the rate of outbreaks of acute gastroenteritis transmitted by person-to-person contact, environmental contamination, and unknown mode of transmission in each state and reporting area for the years 2009-2013. Of the 52 reporting sites, four reported <10 outbreaks each, 24 reported 10-99 outbreaks each, and 24 reported >100 outbreaks each.
FIGURE 2. Number of outbreak reports and median state reporting rate* of outbreaks of acute gastroenteritis transmitted by person-to-person contact, environmental contamination, and unknown mode of transmission, by year — National Outbreak Reporting System, United States, 2009–2013
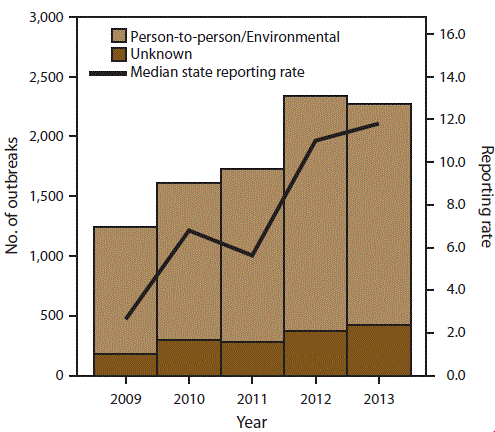
* Per million population.
Alternate Text: This figure is a histogram that presents the number of outbreak reports and median state reporting rate (per million population) of outbreaks of acute gastroenteritis transmitted by person-to-person contact, environmental contamination, and unknown mode of transmission for each year for the years 2009-2013. A total of 10,756 outbreaks were reported to NORS during the 5-year period.
FIGURE 3. Percentage of outbreaks of acute gastroenteritis* transmitted by person-to-person contact, environmental contamination,† and unknown mode of transmission,§ by suspected or confirmed etiology¶ — National Outbreak Reporting System, United States, 2009–2013
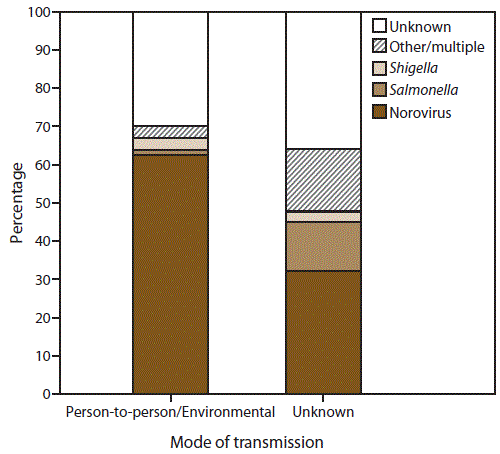
* N = 10,756.
† n = 9,193 (Person-to-person contact and environmental contamination).
§ n = 1,563.
¶ Other/multiple etiologies are listed in Table 1.
Alternate Text: This figure is a bar stacked graph that presents the percentage of outbreaks of acute gastroenteritis transmitted by person-to-person contact, environmental contamination, and unknown mode of transmission, by suspected or confirmed etiology in the United States, for the years 2009-2013. Of the 10,756 AGE outbreaks primarily transmitted through person-to-person contact, environmental contamination, and unknown mode of transmission, 7,370 (69%) had a single suspected or confirmed etiology, 3,326 (31%) had an unknown etiology, and 60 (<1%) had multiple etiologies.
FIGURE 4. Percentage of outbreaks of acute gastroenteritis* transmitted by person-to-person contact, environmental contamination,† and unknown mode of transmission,§ by confirmed etiology¶ — National Outbreak Reporting System, United States, 2009–2013
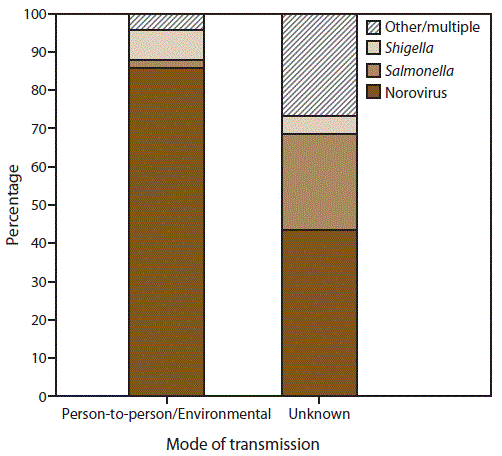
* N = 4,112.
† n = 3,362 (Person-to-person contact and environmental contamination).
§ n = 750.
¶ Other/multiple etiologies are listed in Table 1.
Alternate Text: This figure is a stacked bar graph that presents the percentage of outbreaks of acute gastroenteritis transmitted by person-to-person contact, environmental contamination, and unknown mode of transmission, by confirmed etiology in the United States, for the years 2009-2013. Of the 4,112 outbreaks with at least one laboratory-confirmed etiology, norovirus was the most common etiology, reported in 86% (n = 2,888) of 3,362 outbreaks transmitted through person-to-person contact or environmental contamination and 44% (n = 327) of 750 of those outbreaks with unknown transmission mode.
FIGURE 5. Number* of outbreaks of acute gastroenteritis transmitted by person-to-person contact, environmental contamination, and unknown mode of transmission, by month of first illness onset and suspected or confirmed etiology† — National Outbreak Reporting System, United States, 2009–2013
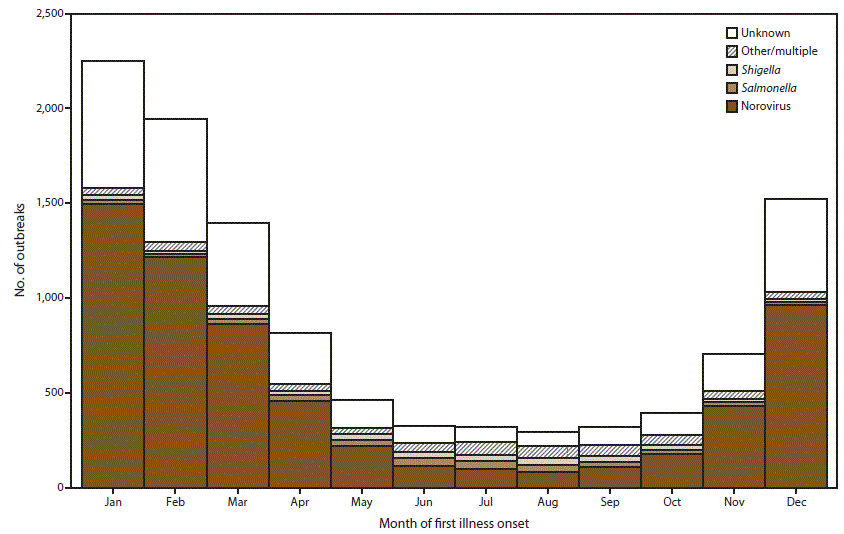
* N = 10,756.
† Other/multiple etiologies are listed in Table 1.
Alternate Text: This figure is a stacked bar graph that presents the number of outbreaks of acute gastroenteritis transmitted by person-to-person contact, environmental contamination, and unknown mode of transmission. This information is conveyed by month of first onset of illness and suspected or confirmed etiology in the United States, for the years 2009-2013. Outbreaks were more frequent during the winter as 5,716 (53%) of the 10,756 outbreaks occurred during December-February.
FIGURE 6. Percentage of cases in outbreaks of acute gastroenteritis transmitted by person-to-person contact, environmental contamination, and unknown mode of transmission, by sex* and suspected or confirmed etiology†,§ — National Outbreak Reporting System, United States, 2009–2013
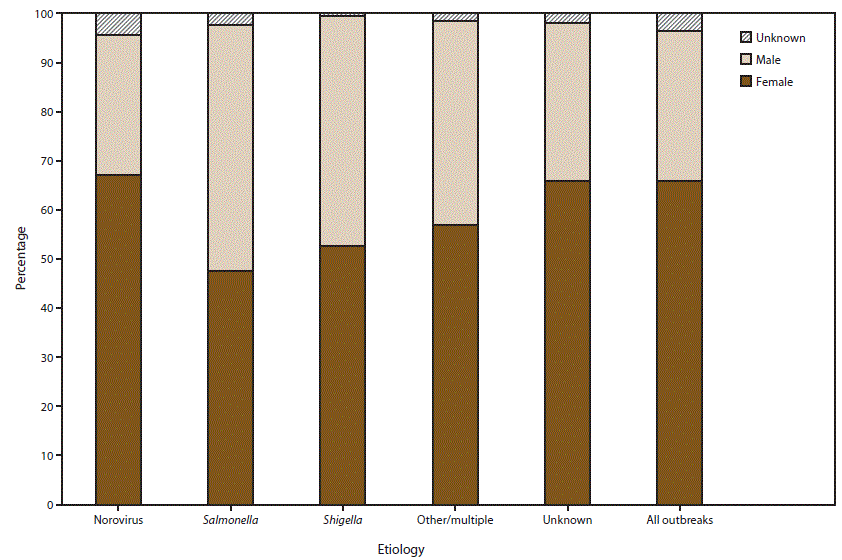
* For those outbreaks in which only the percentage in each sex was entered, numbers of cases were approximated by multiplying the percentages by the total number of primary cases for each outbreak.
† N = 6,099.
§ Other/multiple etiologies are listed in Table 1.
Alternate Text: This figure is a stacked bar graph that presents the percentage of cases in outbreaks of acute gastroenteritis transmitted by person-to-person contact, environmental contamination, and unknown mode of transmission, by sex and suspected or confirmed etiology in the United States, for the years 2009-2013. Among the 6,099 outbreaks with information on distribution of cases by sex, 66% of cases occurred in females.
FIGURE 7. Percentage of cases in outbreaks of acute gastroenteritis transmitted by person-to-person contact, environmental contamination, and unknown mode of transmission, by age group distribution* and suspected or confirmed etiology†,§ — National Outbreak Reporting System, United States, 2009–2013
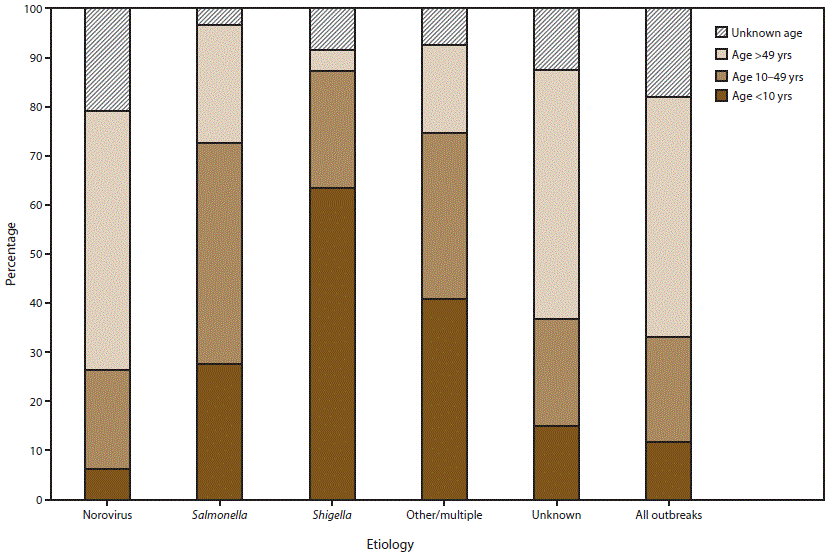
* For those outbreaks in which only the percentage in each age group was entered, numbers of cases were approximated by multiplying the percentages by the total number of primary cases for each outbreak.
† N = 5,405.
§ Other/multiple etiologies are listed in Table 1.
Alternate Text: This figure is a bar graph that presents to percentage of cases in outbreaks of acute gastroenteritis transmitted by person-to-person contact, environmental contamination, and unknown mode of transmission, distributed by age group and by suspected or confirmed etiology, in the United States, for the years 2009-2013. Among the 5,405 outbreaks with information on age distribution of cases, 12% of cases occurred in children aged <10 years, 21% of cases occurred in adolescents and adults aged 10-49 years, 49% of cases occurred in adults aged >49 years, and 18% of cases were of unknown age.
FIGURE 8. Percentage* of outbreaks of acute gastroenteritis transmitted by person-to-person contact, environmental contamination, and unknown mode of transmission, by symptom and suspected or confirmed etiology† — National Outbreak Reporting System, United States, 2009–2013
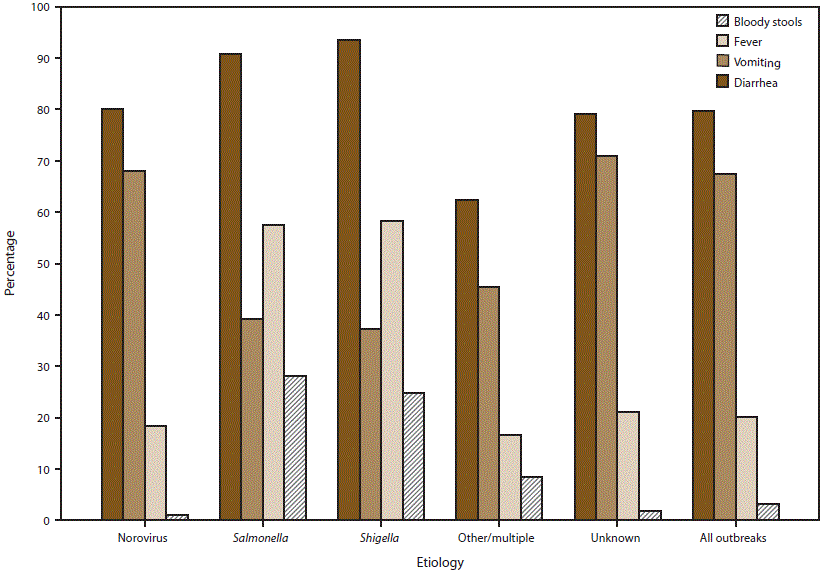
* Percentage calculations do not include missing data; different denominators are used for each category depending on the number of cases for which information on a symptom has been reported.
† Other/multiple etiologies are listed in Table 1.
Alternate Text: This figure is a bar graph that presents the percentage of outbreaks of acute gastroenteritis transmitted by person-to-person contact, environmental contamination, and unknown mode of transmission, by symptom and suspected or confirmed etiology, in the United States, for the years 2009-2013. Information on the proportion of cases reported with at least one symptom was available for 7,855 (73%) outbreaks.
|
TABLE 2. Number and percentage of outbreaks of acute gastroenteritis transmitted by person-to-person contact, environmental contamination, and unknown mode of transmission, by setting, mode of transmission, and suspected or confirmed etiology — National Outbreak Reporting System, United States, 2009–2013 |
|||||||
|---|---|---|---|---|---|---|---|
|
Mode of transmission |
Total outbreaks |
LTCF |
School |
Child care facility |
Hospital |
Private home or residence |
Other* |
|
No. |
No. (%) |
No. (%) |
No. (%) |
No. (%) |
No. (%) |
No. (%) |
|
|
Person-to-person/ environmental |
6,587 |
4,726 (72) |
530 (8) |
438 (7) |
243 (4) |
151 (2) |
499 (8) |
|
Unknown |
414 |
168 (41) |
33 (8) |
26 (6) |
16 (4) |
48 (12) |
123 (30) |
|
Etiology |
|||||||
|
Norovirus |
4,150 |
3,223 (78) |
264 (6) |
96 (2) |
162 (4) |
56 (1) |
349 (8) |
|
Salmonella |
84 |
11 (13) |
6 (7) |
30 (36) |
1 (1) |
22 (26) |
14 (17) |
|
Shigella |
241 |
3 (1) |
42 (17) |
143 (59) |
1 (0.4) |
28 (12) |
24 (10) |
|
Other/multiple† |
265 |
54 (20) |
25 (9) |
84 (32) |
8 (3) |
63 (24) |
31 (12) |
|
Unknown |
2,261 |
1,603 (71) |
226 (10) |
111 (5) |
87 (4) |
30 (1) |
204 (9) |
|
All outbreaks |
7,001 |
4,894 (70) |
563 (8) |
464 (7) |
259 (4) |
199 (3) |
622 (9) |
|
Abbreviation: LTCF = long-term–care facilities. * Other settings reported included restaurants (140), other health care facilities (124), camp (64), events or receptions (36), communitywide (35), office or indoor workplaces (34), hotels or resorts (30), prison or detention facilities (29), group homes or shelters (23), sporting events or facilities (18), adult day cares (16), religious facilities (14), tour groups (14), banquet facilities or caterers (9), military bases or academies (8), ships (4), fairs/festivals/mobile settings (3), parks (3), sex offender programs (3), youth centers (3), institutions (2), apple orchard (1), bowling alley (1), farm (1), fire station (1), harbor (1), livestock arena (1), "multiple" (1), parking structure (1), rustic cabin (1), and untreated recreational water/beach (1). † Other/multiple etiologies are listed in Table 1. |
|||||||
|
TABLE 3. Number of cases in outbreaks of acute gastroenteritis transmitted by person-to-person contact, environmental contamination, and unknown mode of transmission, by mode of transmission and suspected or confirmed etiology — National Outbreak Reporting System, United States, 2009–2013 |
|||||
|---|---|---|---|---|---|
|
Mode of transmission |
Total cases |
No. of outbreaks |
Mean cases per outbreak |
Median cases per outbreak |
Range of cases per outbreak |
|
Person-to-person/environmental |
328,824 |
9,193 |
35.8 |
25 |
2–2,500 |
|
Unknown |
27,708 |
1,563 |
17.7 |
8 |
2–528 |
|
Etiology |
|||||
|
Norovirus |
249,848 |
6,223 |
40.1 |
29 |
2–2,500 |
|
Salmonella |
1,771 |
320 |
5.5 |
3 |
2–109 |
|
Shigella |
6,032 |
332 |
18.2 |
7 |
2–742 |
|
Other/multiple* |
8,531 |
555 |
15.4 |
4 |
2–528 |
|
Unknown |
90,350 |
3,326 |
27.2 |
18.5 |
2–347 |
|
All outbreaks |
356,532 |
10,756 |
33 |
22 |
2–2,500 |
|
* Other/multiple etiologies are listed in Table 1. |
|||||
|
TABLE 4. Number and percentage* of cases in outbreaks of acute gastroenteritis transmitted by person-to-person contact, environmental contamination, and unknown mode of transmission, by clinical outcome, mode of transmission, and suspected or confirmed etiology — National Outbreak Reporting System, United States, 2009–2013 |
||||||||
|---|---|---|---|---|---|---|---|---|
|
Mode of transmission |
Deaths |
Hospitalized patients† |
Patients who visited the ED† |
Patients who sought health care§ |
||||
|
No. |
(%) |
No. |
(%) |
No. |
(%) |
No. |
(%) |
|
|
Person-to-person/environmental |
426 |
(0.2) |
4,486 |
(2.1) |
2,393 |
(1.9) |
8,992 |
(7.7) |
|
Unknown |
33 |
(0.2) |
908 |
(4.4) |
762 |
(4.9) |
2,189 |
(13) |
|
Etiology |
||||||||
|
Norovirus |
375 |
(0.2) |
3,398 |
(2.2) |
1,760 |
(1.9) |
5,844 |
(6.7) |
|
Salmonella |
6 |
(0.4) |
282 |
(22) |
150 |
(16) |
627 |
(58) |
|
Shigella |
1 |
(0.02) |
270 |
(6.1) |
306 |
(8.8) |
1,849 |
(60) |
|
Other/multiple¶ |
12 |
(0.2) |
377 |
(5.4) |
247 |
(5.5) |
881 |
(17) |
|
Unknown |
65 |
(0.1) |
1,067 |
(1.7) |
692 |
(1.7) |
1,980 |
(5.3) |
|
All outbreaks |
459 |
(0.2) |
5,394 |
(2.4) |
3,155 |
(2.2) |
11,181 |
(8.4) |
|
Abbreviation: ED = emergency department. * Percentages might not add to 100% because each percentage was calculated using a different denominator. † Categories are not mutually exclusive. § Excludes ED visits and hospitalizations. ¶ Other/multiple etiologies are listed in Table 1. |
||||||||
|
TABLE 5. Attack rates among guests and residents or staff in outbreaks of acute gastroenteritis transmitted by person-to-person contact, environmental contamination, and unknown mode of transmission, by mode of transmission and suspected or confirmed etiology — National Outbreak Reporting System, United States, 2009–2013 |
|||||
|---|---|---|---|---|---|
|
Mode of transmission |
Median guest/resident attack rate* (%) |
Range (%) |
Median staff attack rate† (%) |
Range (%) |
p-value§ |
|
Person-to-person/environmental |
28 |
(0–100) |
12 |
(0–100) |
<0.0001 |
|
Unknown |
25.5 |
(0–100) |
6 |
(0–66) |
<0.0001 |
|
Etiology |
(0–100) |
||||
|
Norovirus |
32 |
(0–100) |
15 |
(0–100) |
<0.0001 |
|
Salmonella |
40.5 |
(0–100) |
0 |
(0–85) |
<0.0001 |
|
Shigella |
12.5 |
(0–100) |
5 |
(0–100) |
<0.0001 |
|
Other/multiple¶ |
33 |
(0–100) |
10 |
(0–100) |
<0.0001 |
|
Unknown |
22 |
(0–100) |
8 |
(0–100) |
<0.0001 |
|
All outbreaks |
28 |
(0–100) |
12 |
(0–100) |
<0.0001 |
|
* N = 5,118 outbreaks. † N = 3,607 outbreaks. § As calculated using the Wilcoxon rank sum test. ¶ Other/multiple etiologies are listed in Table 1. |
|||||
Use of trade names and commercial sources is for identification only and does not imply endorsement by the U.S. Department of
Health and Human Services.
References to non-CDC sites on the Internet are
provided as a service to MMWR readers and do not constitute or imply
endorsement of these organizations or their programs by CDC or the U.S.
Department of Health and Human Services. CDC is not responsible for the content
of pages found at these sites. URL addresses listed in MMWR were current as of
the date of publication.
All MMWR HTML versions of articles are electronic conversions from typeset documents.
This conversion might result in character translation or format errors in the HTML version.
Users are referred to the electronic PDF version (http://www.cdc.gov/mmwr)
and/or the original MMWR paper copy for printable versions of official text, figures, and tables.
An original paper copy of this issue can be obtained from the Superintendent of Documents, U.S.
Government Printing Office (GPO), Washington, DC 20402-9371;
telephone: (202) 512-1800. Contact GPO for current prices.
**Questions or messages regarding errors in formatting should be addressed to
mmwrq@cdc.gov.
