HIV Infection and Risk, Prevention, and Testing Behaviors Among Injecting Drug Users — National HIV Behavioral Surveillance System, 20 U.S. Cities, 2009
Corresponding author: Dita Broz, National Center for HIV/AIDS, Viral Hepatitis, STD, and TB Prevention, CDC. Telephone: 404-639-5258; E-mail: DBroz@cdc.gov.
Abstract
Problem/Condition: At the end of 2009, an estimated 1,148,200 persons aged ≥13 years were living with human immunodeficiency virus (HIV) infection in the United States. Despite the recent decreases in HIV infection attributed to injection drug use, 8% of new HIV infections in 2010 occurred among injecting drug users (IDUs).
Reporting Period: June–December 2009.
Description of System: The National HIV Behavioral Surveillance System (NHBS) collects HIV prevalence and risk behavior data in selected metropolitan statistical areas (MSAs) from three populations at high risk for HIV infection: men who have sex with men, IDUs, and heterosexual adults at increased risk for HIV infection. Data for NHBS are collected in rotating cycles. For the 2009 NHBS cycle, IDUs were recruited in 20 participating MSAs using respondent-driven sampling, a peer-referral sampling method. Participants were eligible if they were aged ≥18 years, lived in a participating MSA, were able to complete a behavioral survey in English or Spanish, and reported that they had injected drugs during the past 12 months. Consenting participants completed an interviewer-administered (face-to-face), anonymous standardized questionnaire about HIV-associated behaviors, and all participants were offered anonymous HIV testing. Analysis of 2009 NHBS data represents the first large assessment of HIV prevalence among IDUs in the United States in >10 years.
Results: This report summarizes two separate analyses using unweighted data from 10,200 eligible IDUs in 20 MSAs from the second collection cycle of NHBS in 2009. Both an HIV infection analysis and a behavioral analysis were conducted. Different denominators were used in each analysis because of the order and type of exclusion criteria applied.
For the HIV infection analysis, of the 10,200 eligible participants, 10,090 had a valid HIV test result, of whom 906 (9%) tested positive for HIV (range: 2%–19% by MSA). When 509 participants who reported receiving a previous positive HIV test result were excluded from this analysis, 4% (397 of 9,581 participants) tested HIV-positive.
For the behavioral analysis, because knowledge of HIV status might influence risk behaviors, 548 participants who reported a previous HIV-positive test result were excluded from the 10,200 eligible participants. All subsequent analyses were conducted for the remaining 9,652 participants. The most commonly injected drugs during the past 12 months among these participants were heroin (90%), speedball (heroin and cocaine combined) (58%), and cocaine or crack (49%). Large percentages of participants reported receptive sharing of syringes (35%); receptive sharing of other injection equipment, such as cookers, cotton, or water (58%); and receptive sharing of syringes to divide drugs (35%). Many participants reported having unprotected sex with opposite-sex partners during the past 12 months: 70% of men and 73% of women had unprotected vaginal sex, and 25% of men and 21% of women had unprotected anal sex. A combination of unsafe injection- and sex-related behaviors during the past 12 months was commonly reported; 41% of participants who reported unprotected vaginal sex with one or more opposite-sex partners, and 53% of participants who reported unprotected anal sex with one or more opposite-sex partners also reported receptive sharing of syringes. More women than men reported having sex in exchange for money or drugs (31% and 18%, respectively). Among men, 10% had oral or anal sex with one or more male partners during the past 12 months. Many participants (74%) reported noninjection drug use during the past 12 months, and 41% reported binge drinking during the past 30 days. A large percentage of participants (74%) had ever been tested for hepatitis C, 41% had received a hepatitis C virus infection diagnosis, and 29% had received a vaccination against hepatitis A virus, hepatitis B virus, or both. Most (88%) had been tested for HIV during their lifetime, and 49% had been tested during the past 12 months. Approximately half of participants received free HIV prevention materials during the past 12 months, including condoms (50%) and sterile syringes (44%) and other injection equipment (41%). One third of participants had been in an alcohol or a drug treatment program, and 21% had participated in an individual- or a group-level HIV behavioral intervention.
Interpretation: IDUs in the United States continue to engage in sexual and drug-use behaviors that increase their risk for HIV infection. The large percentage of participants in this study who reported engaging in both unprotected sex and receptive sharing of syringes supports the need for HIV prevention programs to address both injection and sex-related risk behaviors among IDUs. Although most participants had been tested for HIV infection previously, less than half had been tested in the past year as recommended by CDC. In addition, many participants had not been vaccinated against hepatitis A and B as recommended by CDC. Although all participants had injected drugs during the past year, only a small percentage had recently participated in an alcohol or a drug treatment program or in a behavioral intervention, suggesting an unmet need for drug treatment and HIV prevention services.
Public Health Action: To reduce the number of HIV infections among IDUs, additional efforts are needed to decrease the number of persons who engage in behaviors that increase their risk for HIV infection and to increase their access to HIV testing, alcohol and drug treatment, and other HIV prevention programs. The National HIV/AIDS Strategy for the United States delineates a coordinated response to reduce HIV incidence and HIV-related health disparities among IDUs and other disproportionately affected groups. CDC's high-impact HIV prevention approach provides an essential step toward achieving these goals by using combinations of scientifically proven, cost-effective, and scalable interventions among populations at greatest risk. NHBS data can be used to monitor progress toward the national strategy goals and to guide national and local planning efforts to maximize the impact of HIV prevention programs.
Introduction
At the end of 2009, an estimated 1,148,200 persons aged ≥13 years in the United States were living with human immunodeficiency virus (HIV) infection (1), and an estimated 47,500 were newly infected in 2010 (2). Among new HIV infections in 2010, approximately 61% were attributed to male-to-male sexual contact, 25% to heterosexual contact, 8% to injection drug use, and 3% to male-to-male sexual contact and injection drug use (2). Although injecting drug users (IDUs) comprise an estimated 2.6% of the U.S. population, they account for 22% of all persons living with HIV infection (3). The number of persons living with HIV infection, particularly among groups at increased risk for infection, might continue to increase without an improved and coordinated response to HIV in the United States (4). The National HIV/AIDS Strategy for the United States, released in July 2010, addresses the urgent need to reduce HIV incidence, improve access to care and health outcomes for persons living with HIV, reduce HIV-related disparities and health inequities, and improve coordination of HIV programs across federal, state, territorial, tribal, and local governments (4).
One of the goals of the National HIV/AIDS Strategy is to decrease by 25% the annual number of new infections by 2015. This goal is to be achieved by implementing three critical steps to reduce HIV incidence: intensifying HIV prevention efforts in communities where HIV is most heavily concentrated (including among blacks, Hispanics/Latinos, men who have sex with men [MSM], and persons who inject drugs); expanding efforts to prevent HIV infection by using a combination of effective, evidence-based, and scalable approaches (including drug treatment and access to sterile needles and syringes); and educating the general public about HIV infection and how to prevent it. State and local health departments as well as federal agencies are expected to monitor progress toward the goals of the National HIV/AIDS Strategy.
The National HIV Behavioral Surveillance System (NHBS) was designed to help state and local health departments in reporting areas with high AIDS prevalence monitor selected risk behaviors, HIV testing experiences, use of prevention programs, and HIV prevalence in three populations at high risk for HIV infection: MSM, IDUs, and heterosexual adults at increased risk for HIV (5,6). NHBS is a key source of data for monitoring behaviors among populations at risk for HIV infection in the United States and is used by CDC to characterize HIV infection in these populations. Findings from NHBS can be used to enhance the understanding of HIV risk and testing behaviors and identify gaps in prevention efforts. At the state and local levels, NHBS data are used to renew and maintain efforts to prevent HIV infection as well as other bloodborne and sexually transmitted diseases (STDs). Thus, NHBS serves as a key component of CDC's comprehensive approach for reducing the spread of HIV in the United States and provides data necessary for CDC's high-impact prevention approach (7) toward achieving the goals of the National HIV/AIDS Strategy. This approach emphasizes the use of combinations of scientifically proven, cost-effective, and scalable interventions among populations at greatest risk for HIV infection.
This report summarizes results from the second NHBS data collection cycle among IDUs (NHBS-IDU2), which was conducted during June–December 2009. Data from the first cycle among IDUs (NHBS-IDU1), conducted during May 2005–February 2006, were reported previously (8), as were weighted estimates of HIV prevalence and selected risk behaviors from NHBS-IDU2 (9). This report provides unweighted data that can be used to describe the prevalence of HIV infection among IDUs and the percentage of IDUs reporting specific risk behaviors, HIV testing, and participation in prevention programs. Monitoring these NHBS data are useful for assessing risk behaviors over time and for identifying HIV prevention opportunities in this population.
Methods
NHBS conducts rotating cycles of annual behavioral surveys among MSM, IDUs, and heterosexual adults at increased risk for HIV infection (5). A period of data collection with a specific population is referred to as a cycle, and cycles are numbered consecutively (e.g., NHBS-IDU1 and NHBS-IDU2). The same general eligibility criteria are used in each cycle: aged ≥18 years, a current resident of the metropolitan statistical area (MSA) or specified MSA division, not a previous NHBS participant during the current survey cycle, ability to complete the survey in either English or Spanish, and ability to provide informed consent. In addition to these general NHBS eligibility requirements, participants in NHBS-IDU2 must have 1) reported injecting a drug that was not prescribed to them during the past 12 months and 2) presented physical evidence of recent injection (e.g., track marks) or adequately described their injection practices.
For each survey cycle, an anonymous standardized questionnaire is used to collect information about behavioral risks for HIV infection, HIV testing, and use of HIV treatment and prevention services. The face-to-face survey is administered by a trained interviewer using a handheld computer. All participants are offered an anonymous HIV test, and HIV test results are linked to the survey data. All participating state and local jurisdictions obtained appropriate human subject protections approval before conducting the NHBS-IDU2 survey.
Participating Areas
State and local health departments that were eligible to participate in NHBS-IDU2 were those whose jurisdictions included an MSA or a specified MSA division with the highest AIDS prevalence in 2006 (CDC, unpublished data, 2006). These eligible MSAs represented approximately 60% of all persons living with diagnosed HIV infection ever classified as stage 3 (AIDS) in urban areas with a population size of ≥500,000 at the end of 2009 (10). Throughout this report, MSAs are referred to by the name of the primary principal city (Figure 1).
The NHBS-IDU2 survey was conducted in the following MSAs (or if a metropolitan division is indicated, the survey was conducted within that specific division of the MSA): 1) Atlanta-Sandy Springs-Marietta, Georgia; 2) Baltimore-Towson, Maryland; 3) Boston-Cambridge-Quincy, Massachusetts-New Hampshire: Boston-Quincy Division; 4) Chicago-Joliet-Naperville, Illinois-Indiana-Wisconsin: Chicago-Joliet-Naperville Division; 5) Dallas-Fort Worth-Arlington, Texas: Dallas-Plano-Irving Division; 6) Denver-Aurora-Broomfield, Colorado; 7) Detroit-Warren-Livonia, Michigan: Detroit- Livonia-Dearborn Division; 8) Houston-Sugar Land-Baytown, Texas; 9) Los Angeles-Long Beach-Santa Ana, California: Los Angeles-Long Beach-Glendale Division; 10) Miami-Ft. Lauderdale-Pompano Beach, Florida: Miami Division; 11) New Orleans-Metairie-Kenner, Louisiana; 12) New York-Northern New Jersey-Long Island, New York-New Jersey-Pennsylvania: New York-White Plains-Wayne Division; 13) New York-Northern New Jersey-Long Island, New York-New Jersey-Pennsylvania: Nassau-Suffolk Division; 14) New York-Northern New Jersey-Long Island, New York-New Jersey-Pennsylvania: Newark-Union Division; 15) Philadelphia-Camden-Wilmington, Pennsylvania, New Jersey, Delaware, Maryland: Philadelphia Division; 16) San Diego-Carlsbad-San Marcos, California; 17) San Francisco-Oakland-Fremont, California: San Francisco-San Mateo-Redwood City Division; 18) San Juan-Caguas-Guaynabo, Puerto Rico; 19) Seattle-Tacoma-Bellevue, Washington: Seattle-Bellevue-Everett Division; 20) Washington-Arlington-Alexandria, District of Columbia (DC)-Virginia-Maryland-West Virginia: Washington-Arlington-Alexandria Division.
Sampling Method
Each NHBS cycle begins with formative research in each MSA to describe the characteristics of the study population of interest, understand the context of HIV risk behavior in the MSA, gain community support, and finalize study logistics (e.g., field site locations) (11). Participants for the NHBS-IDU2 cycle were recruited using respondent-driven sampling (RDS) (12). RDS started with a limited number of initial participants who were chosen by referrals from persons who knew the local population of IDUs or through outreach to areas where IDUs could be found. Initial participants who completed the eligibility screener and were found eligible were administered the survey, and those who completed the survey were asked to recruit up to five persons they knew personally who inject drugs to participate in the survey. These persons, in turn, completed the survey and were asked to recruit others, using a system of coded coupons. This recruitment process continued until the sample size had been reached or the sampling period ended. Participants received incentives for participating in the survey as well as for recruiting others.
Data Collection
Persons who brought a valid coupon to an NHBS-IDU2 field site were escorted to a private area for eligibility screening. Trained interviewers obtained informed consent from those who met NHBS-IDU2 eligibility. They then conducted face-to-face interviews, which took approximately 40 minutes to complete and consisted of questions concerning participants' demographic characteristics, HIV testing history, sexual and drug-use behaviors, hepatitis testing and vaccination, STD testing and diagnosis, and use of HIV treatment and prevention services. In exchange for their time to complete the survey, participants received approximately $25 in cash or a gift certificate (amount determined locally). HIV testing was performed for participants who consented to testing by collecting blood or oral specimens for either rapid testing in the field or laboratory-based testing. A nonreactive rapid test result was considered HIV-negative; a reactive rapid test result was considered HIV-positive if confirmed by Western blot or indirect immunofluorescence assay. Participants also received approximately $25 in cash or a gift certificate for HIV testing. Participants who agreed to recruit others received an additional cash incentive or a gift certificate of approximately $10 for each new participant (up to five) they recruited who successfully completed the interview. The goal of each participating MSA was to interview 500 persons who had injected drugs during the 12 months before the NHBS interview.
Data Analysis
This surveillance summary presents data on HIV infection and key HIV-associated behaviors to monitor HIV prevention efforts for IDUs in the 20 MSAs or MSA divisions where data were collected during June–December 2009. The data are descriptive; no statistical tests were performed. Comparisons were guided based on differences of ≥5%, which were deemed meaningful in the public health context given the NHBS sample size. In addition, because these data are cross-sectional, no causal relationships are inferred.
Data for this report are not weighted. Weighting methods for RDS data are still under development and are limited to estimation of outcomes with sufficient local sample sizes. This report follows the previously published unweighted analysis of NHBS-IDU1 data (8) to provide a detailed summary of surveillance data collected as part of NHBS-IDU2 for use nationally and locally. Consistent reporting of unweighted surveillance data over time efficiently and transparently summarizes these data. An unweighted analysis also allows more detailed reporting of outcomes stratified by less prevalent groups that would otherwise need to be combined into an "other" category (for the purpose of weighting). For example, key behavioral outcomes in this surveillance summary are reported for each of the 20 participating MSAs, and behaviors for less prevalent racial/ethnic groups are examined, including American Indian/Alaska Natives and Asian/Native Hawaiian/Other Pacific Islanders. Weighted estimates of key behavioral outcomes and HIV prevalence were published elsewhere (9). To ensure that anonymous data reporting standards of CDC and all state and local health departments were met, data were suppressed for cells with five or fewer participants
Analysis exclusion criteria are presented (Figure 2); criteria were not mutually exclusive and were applied in the order listed. All analyses in this report exclude data for participants who did not meet NHBS-IDU2 eligibility criteria and who lost data during electronic uploads, did not consent to the survey, had incomplete survey data, had survey responses with questionable validity, or who did not identify as male or female. Additional and different exclusion criteria were applied for analyses of HIV infection and of HIV-associated behaviors.
Analysis of HIV Infection
The prevalence of HIV infection is reported for 10,090 participants who had a valid HIV test result; this sample excludes 110 of the 10,200 eligible participants who did not consent to HIV testing, had indeterminate test results or who had discordant test results (i.e., reported a previous positive HIV test result but had a negative HIV test result at the time of the survey). HIV infection also is reported for the 9,581 participants with a valid HIV test result who did not report a previous positive HIV test result at the time of the survey, which is a measure of undiagnosed infection. Among these participants, analyses determined time since last HIV test and the percentage of HIV infection by time since the last HIV test.
Analysis of HIV-Associated Behaviors
Multiple studies have found that knowledge of personal HIV status might influence risk behaviors (13,14). Therefore, to assess behaviors related to HIV infection and experiences with HIV prevention services, 548 participants who reported a previous HIV-positive test result were excluded from the 10,200 eligible participants. All analyses of HIV-associated behaviors were conducted among 9,652 participants who did not report a previous positive HIV test result. These participants included those who did not have a valid HIV test result but provided information about their behaviors.
Measures
Characteristics of Participants
For both analyses, data on characteristics of participants included sex, race/ethnicity, age group, education level, annual household income, health insurance status, contact with a health-care provider, homelessness, arrest history, history of alcohol or drug treatment program, and MSA of residence. Responses for race/ethnicity were categorized into mutually exclusive categories: non-Hispanic white (hereafter referred to as white); non-Hispanic black or African American (hereafter referred to as black); Hispanic or Latino; American Indian/Alaska Native; Asian/Native Hawaiian/Other Pacific Islander; and other racial group, which included persons of multiple races. Persons of Hispanic or Latino ethnicity might be of any race and were categorized as Mexican, Puerto Rican, Cuban, Dominican, other, or multiple ancestries. Education level was categorized as less than high school, high school diploma or equivalent (e.g., general educational development [GED] diploma), or greater than high school. Household income was categorized as 1) at or below the federal poverty level or 2) above the federal poverty level. The federal poverty level is based on household income and household size (15). Participants were asked to report all household income (i.e., the total amount of money from all persons living in the household earned in the last year from all sources before taxes, or if homeless, the total amount of money earned or received) and the number of persons in the household (defined as the number of persons who depended on that income, including the participant). To calculate poverty, each participant's responses to household income and the number of persons in the household were compared with the federal poverty income level threshold for persons with the same household size. Health insurance was categorized as none, public only (e.g., Medicare, Medicaid, or Veterans Administration coverage), private only (e.g., health insurance obtained through a private insurance policy or employer, TRICARE, CHAMPUS, or membership in a health maintenance organization), or other or multiple coverage. Contact with a health-care provider was based on participants' responses to a question about seeing a doctor, nurse, or other health-care provider. Consistent with the Stewart B. McKinney Homeless Act of 1987 (42 U.S.C. §11331 et seq.), homelessness was defined as living on the street, in a shelter, in a single room occupancy hotel, or in a car or temporarily staying with friends or relatives. Arrest history was defined as having been arrested and booked (i.e., formally processed and put in a jail or detention center). Alcohol treatment and drug treatment were measured jointly; treatment programs included outpatient, residential, detoxification, methadone treatment, or 12-step programs.
Injection Drug Use
Participants were asked about the types of drugs they injected during the past 12 months that had not been prescribed to them. Injection was defined as intravenous, intramuscular, or subcutaneous. For each drug listed, participants selected the frequency of injecting the drug, which ranged from "didn't use" to "more than once a day." On the basis of these responses, variables were created to describe any use of the following drugs: heroin, speedball (i.e., heroin and cocaine combined and injected together in the same syringe), cocaine or crack, methamphetamine, and other/multiple (all other drugs or combinations other than heroin and cocaine). The same questions and corresponding responses about frequency of injecting different types of drugs also were used to create the variable for drugs injected most frequently, which includes the following five mutually exclusive categories: heroin, heroin and cocaine (i.e., injected separately with equal frequency or combined as speedball), cocaine or crack, methamphetamine, and other (all other drugs or combinations). Frequency variables were 1) injected in past 12 months (any injection of each any of the drugs or drug combinations during the past 12 months) and 2) injected daily (injecting one or more times per day), a variable that was assessed both as a measure of frequency of injection and to distinguish regular from sporadic use.
Sharing injection paraphernalia is a key risk behavior for transmission of bloodborne infections, including HIV and hepatitis C virus (HCV). Furthermore, sharing different types of equipment (e.g., syringes or cookers) might carry different risks for transmission (16–20). Participants in this study were asked about receptive sharing of injection paraphernalia during the past 12 months. Receptive sharing of syringes was defined as having injected with a needle and syringe that someone else had previously used to inject. Receptive sharing of injection equipment was defined as having used the same cooker, cotton, or water (for rinsing needles or preparing drugs) previously used by someone else. Receptive sharing of syringes to divide drugs was defined as having divided a drug solution with a syringe that someone else had previously used to inject (21). Any receptive sharing was defined as having engaged in any of these three receptive sharing behaviors.
Sexual Behavior
Information about sex practices during the past 12 months is presented in terms of key risk behaviors for sexual transmission of HIV among IDUs and their sex partners. Having any sex included oral, vaginal, or anal sex. Male participants were asked about vaginal and anal sex behaviors with their female and male sex partners, and female participants were asked about vaginal and anal sex behaviors with male partners. For men, anal sex with another man included either insertive or receptive anal sex. Sex partners were categorized as main, casual, or exchange partners. A main partner was someone to whom the participant felt most committed (e.g., boyfriend or girlfriend, spouse, significant other, or life partner). A casual partner was someone to whom the participant did not feel committed or did not know very well. An exchange partner was one with whom the participant had sex in exchange for something such as money or drugs (i.e., exchange sex). Participants could report having more than one or any combination of main, casual, or exchange partners during the past 12 months. Unprotected vaginal or anal sex was defined as having sex without a condom.
To assess sexual risk behavior among male and female participants during the past 12 months, responses to questions about vaginal and anal sex and the number of opposite-sex partners were combined for men and women into the following summary variables: had unprotected vaginal sex with an opposite-sex partner, had unprotected anal sex with an opposite-sex partner, and had more than one opposite-sex partner.
Alcohol and Noninjection Drug Use
Participants were asked about their alcohol consumption and use of noninjection drugs. Alcohol use was defined as drinking any alcohol such as beer, wine, malt liquor, or hard liquor 30 days before the interview. Heavy drinking was defined as drinking, on average, more than two alcoholic beverages (for men) or more than one alcoholic beverage (for females) per day in the 30 days before the interview. Binge drinking was defined as drinking five or more (for men) or four or more (for women) alcoholic beverages at one sitting at least once in the 30 days before the interview. Participants who reported noninjection use of drugs that had not been prescribed for them during the past 12 months were asked about use of marijuana, crack, cocaine, heroin, methamphetamine, downers (e.g., Valium, Ativan, or Xanax), painkillers (e.g., Oxycontin, Vicodin, or Percocet) or any other noninjected drugs. Use of any noninjection drug was defined as use of one or more of the drugs listed.
STDs and Hepatitis
Participants were asked whether they had been told during the past 12 months by a doctor, nurse, or other health-care provider that they had syphilis, gonorrhea, chlamydia, herpes, or any other STD. Participants who reported one or more of these STDs were categorized as having any STD. Participants also were asked whether they had ever been told by a doctor, a nurse, or another health-care provider that they had hepatitis or had received a hepatitis vaccine. Participants who reported a hepatitis diagnosis were asked about the type of viral hepatitis they had; the data presented in this report focus on diagnosis of hepatitis C. A hepatitis C diagnosis was defined as ever being told by a health-care provider that they had an HCV infection. Participants who had not been told by a health-care provider that they had an HCV infection were asked if they ever had a blood test to check for HCV infection. Hepatitis C testing was defined as having ever been told by a health-care provider that they had an HCV infection or having ever had a blood test to check for HCV infection. Hepatitis vaccination was defined as having ever received a hepatitis vaccine, regardless of the number of doses and type of vaccine (i.e., against hepatitis A virus [HAV], hepatitis B virus [HBV], or both).
Use of Prevention Services and Programs
HIV Testing
Participants were asked whether they had ever had an HIV test in their lifetime, whether they had received an HIV test during the past 12 months, and about the type of facility that administered the most recent HIV test. Participants who had ever had an HIV test in their lifetime were asked for the date (month and year) of the most recent HIV test. This information was used to determine the time since the last HIV test. Participants who reported not having had an HIV test during the past 12 months were asked to select from a list of reasons for not having been tested (i.e., thought they were at low risk for HIV infection; afraid of finding out they had HIV; lack of time, money, or transportation; or another reason). Participants who selected more than one reason were asked to indicate the most important reason for not having been tested.
Prevention Materials
Participants were asked whether they had received free HIV prevention materials (not including those given by a friend, relative, or sex partner) during the past 12 months and the type of organization that provided these materials. Prevention materials included condoms, sterile needles, and other injection equipment, such as a new cooker, cotton, or water.
Treatment and Behavioral Interventions for Alcohol and Drug Use
In one question, participants were asked about their participation in alcohol or drug treatment programs during the past 12 months (i.e., outpatient, inpatient, residential, drug detoxification programs, methadone treatment, or 12-step programs). Participants were also asked, in separate questions, about their involvement in individual- or group-level HIV-related behavioral interventions. An individual-level intervention was defined as a one-on-one conversation with an outreach worker, a counselor, or a prevention program worker about ways to prevent HIV. A group-level intervention was defined as an organized session with a small group of persons (excluding discussions with friends) to discuss ways to prevent HIV. Individual- and group-level behavioral interventions were defined based on the intervention types described in CDC's evaluation system (21). Conversations that took place solely as a part of obtaining HIV testing (e.g., pretest or posttest counseling) were not considered HIV behavioral interventions. Participants were asked to select all organizations that provided the behavioral interventions from a list of providers that included HIV/AIDS-focused community-based organizations, syringe exchange programs, outreach programs for injection drug use, drug treatment programs, and others.
Results
In 2009, a total of 13,186 persons were recruited to participate in NHBS-IDU2; of these, 2,687 (20%) were ineligible (Figure 2). Data also were excluded from all analyses for participants who had lost data during the electronic upload (n = 153), did not consent to the survey (n = 2), had incomplete survey data (n = 25), had survey responses with questionable validity (n = 63), or did not identify as male or female (n = 56). A total of 10,200 participants were eligible for analysis.
Analysis of HIV Infection
HIV infection data are presented for all participants 1) with a valid HIV test result and 2) who had a valid test result and did not report a previous positive HIV test result. Participants were excluded if they did not consent to HIV testing (n = 35), had indeterminate HIV test results (n = 54), or had discordant test results (n = 21), for a total sample of 10,090 participants with a valid HIV test result. In addition, 509 participants who reported a previous positive HIV test result were excluded, for a total of 9,581 participants with a valid HIV test result who did not report a previous positive HIV test result.
Analysis of HIV-Associated Behaviors
HIV-associated behaviors are reported for all participants who did not report a previous positive HIV test result, regardless of whether they had a valid HIV test result. Participants who reported a previous positive HIV test result at the time of the survey (n = 548) were therefore excluded from this analysis, for a total of 9,652 participants.
HIV Infection
Of the 10,090 participants with a valid HIV test result, 906 (9%) tested positive for HIV (Table 1). HIV infection percentages ranged from 2% (Dallas, Texas, and San Diego, California) to 19% (Atlanta, Georgia). Percentages of persons with HIV infection were highest among blacks (11%) and Hispanic or Latinos (10%) and persons aged 40–49 years (11%). The percentage of participants with HIV infection was lower among participants without any health insurance (5%) than among those with public (12%), private (14%), or other/multiple (18%) types of health insurance. By type of drug injected, the percentage of participants with HIV infection was lowest among participants who reported most frequently injecting heroin (6%) and highest among those who most frequently injected methamphetamine (19%). HIV infection percentages did not vary by whether participants had been in treatment for drugs or alcohol ever or during the past 12 months (9% in all categories). Among men, HIV infection was higher among those who reported having male-to-male sex during the past 12 months than those who reported having male-to-male sex (but not during the past 12 months) and those who never had male-to-male sex (22%, 10%, and 7%, respectively). The percentage of participants with HIV infection was lower among participants who reported that their last HIV test was negative (2%) than those who had never obtained their test results (13%), never been tested (11%), and others (i.e., those who did know the results of their last test, reported an indeterminate test results, or refused to answer) (16%).
Of the 9,581 participants with a valid HIV test result who did not report a previous positive HIV test result, 397 (4%) tested positive for HIV. Patterns of HIV infection were similar overall for participants with a valid HIV test result and among participants who had a valid HIV test result and did not report a previous HIV-positive test result. For the 9,581 participants who had a valid HIV test result and did not report a previous HIV-positive test result, the percentages of those with HIV infection were lower among participants who reported that their last HIV test was ≤3 months (2%), 4–6 months (2%), 7–12 months (3%), or ≥13 months (5%) than among those who had never been tested (11%). Across cities, percentages of participants with HIV infection among those with a valid HIV test result and who did not report a previous HIV positive test result ranged from 1% (Detroit, Michigan, and Seattle, Washington) to 13% (San Juan, Puerto Rico).
Characteristics of Participants
Of the 9,652 participants included in the analysis of HIV-associated behaviors, 72% were men and 28% were women, and the largest percentage by race/ethnicity was black (46%) (Table 2). Hispanic or Latino ethnicity was reported by 22% of all participants, and 62% of these participants reported their ancestry as Puerto Rican. Ten percent of participants were aged <30 years, 49% were aged 30–49 years, and 41% were aged ≥50 years. Approximately one third (34%) had not completed high school. Most (80%) of the participants had a household income at or below the federal poverty level in the last year. Most (71%) had visited a health-care provider during the past 12 months, although almost half (49%) had no health insurance. More than half (62%) of the participants had been homeless at some time during the past 12 months, including a substantial percentage (42%) who were homeless at the time of the survey. More than one third (36%) of the participants had been arrested during the past 12 months. Over half (59%) of the participants reported that heroin was the drug they injected most frequently, and an additional 25% reported most frequently injecting heroin and cocaine (i.e., injected separately with the same frequency or together as speedball). Three fourths of participants had been in a drug or alcohol treatment program at some time, and one third had been in drug or alcohol treatment during the past 12 months. The characteristics of male and female participants were largely similar, although a higher percentage of men reported Hispanic or Latino ethnicity and, during the past 12 months, to have had no health insurance, not visited a health-care provider, been homeless, and been arrested.
Injection Drug Use
During the past 12 months, 90% of participants reported injecting heroin, 58% reported injecting speedball, and 49% reported injecting cocaine or crack (Table 3). In all cities, heroin was the most commonly reported drug injected, ranging from 70% (Houston, Texas) to 100% (Detroit, Michigan), except in San Juan, Puerto Rico, where 83% injected speedball. Daily injection drug use was most commonly reported among participants who injected heroin (73%) and least commonly reported among those who injected methamphetamine (16%) or other/multiple drugs (10%). Among participants who injected heroin, the percentage who injected daily was higher among participants aged 18–29 years (77%) than among those aged 40–49 years (72%), 50–59 years (70%), and ≥60 years (70%) and among participants with less than a high school education (75%) compared with those with more than a high school education (69%). Among participants who reported injecting speedball or cocaine or crack, the percentage of those who injected daily was higher among participants with less than a high school education than among those with more than a high school education and among participants whose household income was at or below federal poverty level compared with those whose household income was above the federal poverty level.
For drug categories other than heroin (and other/multiple because of suppressed data), the percentage of participants who injected daily was higher among participants with positive HIV test results than among those with negative results (Table 3). The largest difference in HIV test results among participants who injected daily was among those who injected speedball; 49% of participants who tested positive injected speedball daily, compared with 37% of those who tested negative.
A substantial percentage of participants reported each of three injection behaviors related to acquisition risk for HIV and other bloodborne viruses: receptive sharing of syringes (35%), receptive sharing of other injection equipment (58%), and receptive sharing of syringes to divide drugs (35%) (Table 4). The percentage of receptive sharing of syringes and equipment to inject drugs was highest among participants aged 18–29 years and those who had been arrested during the past year. Compared with white and Hispanic or Latino participants, black participants reported less frequent receptive sharing of syringes, other equipment, and syringes to divide drugs. Receptive sharing of syringes and other equipment decreased with age. Except for the "other drug most frequently injected" category, little variation was found in the percentage of participants reporting receptive syringe sharing by drug most frequently injected; however, a high percentage of participants who had most frequently injected heroin and cocaine (separately with the same frequency or together as speedball) receptively shared other injection equipment (63%). Participants who reported having unprotected vaginal sex, unprotected anal sex, or multiple opposite-sex partners in the past year more commonly engaged in any receptive sharing (67%, 76%, and 70%, respectively) than those who did not engage in these sex behaviors (49%, 57%, and 53% respectively). Of all 9,652 participants, 78% reported unprotected vaginal or anal sex with opposite-sex partners and receptive sharing of any injection equipment.
Although only a slight variation was found based on HIV test results, the percentages of receptive sharing of syringes, of other injection equipment, and of syringes for dividing drugs were high among participants with positive HIV test results (35%, 60%, and 38%, respectively) (Table 4). Generally, no differences were observed based on HCV testing; however, the percentages of the three injection-related risk behaviors were higher among participants reporting a diagnosis of HCV infection than among those who did not.
Sexual Behavior
A total of 84% of men (Table 5) and 83% of women (Table 6) had oral, vaginal, or anal sex with an opposite-sex partner during the past 12 months.
Sexual Behavior Among Men
Among men, 70% reported engaging in unprotected vaginal sex with female partners, and this percentage decreased with age (Table 5). One third (33%) reported anal sex with female partners during the past 12 months, and one fourth (25%) reported unprotected anal sex. The percentage of men reporting anal sex with female partners decreased with age. More men who had been arrested during the past 12 months reported anal sex with female partners (37%) compared with men who had not been arrested (30%). A higher percentage of male participants reported unprotected vaginal or anal sex with main (48%) female partners than with casual (33%) or exchange (13%) female partners (Table 7).
Ten percent of men reported having oral or anal sex with a male partner during the past 12 months (Table 5), and 2.5% reported having oral or anal sex with a male partner exclusively (i.e., did not have female partners). Unprotected anal sex with a male partner was reported by 5% of men (Table 5). The percentage of men who reported having had anal sex with a male partner was highest among those who most frequently injected methamphetamine (21%) compared with other drugs (heroin alone, 5%; heroin and cocaine, 7%; cocaine or crack alone, 14%; other, 13%). The percentage of men who reported having anal sex with a male partner was higher among those with positive HIV test results (20%) than among those with negative results (7%).
Sexual Behavior Among Women
Among women, 73% reported engaging in unprotected vaginal sex with male partners during the past 12 months (Table 6). The percentage who reported having unprotected vaginal sex decreased with age. Overall, 21% of female participants reported having unprotected anal sex during the past 12 months, and this percentage decreased with age. The percentage of women who reported unprotected vaginal and anal sex was higher among those who had been arrested during the past 12 months (79% and 26%, respectively) than among those who had not (70% and 19%, respectively). A higher percentage of women had unprotected vaginal or anal sex with main (57%) than with casual (19%) and exchange (21%) partners (Table 8). Among women who tested HIV-positive, 38% engaged in unprotected vaginal or anal sex with main partners, and 30% had unprotected vaginal or anal sex with exchange partners, compared with 58% and 21% of among women who tested HIV-negative, respectively.
Alcohol and Noninjection Drug Use
Alcohol and noninjection drug use was common among participants (Table 9). When asked about alcohol use during the 30 days before the interview, 66% of participants reported consuming alcohol, 41% reported binge drinking, and 28% reported heavy alcohol use. Most (74%) participants reported noninjection drug use during the past 12 months; 48% reported using marijuana, and 48% reported using crack during this time. Alcohol use was more commonly reported by black participants (73%) than whites (61%) and Hispanics or Latinos (58%), and noninjection drug use was most common among whites in all categories except noninjection use of heroin, crack, and methamphetamine. Noninjection drug use (of all drugs except crack) decreased with age, whereas alcohol use did not vary with age.
STDs and Hepatitis
A total of 679 (7%) participants had an STD diagnosed during the past 12 months (Table 10). Across cities, the percentage of any STD diagnosis ranged from 4% (Chicago, Illinois; San Francisco, California; and Seattle, Washington) to 24% (Nassau-Suffolk, New York). A total of 124 (1%) participants had received a diagnosis of syphilis, 118 (1%) with herpes, 216 (2%) with gonorrhea, and 208 (2%) with chlamydia (Tables 10 and 11). Of those with an STD diagnosis during the past 12 months, 151 (22%) reported two or more STD diagnoses. Diagnosis of any STD was also examined by sexual behaviors; participants who reported having sex with exchange partners during the past 12 months had a higher percentage of STD diagnoses (12%) than those who did not (5%).
Having ever received HCV testing (i.e., told that they had HCV infection or had ever been tested for HCV infection) was reported by 74% of participants, and 41% reported having received a diagnosis of HCV infection (Table 12). Lifetime HCV testing increased with age and was reported in higher percentages among participants who were white, American Indian/Alaska Native, and other races/ethnicities than by those who were black or Hispanic or Latino. Variation in diagnoses of HCV infection by age and race/ethnicity were similar to those reported for lifetime HCV testing. The percentage of participants reporting an HCV infection diagnosis increased with age, ranging from 26% among participants aged 18–29 years to 53% among participants aged ≥60 years. Diagnosis of HCV infection varied by race/ethnicity, with American Indian/Alaska Native (55%), white (47%), and other (46%) participants reporting the highest percentages. Participants who reported most frequently injecting heroin or heroin and cocaine (injected separately with the same frequency or together as speedball) during the past 12 months had higher percentages of HCV infection diagnoses (42% and 43%, respectively) than those who most frequently injected cocaine/crack and methamphetamine (30% and 30%, respectively). Diagnosis of HCV infection was higher among participants who engaged in receptive sharing of syringes, of other injection equipment, and of syringes to divide drugs during the past 12 months (44%, 44%, and 45%, respectively) than among those who did not engage in these receptive sharing behaviors (39%, 36%, and 38%, respectively) (Table 12). Overall, 29% of participants reported receiving at least 1 dose of HAV vaccine, HBV vaccine, or both.
Use of Prevention Services and Programs
HIV Testing
Most participants (88%) had been tested for HIV infection during their lifetime, and many (49%) had been tested during the past 12 months (Table 13). Receipt of an HIV test during the past 12 months was reported in higher percentages among participants who reported the following characteristics than among those who did not: had a household income above the federal poverty level (53% versus 47%), visited a health-care provider during the past 12 months (55% versus 33%), and had been arrested during the past 12 months (56% versus 44%). Having had an HIV test during the past 12 months also varied by health insurance status; 54% of participants who had a public health insurance plan reported being tested in the past year, compared with 45% with private insurance and 44% with no health insurance (Table 13). Overall, the majority (92%) of participants who were tested during the past 12 months reported receiving their test results.
Among 4,689 participants who reported having had an HIV test during the past 12 months (for whom information was available), the top six types of facilities where they had received their most recent HIV test were: public health clinics or community health centers (14%); correctional facilities (jails or prisons) (14%); hospitals (inpatient) (12%); HIV/AIDS street outreach programs and mobile units (11%); drug treatment programs (11%); and HIV counseling and testing sites (10%) (Table 14). The most commonly reported type of facility in which men received their most recent HIV test was in a correctional setting (16%), whereas most women received their most recent HIV test in a public health clinic or community health center (15%).
Among 4,916 participants who reported not having had an HIV test during the past 12 months, the most frequently reported main reason was being afraid of finding out they had HIV (32%), followed by the thought that they were at low risk for HIV infection (25%) (Table 15). Although participants reported structural barriers to HIV testing during the past 12 months, such as lack of transportation and not having money or health insurance, these were not frequently reported as main reasons (1% and 6%, respectively) for not being tested (Table 15).
Prevention Materials
Forty-four percent of participants received free sterile syringes, 41% received other free injection equipment (e.g., cookers, cotton, or water), and 50% received free condoms (Table 16). Receipt of free syringes and other injection equipment during the past 12 months was reported in higher percentages by participants who most frequently injected heroin compared with other drugs or combinations of drugs and who injected more than once a day compared with less frequently (Table 17). Receipt of free sterile syringes was reported less frequently by participants who receptively shared syringes (38%) than by those who did not share syringes to inject drugs (47%). Likewise, receipt of other free injection equipment was reported less frequently by those who shared syringes (35%) than by those who did not (44%). In addition, receipt of free sterile syringes was reported less frequently by participants who shared syringes to divide drugs (40%) than by those who did not (46%), and receipt of other free injection equipment was reported less frequently by those who shared syringes to divide drugs (37%) than by those who did not (42%).
Treatment and Behavioral Interventions for Alcohol and Drug Use
Overall, 33% of participants reported being in an alcohol or a drug treatment program during the past 12 months (Table 16). Participating in an alcohol or a drug treatment program was lower among black than white (28% versus 41%) participants and decreased with age. Less than one fourth (21%) of participants received either an individual-level (17%) or group-level (9%) behavioral intervention during the past 12 months. The percentage of those participating in individual- or group-level HIV behavioral interventions was lower among participants with no health insurance (17%) than among those with public (26%), private (27%), or other/multiple sources of health insurance (25%); the percentage was higher among those who participated in an alcohol or a drug treatment program during the past 12 months (33%) than among those who had never participated in such a program (12%). Among 1,633 participants receiving individual-level interventions, an HIV-focused community-based organization was the type of program from which the highest percentage (36%) of participants received these services, whereas among 904 persons reporting group-level interventions, a drug treatment program was the type of program from which the highest percentage (38%) received these services (Table 18).
Discussion
HIV Infection
The percentage of all participants in NHBS-IDU2 with HIV infection was 9%, ranging from 2% to 19% among MSAs. HIV testing was not conducted during the first cycle of NHBS-IDU; therefore, the analysis of NHBS-IDU2 data represents the first large assessment of HIV prevalence among IDUs in the United States in more than a decade. During 1993–1997, CDC conducted anonymous HIV testing among IDUs entering drug treatment centers in 14 MSAs (22) and found an HIV infection prevalence of 18% overall, ranging from 1% to 37% among MSAs. The two studies used different methods and sampled different populations of IDUs; therefore, the HIV infection estimates are not comparable between the studies.
In the NHBS-IDU2 study, HIV infection was highest among participants who most frequently injected methamphetamine and among men who reported male-to-male sex during the past 12 months. Methamphetamine use has been linked with high-risk sexual behavior among heterosexuals (23) and MSM (24). In this analysis, a high percentage of men who most frequently injected methamphetamine reported having had unprotected anal sex with another man during the past 12 months. The combination of male-to-male sex and drug injection contribute to the high HIV prevalence among MSM-IDUs (25). HIV prevention programs tailored to MSM-IDUs should consider the possible effects of methamphetamine use on risk-taking behaviors.
HIV infection was higher among participants who reported never having been tested for HIV than among those who did. CDC recommends that IDUs be tested for HIV at least annually (26,27). The high percentage of HIV infection among the NHBS-IDU2 participants who had never been tested suggests that substantial barriers to increasing awareness of HIV status remain, especially among those who are most at risk for infection. Continued efforts are needed to reach IDUs with HIV testing, provide results of HIV testing, provide prevention services, and reduce the stigma associated with HIV.
Injection Drug Use
Consistent with the first NHBS-IDU cycle conducted during 2005–2006 (8) and other national surveys of drug use (28,29), the majority of participants in this survey injected heroin, and most injected the drug daily. The percentage of participants who injected heroin daily was higher among younger age groups and among those with lower education levels. Injection behaviors that increase risk for HIV infection were common in this survey; 35% of participants reported receptive sharing of syringes, and 58% reported receptive sharing of other injection equipment (e.g., cookers, cotton, or water). These data are similar to findings from the first NHBS-IDU cycle in which 36% of participants reported sharing syringes, and 62% reported sharing other injection equipment (8).
IDUs who engage in frequent or unsafe injections are at increased risk for acquiring and transmitting HIV and other chronic bloodborne infections, including HBV and HCV (30–33). Using sterile needles and syringes and other injection equipment only once remains the safest, most effective way to limit HIV transmission (34). NHBS findings support the need to strengthen prevention efforts to discourage use of contaminated syringes and other equipment to prepare drugs to prevent transmission of bloodborne viruses among IDUs (16–19). Consistent with other studies of IDUs (35,36), young participants commonly engaged in risky injection behaviors, indicating that more targeted prevention efforts for younger IDUs might be needed. NHBS-IDU2 black participants engaged in less risky injection practices than white IDUs. However, blacks had a higher prevalence of HIV infection; additional research is needed to understand this finding (37,38). Previous studies also have found that those who inject cocaine and speedball are more likely to be infected with HIV and HCV (39–41). In NHBS-IDU2, participants who injected heroin and cocaine (injected separately with the same frequency or together as speedball) commonly engaged in receptive sharing of injection equipment other than syringes, a behavior that has been linked to HCV transmission (19,42). Participants who reported receiving a previous diagnosis of HCV infection reported receptive sharing of syringes to inject or to divide drugs and receptive sharing of other injection equipment in higher percentages than those who did not report a previous HCV diagnosis. Previous studies have shown that awareness of HCV status might not deter injection risk practices (43–46).
Sexual Behavior
IDUs can be exposed to HIV not only through unsafe injection practices but also from unprotected sex with an HIV-infected person (47–50). NHBS-IDU2 data indicate that a substantial percentage of participants reported unprotected sex with main and casual partners. Some effective behavioral interventions for IDUs include messages on the risk of unprotected sex with all sex partners (51,52). Among male IDUs, unprotected anal sex with a male partner is associated with an increased risk for infection (47,48). In NHBS-IDU2, 10% of men reported any sex with another man, and 5% reported engaging in unprotected anal sex with a male partner; a higher percentage of men with positive HIV test results reported having unprotected anal sex with male partners than did men with negative HIV results. A combination of effective, scalable, and evidence-based approaches for IDUs that address male-to-male sex behaviors might reduce HIV infections among MSM/IDUs (53). In addition, because one in five women reported having unprotected anal sex, these women might benefit from messages about anal sex and risk associated with unprotected anal sex. Furthermore, approximately one third of female participants in NHBS-IDU2 reported having male exchange-sex partners, and of these, most reported having unprotected vaginal or anal sex with male exchange partners. Finally, a higher percentage of women with positive HIV test results engaged in unprotected exchange sex compared with women with negative HIV test results. Others have suggested that HIV prevention efforts among female sex workers must address drug use, including injection drug use, in addition to unsafe sex practices (54).
Alcohol and Noninjection Drug Use
Use of alcohol by IDUs has been associated with increased drug- and sex-related risk behaviors (55–57). Noninjection drug use, particularly crack (58), methamphetamine (59,60), and polydrug (60,61) use, also have been found to increase risk for HIV transmission among IDUs. In this survey, alcohol and noninjection drug use was reported by the majority of participants; noninjected crack was the most commonly reported drug used by participants after marijuana, and many reported using methamphetamine. HIV prevention interventions for IDUs might benefit from strengthened efforts to reduce risk behaviors related to alcohol and noninjection drug use, in addition to reducing injection-related risks and improving access to and participation in alcohol and drug treatment programs.
STDs and Hepatitis
IDUs are at risk for STDs through risky sexual practices, and STDs can increase the likelihood of acquiring HIV (62). Other studies have found the prevalence of STDs (i.e., chlamydia, gonorrhea, and syphilis) among IDUs to range from approximately 1% to 6% (63–65). In this report, the percentage of participants reporting a diagnosis of any particular STD was 7%, which is lower than what was reported during the previous NHBS-IDU cycle (13%) (8). However, the percentage of STD diagnoses varied considerably by MSA (4%–24%). One fourth of IDUs who reported having an STD diagnosis during the past 12 months reported having received diagnoses for multiple STDs, suggesting concerning levels of high-risk sexual behaviors. Furthermore, the percentage of participants reporting an STD diagnosis was more than twice as high among participants who reported having had sex with exchange partners compared with those who did not. High levels of STD diagnoses among IDUs who engage in exchange sex also have been reported elsewhere (54,66). Screening recommendations for STDs are updated regularly (26). Although no specific STD screening recommendations exist for IDUs (other than for HBV), the CDC STD treatment guidelines recommend that high-intensity behavioral counseling, including assessment of injection drug use and engaging in exchange sex, be provided to all adolescents and adults at increased risk for STDs and HIV (26).
In the United States, surveillance for acute viral hepatitis in 2007 indicated that injection-drug use is the primary risk factor for 48% of persons infected with HCV (67). Engaging in unsafe drug injection practices increases the risk for acquiring and transmitting both HIV and HCV (68). In patients who are infected both with HIV and HCV, the HIV infection accelerates the progression of HCV-related disease (69,70). In this survey, 41% of participants reported a previous HCV diagnosis, which is considerably higher than the 1.6% estimated prevalence of HCV infection in the general U.S. population (71). Approximately one fourth of participants reported that they had neither received a diagnosis of HCV nor been tested for HCV, and half of participants who did not know their HCV status reported never being tested for HCV infection. Furthermore, approximately one third of the participants reported ever receiving at least 1 dose of a vaccine for HAV, HBV, or both. CDC recommends routine HCV testing for persons who inject or ever injected drugs (72); these recommendations were expanded in 2012 to include one-time HCV testing for adults born during 1945–1965, regardless of their risk for infection (73).
Use of HIV Prevention Services and Programs
HIV Testing
HIV-infected persons must know their HIV infection status to seek and receive treatment, which can lower viral load, improve health outcomes, and reduce the likelihood of HIV transmission. Therefore, CDC recommends that IDUs be tested for HIV infection at least annually (26,27). In 2006, CDC revised its recommendations for HIV testing in health-care settings to promote routine, opt-out screening in all health-care settings to increase HIV screening of patients to detect HIV infection earlier in the course of infection and emphasized the importance of linking persons with previously undiagnosed infection to HIV care and prevention services (27). Although lifetime HIV testing rates among IDUs in this report were high, only approximately half of the participants reported having been tested during the past 12 months. Even more concerning, this number represents a decrease in HIV testing among IDUs when compared with NHBS-IDU1, in which 66% reported HIV testing during the past 12 months (8). To increase the percentage of IDUs who are tested annually, CDC expanded its enhanced HIV testing initiative for disproportionately affected populations, including IDUs, to support strategies that increase the percentage of HIV-infected persons in these populations who are aware of their infection and are linked to appropriate services (74).
Current recommendations include initiating HIV treatment early in the course of the infection, before symptoms develop (27). Prevention in IDUs includes seek, test, treat, and retain strategies (57). More than one third of participants in this survey reported having been arrested during the past 12 months, and jails and prisons were among the most commonly reported facilities where participants received HIV testing. Because of the relatively high rates of incarceration among IDUs noted in this and other analyses (75,76) and the difficulty in reaching this population, prisons play an important role in identifying, testing, and linking HIV-positive IDUs to treatment (77). The National Institutes of Health is supporting large research efforts to prevent and treat HIV/AIDS among persons in criminal justice systems across the United States (78).
Understanding the reasons that persons do not seek testing in both clinical and nonclinical settings is an important component of HIV prevention strategies. The top reasons reported by NHBS-IDU2 participants for not being tested for HIV during the past 12 months were fear of finding out they had an HIV infection and a perception of being at low risk for HIV infection. Thus, efforts to increase annual HIV testing among IDUs would benefit from strengthening strategies that address fear and stigma associated with HIV testing and that increase awareness of personal risk. Although not reported as the main reason for not testing for HIV in the past 12 months, social and structural barriers (e.g., did not have money or health insurance) were commonly mentioned. Research to understand additional social and structural barriers to HIV testing might further inform efforts to increase annual HIV testing among IDUs. In addition, integrating the provision of HIV testing with the delivery of other prevention and health-care services for IDUs, including substance abuse treatment, syringe services programs, and risk reduction interventions, can increase access to and timeliness of HIV testing and treatment (79).
Prevention Materials
Access to prevention materials such as condoms and sterile injection equipment is an important tool in preventing HIV infection and is consistent with the National HIV/AIDS Strategy. The availability of condoms has been associated with increased condom use (80), and using sterile injection equipment only once remains the safest, most effective way to limit HIV transmission (34). Compared with NHBS-IDU1, a similar percentage of participants in this survey reported receipt of free sterile syringes (44% versus 41%) and free injection equipment (41% versus 38%); receipt of free condoms was lower in the current survey compared with NHBS-IDU1 (51% versus 57%) (8).
Treatment and Behavioral Interventions for Alcohol and Drug Use
Substance abuse treatment programs, including alcohol abuse, opiate dependence, methadone, and buprenorphine/naloxone, have been recognized as a mainstay for HIV prevention among IDUs (57). In addition, substance abuse treatment programs can serve as an entry point to HIV care and treatment and can lead to improved adherence to medical treatment regimens (81,82). However, only one third of participants in this survey reported having been in alcohol or drug treatment programs during the past year, which is similar to that reported in NHBS-IDU1 (36%) (8). Behavioral interventions can reduce risky sexual and drug use behaviors and thus decrease the likelihood of acquiring HIV (52). In this survey, 21% of participants reported participating in individual- or group-level behavioral interventions during the past year. Individual- and group-level behavioral interventions with demonstrated effectiveness can play an important role in comprehensive HIV prevention strategies (83). To effectively respond to the evolving challenges of the HIV epidemic among IDUs and their sex partners, understanding trends in HIV risk behaviors and in use of HIV prevention programs in this population is essential. NHBS will be able to provide updated data regarding the delivery of the HIV prevention services and programs to the populations who need them most. A high-impact approach for expanded HIV prevention for IDUs is suggested, which includes a combination of cost-effective evidence-based biomedical, behavioral, and structural approaches that are able to increase access to and use of HIV testing, care, and treatment and to prevention services to achieve the greatest possible reductions in HIV incidence and HIV-related disparities. A combination prevention approach for IDUs also includes prevention and treatment of other infectious diseases, including STDs and HBV and HCV infections (84), thus integration of multiple service programs for IDUs might increase the effectiveness of HIV prevention efforts (79).
Limitations
The findings in this report are subject to several limitations. First, the survey design might be subject to selection bias because a single standard for obtaining a representative sample of IDUs in the United States has yet to be established. The RDS method is used to produce estimates for hard-to-reach populations when sampling frames of the individual members of those populations do not exist or are difficult to construct. However, the data in this report are not weighted to account for variations in recruitment pattern, network size, or likelihood of being selected to participate in the survey. Second, the data in this report might not be representative of all IDUs living in an MSA because some drug-injection networks might not have been reached during recruitment. For example, IDUs who are not socially connected to other IDUs might not be included in the sample. Third, findings from the MSAs included in this report might not be generalizable to the states in which they are located or to other cities in the United States. Fourth, findings in this report are subject to limitations of cross-sectional data, thus temporality cannot be established. Fifth, because the survey was administered by an interviewer, certain behaviors might have been underreported or overreported. For example, participants might have underreported socially undesirable behaviors (e.g., sharing syringes) or overreported socially desirable behaviors (e.g., condom use). Sixth, reported STD and HCV diagnoses in this survey are subject to availability and access to STD and hepatitis testing. For example, variations in the percentage of STD diagnoses by MSA might be related to local STD testing policies rather than reflecting true variations in STD rates. Seventh, receipt of hepatitis vaccination, HCV diagnosis, and HCV testing might have been underreported or overreported depending on the participants' knowledge of the different hepatitis types, social desirability, and accuracy in recall. Furthermore, the survey did not ask about the number of vaccine doses received. Eighth, in some instances, stratification by some variables might have produced numbers that were too small for reliable interpretation. Ninth, because statistical tests were not performed, differences in behaviors between groups should be interpreted with caution. Finally, caution should be used when comparing these numbers with previous NHBS-IDU data (8,9). The percentages reported in this report might have been influenced by differences in the survey instruments (e.g., the definition of casual partner), in the use of weighted (9) versus unweighted data, and the participation of three MSAs in the first (8) but not the second NHBS-IDU cycle.
Conclusion
The White House Office of National AIDS Policy coordinates government efforts to reduce the number of HIV infections in the United States. A national strategy was developed in 2010 to address the domestic HIV epidemic (4). The primary objectives of the National HIV/AIDS Strategy are to reduce the incidence of HIV infection, increase access to care and optimize health outcomes for persons living with HIV infection, and reduce HIV-related health disparities. One important step in achieving the strategy's goal of a 25% reduction in new infections by 2015 is for HIV programs across the federal government and among state and local governments to coordinate intensified HIV prevention efforts in the communities where HIV infection rates are the highest (e.g., specific geographic areas and among populations as high risk for infection, such as IDUs) using a combination of effective evidence-based approaches. In addition, state and local health departments as well as federal agencies are expected to monitor progress toward the strategy's goals. A nationally united effort and strategy will help reduce the effects of HIV in groups at risk, including IDUs.
CDC's high-impact HIV prevention approach (available at http://www.cdc.gov/hiv/strategy) is a key approach toward achieving the goals of the national strategy. Consistent with the strategy, effective HIV prevention strategies for IDUs, include HIV testing and linkage to care, prevention and care for HIV-infected IDUs, and policies supporting access to sterile injection equipment. In addition to the National HIV/AIDS Strategy, recent efforts to improve health-care could serve as a structural intervention to prevent HIV infection. Ongoing changes in the U.S. health-care system offer opportunities to improve the use of clinical preventive services by persons who inject drugs. The Patient Protection and Affordable Care Act of 2010 (as amended by the Healthcare and Education Reconciliation Act of 2010 and referred to collectively as the Affordable Care Act [ACA]) expands insurance coverage, consumer protections, and access to primary care and emphasizes prevention in addition to care and treatment (http://aids.gov/federal-resources/policies/health-care-reform). CDC is committed to exploring the integration of these services to further improve the delivery of health services to persons with multiple risks (available at http://www.cdc.gov/nchhstp/programintegration) and has prioritized the development of programs that take social determinants of health into consideration to promote health equity (available at http://www.cdc.gov/socialdeterminants).
Multiple indicators are relevant to HIV risk and prevention among IDUs of various backgrounds. A better understanding of the behaviors and circumstances associated with HIV transmission can improve the development of appropriate prevention responses. Data from NHBS can be used to monitor specific risk behaviors, HIV testing experiences, and use of prevention programs; identify the demographic and behavioral correlates of risk; and direct future prevention activities to reduce HIV transmission and acquisition. Thus, NHBS is a key component of CDC's comprehensive approach to reducing the spread of HIV in the United States and will continue to be the primary source of data for monitoring behaviors of populations at high risk for HIV infection.
References
- CDC. Monitoring selected national HIV prevention and care objectives by using HIV surveillance data—United States and 6 U.S. dependent areas—2010. HIV Surveillance Supplemental Report. Vol. 17, No. 3 (part A). Atlanta, GA: CDC; 2012. Available at http://www.cdc.gov/hiv/pdf/statistics_2010_HIV_Surveillance_Report_vol_17_no_3.pdf.
- CDC. Estimated HIV incidence in the United States, 2007–2010. HIV Surveillance Supplemental Report. Vol. 17, No. 4. Atlanta, GA: CDC; 2012 Available at http://www.cdc.gov/hiv/pdf/statistics_hssr_vol_17_no_4.pdf.
- Lansky A, Finlayson T, Johnson C, et al. Estimating the number of persons who inject drugs in the United States by meta-analysis to calculate national rates of HIV and hepatitis C virus infections. PLoS ONE 2014;9:e97596.
- The White House, Office of National AIDS Policy. National HIV/AIDS strategy for the United States. Washington, DC: The White House, Office of National AIDS Policy; 2010. Available at http://www.whitehouse.gov/administration/eop/onap/nhas.
- Gallagher KM, Sullivan PS, Lansky A, Onorato IM. Behavioral surveillance among people at risk for HIV infection in the U.S.: the National HIV Behavioral Surveillance System. Public Health Rep 2007;122(Suppl 1):32–8.
- Dinenno EA, Oster AM, Sionean C, Denning P, Lansky A. Piloting a system for behavioral surveillance among heterosexuals at increased risk of HIV in the United States. Open AIDS J 2012;6:169–76.
- CDC. High-impact HIV prevention: CDC's approach to reducing HIV infections in the United States. Atlanta, GA: CDC. Available at http://www.cdc.gov/hiv/pdf/policies_NHPC_Booklet.pdf.
- CDC. Risk, prevention, and testing behaviors related to HIV and hepatitis infections—National HIV Behavioral Surveillance System: injecting drug users, May 2005–February 2006. HIV Special Surveillance Report 7. Atlanta, GA: CDC; 2011. Available at http://www.cdc.gov/hiv/pdf/statistics_hiv_surveillance_special_report_no_7.pdf.
- CDC. HIV infection and HIV-associated behaviors among injecting drug users—20 cities, United States, 2009. MMWR 2012;61:133–8.
- CDC. Diagnoses of HIV infection and AIDS in the United States and dependent areas. HIV Surveillance Report, 2010. Vol 22. Atlanta, GA: CDC; 2012. Available at http://www.cdc.gov/hiv/surveillance/resources/reports/2010report/pdf/2010_HIV_Surveillance_Report_vol_22.pdf.
- Allen DR, Finlayson T, Abdul-Quader A, Lansky A. The role of formative research in the National HIV Behavioral Surveillance System. Public Health Rep 2009;124:26–33.
- Lansky A, Abdul-Quader AS, Cribbin M, et al. Developing an HIV behavioral surveillance system for injecting drug users: the National HIV Behavioral Surveillance System. Public Health Rep 2007;122(Suppl 1):48–55.
- Gibson DR, Lovelle-Drache J, Young M, Hudes ES, Sorensen JL. Effectiveness of brief counseling in reducing HIV risk behavior in injecting drug users: Final results of randomized trials of counseling with and without HIV testing. AIDS Behav 1999;3:3–12.
- Marks G, Crepaz N, Senterfitt JW, Janssen RS. Meta-analysis of high-risk sexual behavior in persons aware and unaware they are infected with HIV in the United States: implications for HIV prevention programs. J Acquir Immune Defic Syndr 2005;39:446–53.
- US Department of Health and Human Services. 2009 HHS federal poverty guidelines. Fed Regist 2009;74:4199–201 Available at http://aspe.hhs.gov/poverty/09poverty.shtml.
- Needle RH, Coyle S, Cesari H, et al. HIV risk behaviors associated with the injection process: multiperson use of drug injection equipment and paraphernalia in injection drug user networks. Subst Use Misuse 1998;33:2403–23.
- Page JB, Shapshak P, Duran EM, et al. Detection of HIV-1 in injection paraphernalia: risk in an era of heightened awareness. AIDS Patient Care STDS 2006;20:576–85.
- De P, Roy E, Boivin JF, Cox J, Morissette C. Risk of hepatitis C virus transmission through drug preparation equipment: a systematic and methodological review. J Viral Hepat 2008;15:279–92.
- Hagan H, Pouget ER, Williams IT, et al. Attribution of hepatitis C virus seroconversion risk in young injection drug users in 5 U.S. cities. J Infect Dis 2010;201:378–85.
- Grund JP, Stern LS, Jose B, Neaigus A, Curtis R, Des Jarlais DC. Syringe-mediated drug sharing among injecting drug users: patterns, social context and implications for transmission of blood-borne pathogens. Soc Sci Med 1996;42:691–703.
- CDC. CDC HIV evaluation: program performance indicators. Atlanta, GA: CDC; 2012. Available at http://www.cdc.gov/hiv/policies/evaluation.html#projects.
- CDC. HIV prevalence trends in selected populations in the United States: results from national serosurveillance, 1993–1997. Atlanta, GA: CDC; 2001. Available at http://www.cdc.gov/hiv/pdf/statistics_1993_1997_HIVPrevalence.pdf.
- CDC. Methamphetamine use and HIV risk behaviors among heterosexual men—preliminary results from five northern California counties, December 2001–November 2003. MMWR 2006;55:273–7.
- Mansergh G, Purcell DW, Stall R, et al. CDC consultation on methamphetamine use and sexual risk behavior for HIV/STD infection: summary and suggestions. Public Health Rep 2006;121:127–32.
- CDC. HIV/AIDS among men who have sex with men and inject drugs—United States, 1985–1998. MMWR 2000;49:465–70.
- CDC. Sexually transmitted diseases treatment guidelines, 2010. MMWR 2010;59(No. RR-12).
- CDC. Revised recommendations for HIV testing of adults, adolescents, and pregnant women in health-care settings. MMWR 2006;55(No. RR-14).
- Substance Abuse and Mental Health Services Administration, Center for Behavioral Health Statistics and Quality. The TEDS Report. Injection drug abuse admissions to substance abuse treatment: 1992 and 2009. Rockville, MD: Substance Abuse and Mental Health Services Administration, Center for Behavioral Health Statistics and Quality; 2011. Available at http://www.samhsa.gov/data/2k11/WEB_TEDS_012/Injection_Drug_Abuse.pdf.
- Substance Abuse and Mental Health Services Administration, Office of Applied Studies. The NSDUH report: injection drug use and related risk behaviors. Rockville, MD: Substance Abuse and Mental Health Services Administration; 2009. Available at http://www.samhsa.gov/data/2k9/139/139IDU_HTML.pdf.
- Doherty MC, Garfein RS, Monterroso E, Brown D, Vlahov D. Correlates of HIV infection among young adult short-term injection drug users. AIDS 2000;14:717–26.
- Hagan H, Thiede H, Des Jarlais DC. Hepatitis C virus infection among injection drug users: survival analysis of time to seroconversion. Epidemiology 2004;15:543–9.
- Thorpe LE, Ouellet LJ, Levy JR, Williams IT, Monterroso ER. Hepatitis C virus infection: prevalence, risk factors, and prevention opportunities among young injection drug users in Chicago, 1997–1999. J Infect Dis 2000;182:1588–94.
- Des Jarlais DC, Semaan S. HIV prevention for injecting drug users: the first 25 years and counting. Psychosom Med 2008;70:606–11.
- CDC. Drug-associated HIV transmission continues in the United States. Atlanta, GA: CDC; 2002. Available at http://www.cdc.gov/hiv/resources/factsheets/PDF/idu.pdf.
- Rondinelli AJ, Ouellet LJ, Strathdee SA, et al. Young adult injection drug users in the United States continue to practice HIV risk behaviors. Drug Alcohol Depend 2009;104:167–74.
- Hahn JA, Evans JL, Davidson PJ, Lum PJ, Page K. Hepatitis C virus risk behaviors within the partnerships of young injecting drug users. Addiction 2010;105:1254–64.
- Estrada AL. Health disparities among African-American and Hispanic drug injectors–HIV, AIDS, hepatitis B virus and hepatitis C virus: a review. AIDS 2005;19(Suppl 3):S47–52.
- Des Jarlais DC, McCarty D, Vega WA, Bramson H. HIV infection among people who inject drugs: the challenge of racial/ethnic disparities. Am Psychol 2013;68:274–85.
- Ropelewski LR, Mancha BE, Hulbert A, Rudolph AE, Martins SS. Correlates of risky injection practices among past-year injection drug users among the U.S. general population. Drug Alcohol Depend 2011;116:64–71.
- Kral AH, Bluthenthal RN, Booth RE, Watters JK. HIV seroprevalence among street-recruited injection drug and crack cocaine users in 16 US municipalities. Am J Public Health 1998;88:108–13.
- Bruneau J, Daniel M, Abrahamowicz M, Zang G, Lamothe F, Vincelette J. Trends in human immunodeficiency virus incidence and risk behavior among injection drug users in Montreal, Canada: a 16-year longitudinal study. Am J Epidemiol 2011;173:1049–58.
- Thorpe LE, Ouellet LJ, Hershow R, et al. Risk of hepatitis C virus infection among young adult injection drug users who share injection equipment. Am J Epidemiol 2002;1:155:645–53.
- Hagan H, Campbell J, Thiede H, et al. Self-reported hepatitis C virus antibody status and risk behavior in young injectors. Public Health Rep 2006;121:710–9.
- Tsui JI, Vittinghoff E, Hahn JA, Evans JL, Davidson PJ, Page K. Risk behaviors after hepatitis C virus seroconversion in young injection drug users in San Francisco. Drug Alcohol Depend 2009;105:160–3.
- Cox J, Morissette C, De P, et al. Access to sterile injecting equipment is more important than awareness of HCV status for injection risk behaviors among drug users. Subst Use Misuse 2009;44:548–68.
- Korthuis PT, Feaster DJ, Gomez ZL, et al. Injection behaviors among injection drug users in treatment: the role of hepatitis C awareness. Addict Behav 2012;37:552–5.
- Kral AH, Bluthenthal RN, Lorvick J, Gee L, Bacchetti P, Edlin BR. Sexual transmission of HIV-1 among injection drug users in San Francisco, USA: risk-factor analysis. Lancet 2001;357:1397–401.
- Strathdee SA, Galai N, Safaiean M, et al. Sex differences in risk factors for HIV seroconversion among injection drug users: a 10-year perspective. Arch Intern Med 2001;161:1281–8.
- Strathdee SA, Sherman SG. The role of sexual transmission of HIV infection among injection and non-injection drug users. J Urban Health 2003;80(Suppl 3):iii7–14.
- Semaan S, Des Jarlais DC, Malow R. Behavior change and health-related interventions for heterosexual risk reduction among drug users. Subst Use Misuse 2006;41:1349–78.
- Santibanez SS, Garfein RS, Swartzendruber A, Purcell DW, Paxton LA, Greenberg AE. Update and overview of practical epidemiologic aspects of HIV/AIDS among injection drug users in the United States. J Urban Health 2006;83:86–100.
- Lyles CM, Kay LS, Crepaz N, et al. Best-evidence interventions: findings from a systematic review of HIV behavioral interventions for U.S. populations at high risk, 2000–2004. Am J Public Health 2007;97:133–43.
- CDC. Estimated percentages and characteristics of men who have sex with men and use injection drugs—United States, 1999–2011. MMWR 2013;62:757–62.
- Inciardi JA, Surratt HL, Kurtz SP. HIV, HBV, and HCV infections among drug-involved, inner-city, street sex workers in Miami, Florida. AIDS Behav 2006;10:139–47.
- Stein MD, Charuvastra A, Anderson B, Sobota M, Friedmanna PD. Alcohol and HIV risk taking among intravenous drug users. Addict Behav 2002;27:727–36.
- Stein MD, Anderson B, Charuvastra A, Friedmann PD. Alcohol use and sexual risk taking among hazardously drinking drug injectors who attend needle exchange. Alcohol Clin Exp Res 2001;25:1487–93.
- Crawford ND, Vlahov D. Progress in HIV reduction and prevention among injection and noninjection drug users. J Acquir Immune Defic Syndr 2010;55(Suppl 2):S84–7.
- Booth RE, Kwiatkowski CF, Chitwood DD. Sex related HIV risk behaviors: differential risks among injection drug users, crack smokers, and injection drug users who smoke crack. Drug Alcohol Depend 2000;58:219–26.
- McKetin R, Ross J, Kelly E, et al. Characteristics and harms associated with injecting versus smoking methamphetamine among methamphetamine treatment entrants. Drug Alcohol Rev 2008;27:277–85.
- Rusch ML, Lozada R, Pollini RA, et al. Polydrug use among IDUs in Tijuana, Mexico: correlates of methamphetamine use and route of administration by gender. J Urban Health 2009;86:760–75.
- Darke S, Hall W. Levels and correlates of polydrug use among heroin users and regular amphetamine users. Drug Alcohol Depend 1995;39:231–5.
- Fleming DT, Wasserheit JN. From epidemiological synergy to public health policy and practice: the contribution of other sexually transmitted diseases to sexual transmission of HIV infection. Sex Transm Infect 1999;75:3–17.
- López-Zetina J, Ford W, Weber M, et al. Predictors of syphilis seroreactivity and prevalence of HIV among street recruited injection drug users in Los Angeles County, 1994–6. Sex Transm Infect 2000;76:462–9.
- Latka M, Ahern J, Garfein RS, et al; Collaborative Injection Drug User Study Group. Prevalence, incidence, and correlates of chlamydia and gonorrhea among young adult injection drug users. J Subst Abuse 2001;13:73–88.
- Hwang LY, Ross MW, Zack C, Bull L, Rickman K, Holleman M. Prevalence of sexually transmitted infections and associated risk factors among populations of drug abusers. Clin Infect Dis 2000;31:920–6.
- Strathdee SA, Lozada R, Semple SJ, et al. Characteristics of female sex workers with U.S. clients in two Mexico-U.S. border cities. Sex Transm Dis 2008;35:263–8.
- CDC. Surveillance for acute viral hepatitis—United States, 2007. MMWR 2009;58(No. SS-3).
- Sulkowski MS. Viral hepatitis and HIV coinfection. J Hepatol 2008;48:353–67.
- Graham CS, Baden LR, Yu E, et al. Influence of human immunodeficiency virus infection on the course of hepatitis C virus infection: a meta-analysis. Clin Infect Dis 2001;15:562–9.
- Kang W, Tong HI, Sun Y, Lu Y. Hepatitis C virus infection in patients with HIV-1: epidemiology, natural history and management. Expert Rev Gastroenterol Hepatol 2014;8:247–66.
- Armstrong GL, Wasley A, Simard EP, McQuillan GM, Kuhnert WL, Alter MJ. The prevalence of hepatitis C virus infection in the United States, 1999 through 2002. Ann Intern Med 2006;144:705–14.
- CDC. Recommendations for prevention and control of hepatitis C virus (HCV) infection and HCV-related chronic disease. MMWR 1998;47(No. RR-19).
- CDC. Recommendations for the identification of chronic hepatitis C virus infection among persons born during 1945–1965. MMWR 2012;61(No. RR-04).
- CDC. Funding opportunity announcement (FOA) PS10–10138: expanded human immunodeficiency virus (HIV) testing for disproportionately affected populations. Atlanta, GA: CDC; 2012. Available at http://www.cdc.gov/hiv/policies/funding/announcements/PS10-10138/index.html.
- Milloy MJ, Wood E, Small W, et al. Incarceration experiences in a cohort of active injection drug users. Drug Alcohol Rev 2008;27:693–9.
- Severtson SG, Latimer WW. Factors related to correctional facility incarceration among active injection drug users in Baltimore, MD. Drug Alcohol Depend 2008;94:73–81.
- Beckwith CG, Zaller ND, Fu JJ, Montague BT, Rich JD. Opportunities to diagnose, treat, and prevent HIV in the criminal justice system. J Acquir Immune Defic Syndr 2010;55(Suppl 1):S49–55.
- National Institutes of Health. Unprecedented effort to seek, test, and treat inmates with HIV. Washington, DC: US Department of Health and Human Services, National Institutes of Health; 2010. Available at http://www.nih.gov/news/health/sep2010/nida-23.htm.
- CDC. Integrated prevention services for HIV infection, viral hepatitis, sexually transmitted diseases, and tuberculosis for persons who use drugs illicitly: summary guidance from CDC and the U.S. Department of Health and Human Services. MMWR 2012;61(No. RR-5).
- Charania MR, Crepaz N, Guenther-Gray C, et al. Efficacy of structural-level condom distribution interventions: a meta-analysis of U.S. and international studies, 1998–2007. AIDS Behav 2011;15:1283–97.
- Metzger DS, Zhang Y. Drug treatment as HIV prevention: expanding treatment options. Curr HIV/AIDS Rep 2010;7:220–5.
- Stein MD, Rich JD, Maksad J, et al. Adherence to antiretroviral therapy among HIV-infected methadone patients: effect of ongoing illicit drug use. Am J Drug Alcohol Abuse 2000;26:195–205.
- CDC. 2009 Compendium of evidence-based HIV prevention interventions. Atlanta, GA: CDC; 2011. Available at http://www.cdc.gov/hiv/topics/research/prs/evidence-based-interventions.htm.
- Donoghoe MC, Verster A, Pervilhac C, Williams P. Setting targets for universal access to HIV prevention, treatment and care for injecting drug users (IDUs): towards consensus and improved guidance. Int J Drug Policy 2008;19(Suppl 1):S5–14.
National HIV Behavioral Surveillance System Study Group
Jennifer Taussig, Shacara Johnson, Jeff Todd, Atlanta, Georgia; Colin Flynn, Danielle German, Baltimore, Maryland; Debbie Isenberg, Maura Driscoll, Elizabeth Hurwitz, Boston, Massachusetts; Nikhil Prachand, Nanette Benbow, Chicago, Illinois; Sharon Melville, Richard Yeager, Jim Dyer, Alicia Novoa, Dallas, Texas; Mark Thrun, Alia Al-Tayyib, Denver, Colorado; Emily Higgins, Eve Mokotoff, Vivian Griffin, Detroit, Michigan; Aaron Sayegh, Jan Risser, Hafeez Rehman, Houston, Texas; Trista Bingham, Ekow Kwa Sey, Los Angeles, California; Lisa Metsch, David Forrest, Dano Beck, Gabriel Cardenas, Miami, Florida; Chris Nemeth, Lou Smith, Carol-Ann Watson, Nassau-Suffolk, New York; William T. Robinson, DeAnn Gruber, Narquis Barak, New Orleans, Louisiana; Alan Neaigus, Samuel Jenness, Travis Wendel, Camila Gelpi-Acosta, Holly Hagan, New York City, New York; Henry Godette, Barbara Bolden, Sally D'Errico, Newark, New Jersey; Kathleen A. Brady, Althea Kirkland, Mark Shpaner, Philadelphia, Pennsylvania; Vanessa Miguelino-Keasling, Al Velasco, San Diego, California; H. Fisher Raymond, San Francisco, California; Sandra Miranda De León, Yadira Rolón-Colón, San Juan, Puerto Rico; Maria Courogen, Hanne Thiede, Richard Burt, Seattle, Washington; Michael Herbert, Yelena Friedberg, Dale Wrigley, Jacob Fisher, St Louis, Missouri; Marie Sansone, Tiffany West-Ojo, Manya Magnus, Irene Kuo, Washington, DC; Behavioral Surveillance Team.
FIGURE 1. Participating metropolitan statistical areas — National HIV Behavioral Surveillance System: Injecting Drug Users, 20 U.S. cities, 2009
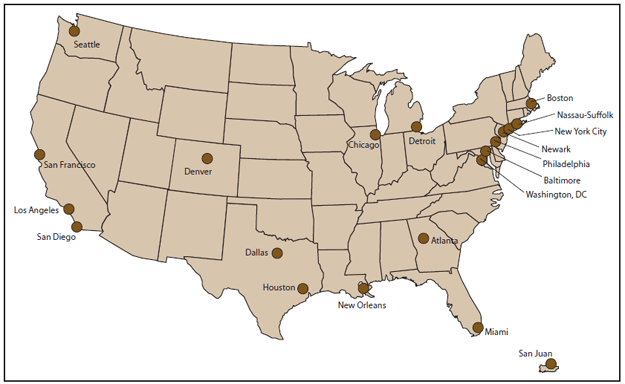
Alternate Text: This figure is a map of the United States showing the 20 panticipating metropolitan statistical areas for the second cycle of the National HIV Behavioral Surveillance System for Injecting Drug Users in 2009: Seattle, San Francisco, Los Angeles, San Diego, Denver, Dallas, Houston, New Orleans, Chicago, Detroit, Atlanta, Miami, Boston, Nassau-Suffolk, New York City, Newark, Philadelphia, Baltimore, Washington, DC, and San Juan.
FIGURE 2. Exclusion criteria and analysis samples — National HIV Behavioral Surveillance System: Injecting Drug Users, 20 U.S. cities, 2009
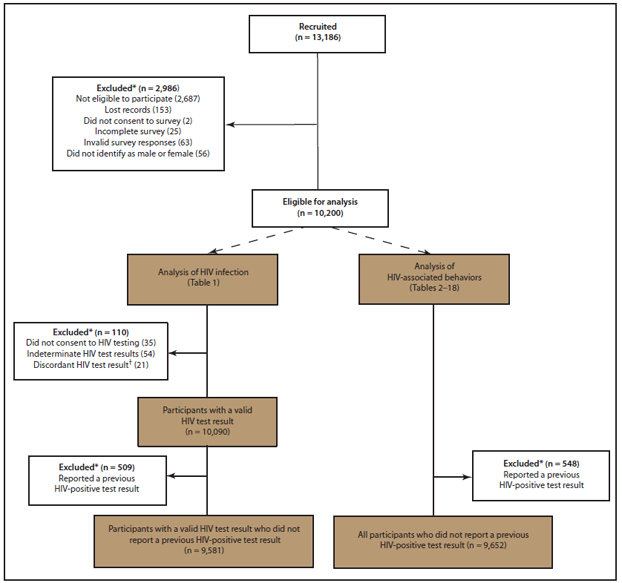
Abbreviations: HIV = human immunodeficiency virus; NHBS-IDU2 = National HIV Behavioral Surveillance System, Injecting Drug Users, second cycle.
* Reasons for exclusion were not mutually exclusive and were applied hierarchically in the order listed.
† Participants reported a previous positive HIV test result but had a negative HIV test result at the time of the survey.
Alternate Text: . This figure is a flow chart describing exclusion criteria and analysis samples for the National HIV Behavioral Surveillance System for Injecting Drug Users in 2009. Criteria were not mutually exclusive and were applied in the order listed. All analyses in this report exclude data for participants who did not meet eligibility criteria and who lost data during electronic uploads, did not consent to the survey, had incomplete survey data, had survey responses with questionable validity, or who did not identify as male or female. Additional and different exclusion criteria were applied for analyses of HIV infection and of HIV-associated behaviors.
|
TABLE 1. (continued) Number and percentage of all participants* and participants who did not report a previous positive HIV test result† who tested positive for HIV infection, by selected characteristics — National HIV Behavioral Surveillance System: Injecting Drug Users, 20 U.S. cities, 2009 |
||||||
|---|---|---|---|---|---|---|
|
Characteristic |
All participants |
Participants who did not report a previous positive HIV test result |
||||
|
Total no. tested |
HIV infection |
Total no. tested |
HIV infection |
|||
|
No. |
(%) |
No. |
(%) |
|||
|
Time since last HIV test††† |
||||||
|
≤3 months |
NA |
NA |
NA |
1,802 |
30 |
(2) |
|
4–6 months |
NA |
NA |
NA |
1,227 |
21 |
(2) |
|
7–12 months |
NA |
NA |
NA |
1,569 |
44 |
(3) |
|
≥13 months |
NA |
NA |
NA |
3,466 |
162 |
(5) |
|
Never tested |
NA |
NA |
NA |
1,070 |
115 |
(11) |
|
Other§§§ |
NA |
NA |
NA |
447 |
25 |
(6) |
|
MSA |
||||||
|
Atlanta, Georgia |
444 |
83 |
(19) |
400 |
39 |
(10) |
|
Baltimore, Maryland |
513 |
82 |
(16) |
469 |
38 |
(8) |
|
Boston, Massachusetts |
613 |
42 |
(7) |
586 |
15 |
(3) |
|
Chicago, Illinois |
539 |
33 |
(6) |
521 |
15 |
(3) |
|
Dallas, Texas |
619 |
12 |
(2) |
612 |
— |
— |
|
Denver, Colorado |
425 |
20 |
(5) |
410 |
— |
— |
|
Detroit, Michigan |
413 |
11 |
(3) |
408 |
6 |
(1) |
|
Houston, Texas |
527 |
38 |
(7) |
505 |
16 |
(3) |
|
Los Angeles, California |
516 |
24 |
(5) |
505 |
13 |
(3) |
|
Miami, Florida |
604 |
83 |
(14) |
542 |
21 |
(4) |
|
New York, New York |
516 |
64 |
(12) |
482 |
30 |
(6) |
|
Nassau-Suffolk, New York |
197 |
20 |
(10) |
188 |
11 |
(6) |
|
New Orleans, Louisiana |
609 |
34 |
(6) |
593 |
18 |
(3) |
|
Newark, New Jersey |
416 |
54 |
(13) |
379 |
17 |
(4) |
|
Philadelphia, Pennsylvania |
522 |
46 |
(9) |
504 |
28 |
(6) |
|
San Diego, California |
611 |
15 |
(2) |
611 |
15 |
(2) |
|
San Francisco, California |
525 |
74 |
(14) |
478 |
27 |
(6) |
|
San Juan, Puerto Rico |
444 |
75 |
(17) |
422 |
53 |
(13) |
|
Seattle, Washington |
497 |
34 |
(7) |
469 |
6 |
(1) |
|
Washington, DC |
540 |
62 |
(11) |
497 |
19 |
(4) |
|
Total |
10,090 |
906 |
(9) |
9,581 |
397 |
(4) |
|
Abbreviations: HIV = human immunodeficiency virus; MSA = metropolitan statistical area/division; NA = not applicable. * Sample includes participants with a valid HIV test result who reported a previous positive HIV test result. Numbers might not add to totals because of missing data. † Sample includes participants with a valid HIV test result who did not report a previous positive HIV test result. Numbers might not add to totals because of missing data. § Suppressed because of small sample size (five or fewer participants). ¶ Persons of Hispanic/Latino ethnicity might be of any race or combination of races. ** Poverty level is based on household income and household size. †† Injected separately with equal frequency or combined as speedball. §§ Other drugs injected alone or two or more drugs injected with the same frequency. ¶¶ Includes outpatient, residential, detoxification, and methadone treatment programs. *** Includes those who did not know or refused to disclose their previous test result or reported an indeterminate test result. ††† Only reported for participants who did not report a previous positive HIV test result. §§§ Includes those who did not know or refused to disclose the date of their previous HIV test result. |
||||||
|
TABLE 2. (Continued) Number and percentage of participants,* by sex and selected characteristics — National HIV Behavioral Surveillance System: Injecting Drug Users, 20 U.S. cities, 2009 |
||||||
|---|---|---|---|---|---|---|
|
Characteristic |
Total males |
Total females |
Total |
|||
|
No. |
(%) |
No. |
(%) |
No. |
(%) |
|
|
MSA |
||||||
|
Atlanta, Georgia |
337 |
(5) |
64 |
(2) |
401 |
(4) |
|
Baltimore, Maryland |
341 |
(5) |
130 |
(5) |
471 |
(5) |
|
Boston, Massachusetts |
394 |
(6) |
194 |
(7) |
588 |
(6) |
|
Chicago, Illinois |
374 |
(5) |
153 |
(6) |
527 |
(5) |
|
Dallas, Texas |
423 |
(6) |
197 |
(7) |
620 |
(6) |
|
Denver, Colorado |
283 |
(4) |
130 |
(5) |
413 |
(4) |
|
Detroit, Michigan |
282 |
(4) |
127 |
(5) |
409 |
(4) |
|
Houston, Texas |
407 |
(6) |
100 |
(4) |
507 |
(5) |
|
Los Angeles, California |
372 |
(5) |
134 |
(5) |
506 |
(5) |
|
Miami, Florida |
422 |
(6) |
120 |
(5) |
542 |
(6) |
|
New York, New York |
372 |
(5) |
113 |
(4) |
485 |
(5) |
|
Nassau-Suffolk, New York |
114 |
(2) |
77 |
(3) |
191 |
(2) |
|
New Orleans, Louisiana |
491 |
(7) |
103 |
(4) |
594 |
(6) |
|
Newark, New Jersey |
259 |
(4) |
122 |
(5) |
381 |
(4) |
|
Philadelphia, Pennsylvania |
389 |
(6) |
123 |
(5) |
512 |
(5) |
|
San Diego, California |
431 |
(6) |
181 |
(7) |
612 |
(6) |
|
San Francisco, California |
323 |
(5) |
159 |
(6) |
482 |
(5) |
|
San Juan, Puerto Rico |
363 |
(5) |
73 |
(3) |
436 |
(5) |
|
Seattle, Washington |
300 |
(4) |
174 |
(7) |
474 |
(5) |
|
Washington, DC |
315 |
(5) |
186 |
(7) |
501 |
(5) |
|
Total |
6,992 |
(72) |
2,660 |
(28) |
9,652 |
(100) |
|
Abbreviations: HIV = human immunodeficiency virus; MSA = metropolitan statistical area/division. * Sample excludes participants who reported a previous positive HIV test result. Numbers may not add to totals because of missing data. Column percentages may not add to 100 because of rounding. † Persons of Hispanic/Latino ethnicity might be of any race. § Among those who reported Hispanic/Latino race/ethnicity. ¶ Poverty level is based on household income and household size. ** Injected separately with equal frequency or combined as speedball. †† Other drugs injected alone or two or more drugs injected with the same frequency. §§ Includes outpatient, residential, detox, and methadone treatment programs. |
||||||
|
TABLE 3. (Continued) Number and percentage of participants* who reported injection-drug behaviors during the past 12 months, by type of drug,† frequency of injection, and selected characteristics — National HIV Behavioral Surveillance System: Injecting Drug Users, 20 U.S. cities, 2009 |
|||||||||||||||||||||
|---|---|---|---|---|---|---|---|---|---|---|---|---|---|---|---|---|---|---|---|---|---|
|
Characteristic |
Heroin |
Speedball§ |
Cocaine or crack |
Methamphetamine |
Other/Multiple |
Total |
|||||||||||||||
|
Injected in past 12 months |
Injected daily¶ |
Injected in past 12 months |
Injected daily |
Injected in past 12 months |
Injected daily |
Injected in past 12 months |
Injected daily |
Injected in past 12 months |
Injected daily |
||||||||||||
|
No. |
(%) |
No. |
(%) |
No. |
(%) |
No. |
(%) |
No. |
(%) |
No. |
(%) |
No. |
(%) |
No. |
(%) |
No. |
(%) |
No. |
(%) |
||
|
MSA |
|||||||||||||||||||||
|
Atlanta, Georgia |
343 |
(86) |
181 |
(53) |
258 |
(64) |
81 |
(31) |
237 |
(59) |
58 |
(24) |
51 |
(13) |
10 |
(20) |
69 |
(17) |
— |
— |
401 |
|
Baltimore, Maryland |
449 |
(95) |
358 |
(80) |
376 |
(80) |
201 |
(53) |
290 |
(62) |
121 |
(42) |
7 |
(1) |
— |
— |
59 |
(13) |
— |
— |
471 |
|
Boston, Massachusetts |
572 |
(97) |
422 |
(74) |
390 |
(66) |
89 |
(23) |
421 |
(72) |
80 |
(19) |
36 |
(6) |
— |
— |
184 |
(31) |
19 |
(10) |
588 |
|
Chicago, Illinois |
515 |
(98) |
470 |
(91) |
212 |
(40) |
37 |
(17) |
154 |
(29) |
25 |
(16) |
10 |
(2) |
— |
— |
29 |
(6) |
— |
— |
527 |
|
Dallas, Texas |
584 |
(94) |
428 |
(73) |
464 |
(75) |
223 |
(48) |
330 |
(53) |
98 |
(30) |
43 |
(7) |
— |
— |
36 |
(6) |
— |
— |
620 |
|
Denver, Colorado |
350 |
(85) |
245 |
(70) |
229 |
(55) |
77 |
(34) |
209 |
(51) |
49 |
(23) |
131 |
(32) |
27 |
(21) |
73 |
(18) |
— |
— |
413 |
|
Detroit, Michigan |
408 |
(100) |
376 |
(92) |
95 |
(23) |
22 |
(23) |
75 |
(18) |
24 |
(32) |
— |
— |
— |
— |
21 |
(5) |
— |
— |
409 |
|
Houston, Texas |
370 |
(73) |
137 |
(37) |
267 |
(53) |
64 |
(24) |
354 |
(70) |
96 |
(27) |
97 |
(19) |
11 |
(11) |
66 |
(13) |
10 |
(15) |
507 |
|
Los Angeles, California |
470 |
(93) |
336 |
(71) |
202 |
(40) |
45 |
(22) |
160 |
(32) |
30 |
(19) |
146 |
(29) |
23 |
(16) |
66 |
(13) |
— |
— |
506 |
|
Miami, Florida |
525 |
(97) |
421 |
(80) |
379 |
(70) |
180 |
(47) |
298 |
(55) |
112 |
(38) |
22 |
(4) |
— |
— |
95 |
(18) |
8 |
(8) |
542 |
|
New York, New York |
436 |
(90) |
349 |
(80) |
302 |
(62) |
135 |
(45) |
215 |
(44) |
72 |
(33) |
6 |
(1) |
— |
— |
62 |
(13) |
— |
— |
485 |
|
Nassau-Suffolk, New York |
184 |
(96) |
152 |
(83) |
81 |
(42) |
19 |
(23) |
61 |
(32) |
13 |
(21) |
— |
— |
— |
— |
23 |
(12) |
— |
— |
191 |
|
New Orleans, Louisiana |
475 |
(80) |
222 |
(47) |
327 |
(55) |
93 |
(28) |
431 |
(73) |
116 |
(27) |
79 |
(13) |
15 |
(19) |
133 |
(22) |
14 |
(11) |
594 |
|
Newark, New Jersey |
362 |
(95) |
300 |
(83) |
246 |
(65) |
150 |
(61) |
161 |
(42) |
75 |
(47) |
— |
— |
— |
— |
12 |
(3) |
— |
— |
381 |
|
Philadelphia, Pennsylvania |
495 |
(97) |
420 |
(85) |
308 |
(60) |
113 |
(37) |
270 |
(53) |
97 |
(36) |
21 |
(4) |
— |
— |
46 |
(9) |
11 |
(24) |
512 |
|
San Diego, California |
498 |
(81) |
302 |
(61) |
277 |
(45) |
74 |
(27) |
190 |
(31) |
39 |
(21) |
259 |
(42) |
66 |
(25) |
56 |
(9) |
7 |
(13) |
612 |
|
San Francisco, California |
418 |
(87) |
229 |
(55) |
233 |
(48) |
45 |
(19) |
179 |
(37) |
22 |
(12) |
230 |
(48) |
19 |
(8) |
107 |
(22) |
11 |
(10) |
482 |
|
San Juan, Puerto Rico |
283 |
(65) |
223 |
(79) |
363 |
(83) |
327 |
(90) |
201 |
(46) |
136 |
(68) |
13 |
(3) |
8 |
(62) |
13 |
(3) |
— |
— |
436 |
|
Seattle, Washington |
452 |
(95) |
320 |
(71) |
321 |
(68) |
49 |
(15) |
240 |
(51) |
21 |
(9) |
124 |
(26) |
14 |
(11) |
95 |
(20) |
474 |
||
|
Washington, DC |
496 |
(99) |
413 |
(83) |
276 |
(55) |
109 |
(39) |
209 |
(42) |
57 |
(27) |
9 |
(2) |
56 |
(11) |
7 |
(13) |
501 |
||
|
Total |
8,685 |
(90) |
6,304 |
(73) |
5,606 |
(58) |
2,133 |
(38) |
4,685 |
(49) |
1,341 |
(29) |
1,290 |
(13) |
210 |
(16) |
1,301 |
(13) |
128 |
(10) |
9,652 |
|
Abbreviations: HIV = human immunodeficiency virus; MSA = metropolitan statistical area/division. * Sample excludes participants who reported a previous positive HIV test result. Numbers might not add to totals because of missing data. † Participants may report the use of more than one drug because categories are not mutually exclusive. § Heroin and cocaine combined and injected together in the same syringe. ¶ Among participants who injected that drug in the past 12 months. ** Suppressed because of small sample size (five or fewer participants). †† Persons of Hispanic/Latino ethnicity might be of any race or combination of races. §§ Poverty level is based on household income and household size. |
|||||||||||||||||||||
|
TABLE 4. (Continued) Number and percentage of participants* who reported risky injection practices during the past 12 months, by selected characteristics — National HIV Behavioral Surveillance System: Injecting Drug Users, 20 U.S. cities, 2009 |
|||||||||
|---|---|---|---|---|---|---|---|---|---|
|
Characteristic |
Receptive sharing of syringes† |
Receptive sharing of injection equipment§ |
Receptive sharing of syringes to divide drugs¶ |
Any receptive sharing** |
Total |
||||
|
No. |
(%) |
No. |
(%) |
No. |
(%) |
No. |
(%) |
||
|
Had unprotected anal sex with |
|||||||||
|
Yes |
1,227 |
(53) |
1,657 |
(72) |
1,152 |
(50) |
1,745 |
(76) |
2,307 |
|
No |
2,182 |
(30) |
3,917 |
(54) |
2,197 |
(30) |
4,183 |
(57) |
7,314 |
|
Had more than one opposite-sex partner, |
|||||||||
|
Yes |
2,214 |
(45) |
3,255 |
(65) |
2,081 |
(42) |
3,461 |
(70) |
4,971 |
|
No |
1,199 |
(26) |
2,325 |
(50) |
1,273 |
(27) |
2,474 |
(53) |
4,662 |
|
HIV test result |
|||||||||
|
Negative |
3,264 |
(36) |
5,323 |
(58) |
3,195 |
(35) |
5,657 |
(62) |
9,185 |
|
Positive |
139 |
(35) |
238 |
(60) |
152 |
(38) |
255 |
(64) |
397 |
|
MSA |
|||||||||
|
Atlanta, Georgia |
126 |
(31) |
218 |
(54) |
117 |
(29) |
232 |
(58) |
401 |
|
Baltimore, Maryland |
129 |
(27) |
323 |
(69) |
181 |
(38) |
336 |
(71) |
471 |
|
Boston, Massachusetts |
417 |
(71) |
474 |
(81) |
339 |
(58) |
498 |
(85) |
588 |
|
Chicago, Illinois |
126 |
(24) |
267 |
(51) |
110 |
(21) |
281 |
(53) |
527 |
|
Dallas, Texas |
223 |
(36) |
424 |
(68) |
269 |
(43) |
442 |
(71) |
620 |
|
Denver, Colorado |
166 |
(40) |
232 |
(56) |
139 |
(34) |
252 |
(61) |
413 |
|
Detroit, Michigan |
113 |
(28) |
157 |
(38) |
111 |
(27) |
179 |
(44) |
409 |
|
Houston, Texas |
244 |
(48) |
335 |
(66) |
223 |
(44) |
360 |
(71) |
507 |
|
Los Angeles, California |
208 |
(41) |
344 |
(68) |
185 |
(37) |
357 |
(71) |
506 |
|
Miami, Florida |
250 |
(46) |
350 |
(65) |
265 |
(49) |
367 |
(68) |
542 |
|
New York, New York |
133 |
(27) |
207 |
(43) |
113 |
(23) |
224 |
(46) |
485 |
|
Nassau-Suffolk, New York |
30 |
(16) |
39 |
(20) |
15 |
(8) |
45 |
(24) |
191 |
|
New Orleans, Louisiana |
240 |
(40) |
351 |
(59) |
199 |
(34) |
380 |
(64) |
594 |
|
Newark, New Jersey |
114 |
(30) |
148 |
(39) |
95 |
(25) |
161 |
(42) |
381 |
|
Philadelphia, Pennsylvania |
148 |
(29) |
297 |
(58) |
158 |
(31) |
312 |
(61) |
512 |
|
San Diego, California |
292 |
(48) |
401 |
(66) |
271 |
(44) |
426 |
(70) |
612 |
|
San Francisco, California |
75 |
(16) |
196 |
(41) |
77 |
(16) |
208 |
(43) |
482 |
|
San Juan, Puerto Rico |
119 |
(27) |
238 |
(55) |
170 |
(39) |
262 |
(60) |
436 |
|
Seattle, Washington |
151 |
(32) |
300 |
(63) |
139 |
(29) |
317 |
(67) |
474 |
|
Washington, DC |
116 |
(23) |
287 |
(57) |
185 |
(37) |
306 |
(61) |
501 |
|
Total |
3,420 |
(35) |
5,588 |
(58) |
3,361 |
(35) |
5,945 |
(62) |
9,652 |
|
Abbreviations: HIV = human immunodeficiency virus; MSA = metropolitan statistical area/division. * Sample excludes participants who reported a previous positive HIV test result. Numbers might not add to totals because of missing data. † Used a needle and syringe that someone else had previously used to inject . § Used cooker (e.g., spoon or bottle cap), cotton (used to filter particles from drug solution), or water (used for rinsing needles or preparing drugs) that had already been used by someone else. ¶ Divided a drug solution with a syringe that someone else had previously used to inject. ** Used needles and syringes that had already been used by someone else to inject; used cooker, cotton, or water that had already been used by someone else; or divided a drug solution with a syringe that someone else had previously used to inject. †† Persons of Hispanic/Latino ethnicity might be of any race or combination of races. §§ Poverty level is based on household income and household size. ¶¶ Injected separately with equal frequency or combined as speedball. *** Other drugs injected alone or two or more drugs injected with the same frequency. ††† Reported ever being told that they had hepatitis C infection by a health-care provider or ever having a blood test to check for hepatitis C infection. §§§ Reported ever being told that they had hepatitis C infection by a health-care provider. **** Neither participant nor the partner used a condom. |
|||||||||
|
TABLE 5. (Continued) Number and percentage of male participants* who reported sexual behaviors during the past 12 months, by selected characteristics — National HIV Behavioral Surveillance System: Injecting Drug Users, 20 U.S. cities, 2009 |
|||||||||||||||||
|---|---|---|---|---|---|---|---|---|---|---|---|---|---|---|---|---|---|
|
Characteristic |
Male participants with female sex partners |
Male participants with male sex partners |
Total |
||||||||||||||
|
Any sex with females† |
Vaginal sex |
Unprotected§ vaginal sex |
Anal sex |
Unprotected anal sex |
Any sex with males¶ |
Anal sex** |
Unprotected anal sex |
||||||||||
|
No. |
(%) |
No. |
(%) |
No. |
(%) |
No. |
(%) |
No. |
(%) |
No. |
(%) |
No. |
(%) |
No. |
(%) |
||
|
MSA |
|||||||||||||||||
|
Atlanta, Georgia |
297 |
(88) |
290 |
(86) |
238 |
(71) |
88 |
(26) |
57 |
(17) |
48 |
(14) |
37 |
(11) |
31 |
(9) |
337 |
|
Baltimore, Maryland |
288 |
(84) |
283 |
(83) |
237 |
(70) |
82 |
(24) |
62 |
(18) |
6 |
(2) |
— |
— |
— |
— |
341 |
|
Boston, Massachusetts |
364 |
(92) |
363 |
(92) |
342 |
(87) |
217 |
(55) |
194 |
(49) |
88 |
(22) |
66 |
(17) |
42 |
(11) |
394 |
|
Chicago, Illinois |
321 |
(86) |
319 |
(85) |
237 |
(63) |
113 |
(30) |
78 |
(21) |
30 |
(8) |
18 |
(5) |
11 |
(3) |
374 |
|
Dallas, Texas |
363 |
(86) |
357 |
(84) |
315 |
(74) |
71 |
(17) |
53 |
(13) |
— |
— |
— |
— |
— |
— |
423 |
|
Denver, Colorado |
217 |
(77) |
214 |
(76) |
194 |
(69) |
40 |
(14) |
34 |
(12) |
12 |
(4) |
8 |
(3) |
— |
— |
283 |
|
Detroit, Michigan |
243 |
(86) |
234 |
(83) |
196 |
(70) |
63 |
(22) |
45 |
(16) |
— |
— |
— |
— |
— |
— |
282 |
|
Houston, Texas |
382 |
(94) |
378 |
(93) |
335 |
(82) |
200 |
(49) |
155 |
(38) |
88 |
(22) |
67 |
(16) |
49 |
(12) |
407 |
|
Los Angeles, California |
302 |
(81) |
296 |
(80) |
254 |
(68) |
116 |
(31) |
81 |
(22) |
41 |
(11) |
34 |
(9) |
27 |
(7) |
372 |
|
Miami, Florida |
357 |
(85) |
348 |
(82) |
288 |
(68) |
179 |
(42) |
145 |
(34) |
89 |
(21) |
68 |
(16) |
44 |
(10) |
422 |
|
New York, New York |
309 |
(83) |
305 |
(82) |
249 |
(67) |
185 |
(50) |
136 |
(37) |
23 |
(6) |
19 |
(5) |
11 |
(3) |
372 |
|
Nassau-Suffolk, New York |
96 |
(84) |
92 |
(81) |
66 |
(58) |
20 |
(18) |
12 |
(11) |
— |
— |
— |
— |
— |
— |
114 |
|
New Orleans, Louisiana |
434 |
(88) |
430 |
(88) |
383 |
(78) |
176 |
(36) |
137 |
(28) |
61 |
(12) |
44 |
(9) |
31 |
(6) |
491 |
|
Newark, New Jersey |
227 |
(88) |
223 |
(86) |
176 |
(68) |
67 |
(26) |
48 |
(19) |
10 |
(4) |
6 |
(2) |
— |
— |
259 |
|
Philadelphia, Pennsylvania |
316 |
(81) |
310 |
(80) |
251 |
(65) |
70 |
(18) |
55 |
(14) |
10 |
(3) |
7 |
(2) |
7 |
(2) |
389 |
|
San Diego, California |
375 |
(87) |
371 |
(86) |
322 |
(75) |
181 |
(42) |
136 |
(32) |
26 |
(6) |
20 |
(5) |
15 |
(3) |
431 |
|
San Francisco, California |
237 |
(73) |
226 |
(70) |
190 |
(59) |
91 |
(28) |
67 |
(21) |
85 |
(26) |
48 |
(15) |
35 |
(11) |
323 |
|
San Juan, Puerto Rico |
276 |
(76) |
274 |
(75) |
231 |
(64) |
183 |
(50) |
148 |
(41) |
45 |
(12) |
37 |
(10) |
27 |
(7) |
363 |
|
Seattle, Washington |
212 |
(71) |
207 |
(69) |
174 |
(58) |
65 |
(22) |
48 |
(16) |
38 |
(13) |
22 |
(7) |
17 |
(6) |
300 |
|
Washington, DC |
250 |
(79) |
247 |
(78) |
190 |
(60) |
66 |
(21) |
48 |
(15) |
11 |
(3) |
7 |
(2) |
— |
— |
315 |
|
Total |
5,866 |
(84) |
5,767 |
(82) |
4,868 |
(70) |
2,273 |
(33) |
1,739 |
(25) |
721 |
(10) |
518 |
(7) |
364 |
(5) |
6,992 |
|
Abbreviations: HIV = human immunodeficiency virus; MSA = metropolitan statistical area/division. * Sample excludes participants who reported a previous positive HIV test result. Numbers might not add to totals because of missing data. † Might include oral, vaginal, or anal sex. § Neither participant nor the partner used a condom. ¶ Might include oral or anal sex. ** Includes both insertive and receptive anal sex. †† Suppressed because of small sample size (five or fewer participants). §§ Persons of Hispanic/Latino ethnicity might be of any race or combination of races. ¶¶ Poverty level is based on household income and household size. *** Injected separately with equal frequency or combined as speedball. ††† Other drugs injected alone or two or more drugs injected with the same frequency. |
|||||||||||||||||
|
TABLE 6. (Continued) Number and percentage of female participants* who reported sexual behaviors with male partners during past the 12 months, by selected characteristics — National HIV Behavioral Surveillance System: Injecting Drug Users, 20 U.S. cities, 2009 |
|||||||||||
|---|---|---|---|---|---|---|---|---|---|---|---|
|
Characteristic |
Female participants with male sex partners |
Total |
|||||||||
|
Any sex with males† |
Vaginal sex |
Unprotected§ |
Anal sex |
Unprotected |
|||||||
|
No. |
(%) |
No. |
(%) |
No. |
(%) |
No. |
(%) |
No. |
(%) |
||
|
MSA |
|||||||||||
|
Atlanta, Georgia |
59 |
(92) |
59 |
(92) |
51 |
(80) |
17 |
(27) |
17 |
(27) |
64 |
|
Baltimore, Maryland |
109 |
(84) |
109 |
(84) |
99 |
(76) |
38 |
(29) |
34 |
(26) |
130 |
|
Boston, Massachusetts |
175 |
(90) |
173 |
(89) |
167 |
(86) |
108 |
(56) |
96 |
(49) |
194 |
|
Chicago, Illinois |
134 |
(88) |
132 |
(86) |
105 |
(69) |
38 |
(25) |
27 |
(18) |
153 |
|
Dallas, Texas |
156 |
(79) |
153 |
(78) |
140 |
(71) |
24 |
(12) |
22 |
(11) |
197 |
|
Denver, Colorado |
95 |
(73) |
95 |
(73) |
87 |
(67) |
26 |
(20) |
21 |
(16) |
130 |
|
Detroit, Michigan |
102 |
(80) |
99 |
(78) |
89 |
(70) |
23 |
(18) |
17 |
(13) |
127 |
|
Houston, Texas |
93 |
(93) |
92 |
(92) |
84 |
(84) |
32 |
(32) |
25 |
(25) |
100 |
|
Los Angeles, California |
105 |
(78) |
105 |
(78) |
97 |
(72) |
34 |
(25) |
29 |
(22) |
134 |
|
Miami, Florida |
108 |
(90) |
107 |
(89) |
94 |
(78) |
39 |
(33) |
32 |
(27) |
120 |
|
New York, New York |
93 |
(82) |
91 |
(81) |
79 |
(70) |
40 |
(35) |
32 |
(28) |
113 |
|
Nassau-Suffolk, New York |
63 |
(82) |
63 |
(82) |
53 |
(69) |
23 |
(30) |
15 |
(19) |
77 |
|
New Orleans, Louisiana |
97 |
(94) |
96 |
(93) |
89 |
(86) |
28 |
(27) |
22 |
(21) |
103 |
|
Newark, New Jersey |
100 |
(82) |
100 |
(82) |
80 |
(66) |
23 |
(19) |
19 |
(16) |
122 |
|
Philadelphia, Pennsylvania |
109 |
(89) |
108 |
(88) |
97 |
(79) |
29 |
(24) |
19 |
(15) |
123 |
|
San Diego, California |
157 |
(87) |
156 |
(86) |
138 |
(76) |
50 |
(28) |
43 |
(24) |
181 |
|
San Francisco, California |
122 |
(77) |
120 |
(75) |
105 |
(66) |
35 |
(22) |
25 |
(16) |
159 |
|
San Juan, Puerto Rico |
64 |
(88) |
64 |
(88) |
56 |
(77) |
26 |
(36) |
21 |
(29) |
73 |
|
Seattle, Washington |
130 |
(75) |
124 |
(71) |
111 |
(64) |
28 |
(16) |
20 |
(11) |
174 |
|
Washington, DC |
144 |
(77) |
140 |
(75) |
120 |
(65) |
39 |
(21) |
32 |
(17) |
186 |
|
Total |
2,215 |
(83) |
2,186 |
(82) |
1,941 |
(73) |
700 |
(26) |
568 |
(21) |
2,660 |
|
Abbreviations: HIV = human immunodeficiency virus; MSA = metropolitan statistical area/division. * Sample excludes participants who reported a previous positive HIV test result. Numbers might not add to totals because of missing data. † Might include oral, vaginal, or anal sex. § Neither the participant nor the partner used a condom. ¶ Suppressed because of small sample size (five or fewer participants). ** Persons of Hispanic/Latino ethnicity might be of any race or combination of races. †† Poverty level is based on household income and household size. §§ Injected separately with equal frequency or combined as speedball. ¶¶ Other drugs injected alone or two or more drugs injected with the same frequency. |
|||||||||||
|
TABLE 7. (Continued) Number and percentage of male participants* who reported sexual behaviors with female partners during the past 12 months, by partner type and selected characteristics — National HIV Behavioral Surveillance System: Injecting Drug Users, 20 U.S. cities, 2009 |
|||||||||||||
|---|---|---|---|---|---|---|---|---|---|---|---|---|---|
|
Characteristic |
Female main partner |
Female casual partner |
Female exchange partner† |
Total |
|||||||||
|
Vaginal or |
Unprotected§ vaginal or |
Vaginal or |
Unprotected vaginal or |
Vaginal or |
Unprotected vaginal or |
||||||||
|
No. |
(%) |
No. |
(%) |
No. |
(%) |
No. |
(%) |
No. |
(%) |
No. |
(%) |
||
|
MSA |
|||||||||||||
|
Atlanta, Georgia |
158 |
(47) |
128 |
(38) |
152 |
(45) |
113 |
(34) |
141 |
(42) |
94 |
(28) |
337 |
|
Baltimore, Maryland |
219 |
(64) |
186 |
(55) |
123 |
(36) |
82 |
(24) |
44 |
(13) |
20 |
(6) |
341 |
|
Boston, Massachusetts |
217 |
(55) |
210 |
(53) |
248 |
(63) |
229 |
(58) |
106 |
(27) |
92 |
(23) |
394 |
|
Chicago, Illinois |
245 |
(66) |
190 |
(51) |
159 |
(43) |
85 |
(23) |
38 |
(10) |
20 |
(5) |
374 |
|
Dallas, Texas |
290 |
(69) |
263 |
(62) |
143 |
(34) |
101 |
(24) |
39 |
(9) |
24 |
(6) |
423 |
|
Denver, Colorado |
145 |
(51) |
140 |
(49) |
102 |
(36) |
71 |
(25) |
12 |
(4) |
6 |
(2) |
283 |
|
Detroit, Michigan |
184 |
(65) |
148 |
(52) |
105 |
(37) |
75 |
(27) |
46 |
(16) |
37 |
(13) |
282 |
|
Houston, Texas |
210 |
(52) |
184 |
(45) |
266 |
(65) |
211 |
(52) |
177 |
(43) |
143 |
(35) |
407 |
|
Los Angeles, California |
198 |
(53) |
175 |
(47) |
170 |
(46) |
139 |
(37) |
54 |
(15) |
41 |
(11) |
372 |
|
Miami, Florida |
203 |
(48) |
185 |
(44) |
162 |
(38) |
124 |
(29) |
112 |
(27) |
69 |
(16) |
422 |
|
New York, New York |
232 |
(62) |
194 |
(52) |
147 |
(40) |
98 |
(26) |
34 |
(9) |
25 |
(7) |
372 |
|
Nassau-Suffolk, New York |
71 |
(62) |
53 |
(46) |
49 |
(43) |
30 |
(26) |
— |
— |
— |
— |
114 |
|
New Orleans, Louisiana |
256 |
(52) |
238 |
(48) |
273 |
(56) |
225 |
(46) |
147 |
(30) |
103 |
(21) |
491 |
|
Newark, New Jersey |
154 |
(59) |
119 |
(46) |
107 |
(41) |
74 |
(29) |
34 |
(13) |
26 |
(10) |
259 |
|
Philadelphia, Pennsylvania |
229 |
(59) |
185 |
(48) |
140 |
(36) |
100 |
(26) |
54 |
(14) |
35 |
(9) |
389 |
|
San Diego, California |
230 |
(53) |
204 |
(47) |
242 |
(56) |
199 |
(46) |
46 |
(11) |
36 |
(8) |
431 |
|
San Francisco, California |
152 |
(47) |
134 |
(41) |
110 |
(34) |
81 |
(25) |
60 |
(19) |
36 |
(11) |
323 |
|
San Juan, Puerto Rico |
136 |
(37) |
119 |
(33) |
162 |
(45) |
136 |
(37) |
70 |
(19) |
50 |
(14) |
363 |
|
Seattle, Washington |
138 |
(46) |
121 |
(40) |
109 |
(36) |
80 |
(27) |
25 |
(8) |
18 |
(6) |
300 |
|
Washington, DC |
187 |
(59) |
156 |
(50) |
97 |
(31) |
53 |
(17) |
44 |
(14) |
22 |
(7) |
315 |
|
Total |
3,854 |
(55) |
3,332 |
(48) |
3,066 |
(44) |
2,306 |
(33) |
1,285 |
(18) |
898 |
(13) |
6,992 |
|
Abbreviations: HIV = human immunodeficiency virus; MSA = metropolitan statistical area/division. * Sample excludes participants who reported a previous positive HIV test result. Numbers might not add to totals because of missing data. † Exchange sex is defined as having sex with someone in exchange for things like money or drugs. Includes partners who gave money or drugs to the participant in exchange for sex, and partners who the participant gave things to in exchange for sex. § Neither the participant nor the partner used a condom. ¶ Suppressed because of small sample size (five or fewer participants). ** Persons of Hispanic/Latino ethnicity might be of any race or combination of races. †† Poverty level is based on household income and household size. §§ Injected separately with equal frequency or combined as speedball. ¶¶ Other drugs injected alone or two or more drugs injected with the same frequency. |
|||||||||||||
|
TABLE 8. (Continued) Number and percentage of female participants* who reported sexual behaviors with male partners during the past 12 months, by partner type and selected characteristics — National HIV Behavioral Surveillance System: Injecting Drug Users, 20 U.S. cities, 2009 |
|||||||||||||
|---|---|---|---|---|---|---|---|---|---|---|---|---|---|
|
Characteristic |
Male main partner |
Male casual partner |
Male exchange† partner |
Total |
|||||||||
|
Vaginal or |
Unprotected§ vaginal or |
Vaginal or |
Unprotected vaginal or |
Vaginal or |
Unprotected vaginal or |
||||||||
|
No. |
(%) |
No. |
(%) |
No. |
(%) |
No. |
(%) |
No. |
(%) |
No. |
(%) |
||
|
MSA |
|||||||||||||
|
Atlanta, Georgia |
41 |
(64) |
36 |
(56) |
15 |
(23) |
8 |
(13) |
34 |
(53) |
22 |
(34) |
64 |
|
Baltimore, Maryland |
90 |
(69) |
82 |
(63) |
35 |
(27) |
21 |
(16) |
46 |
(35) |
31 |
(24) |
130 |
|
Boston, Massachusetts |
133 |
(69) |
131 |
(68) |
69 |
(36) |
62 |
(32) |
97 |
(50) |
71 |
(37) |
194 |
|
Chicago, Illinois |
109 |
(71) |
86 |
(56) |
42 |
(27) |
21 |
(14) |
48 |
(31) |
30 |
(20) |
153 |
|
Dallas, Texas |
132 |
(67) |
122 |
(62) |
44 |
(22) |
34 |
(17) |
35 |
(18) |
23 |
(12) |
197 |
|
Denver, Colorado |
80 |
(62) |
75 |
(58) |
22 |
(17) |
15 |
(12) |
24 |
(18) |
15 |
(12) |
130 |
|
Detroit, Michigan |
75 |
(59) |
60 |
(47) |
30 |
(24) |
26 |
(20) |
38 |
(30) |
33 |
(26) |
127 |
|
Houston, Texas |
64 |
(64) |
56 |
(56) |
44 |
(44) |
37 |
(37) |
56 |
(56) |
45 |
(45) |
100 |
|
Los Angeles, California |
79 |
(59) |
74 |
(55) |
43 |
(32) |
33 |
(25) |
38 |
(28) |
26 |
(19) |
134 |
|
Miami, Florida |
79 |
(66) |
75 |
(63) |
35 |
(29) |
22 |
(18) |
67 |
(56) |
38 |
(32) |
120 |
|
New York, New York |
78 |
(69) |
70 |
(62) |
16 |
(14) |
9 |
(8) |
19 |
(17) |
10 |
(9) |
113 |
|
Nassau-Suffolk, New York |
50 |
(65) |
40 |
(52) |
22 |
(29) |
17 |
(22) |
14 |
(18) |
12 |
(16) |
77 |
|
New Orleans, Louisiana |
73 |
(71) |
67 |
(65) |
45 |
(44) |
33 |
(32) |
35 |
(34) |
23 |
(22) |
103 |
|
Newark, New Jersey |
87 |
(71) |
70 |
(57) |
18 |
(15) |
9 |
(7) |
28 |
(23) |
17 |
(14) |
122 |
|
Philadelphia, Pennsylvania |
79 |
(64) |
68 |
(55) |
25 |
(20) |
21 |
(17) |
48 |
(39) |
38 |
(31) |
123 |
|
San Diego, California |
108 |
(60) |
98 |
(54) |
70 |
(39) |
55 |
(30) |
38 |
(21) |
28 |
(15) |
181 |
|
San Francisco, California |
98 |
(62) |
90 |
(57) |
39 |
(25) |
21 |
(13) |
39 |
(25) |
22 |
(14) |
159 |
|
San Juan, Puerto Rico |
33 |
(45) |
32 |
(44) |
11 |
(15) |
6 |
— |
38 |
(52) |
27 |
(37) |
73 |
|
Seattle, Washington |
99 |
(57) |
94 |
(54) |
31 |
(18) |
25 |
(14) |
49 |
(28) |
24 |
(14) |
174 |
|
Washington, DC |
115 |
(62) |
100 |
(54) |
33 |
(18) |
21 |
(11) |
44 |
(24) |
30 |
(16) |
186 |
|
Total |
1,702 |
(64) |
1,526 |
(57) |
689 |
(26) |
496 |
(19) |
835 |
(31) |
565 |
(21) |
2,660 |
|
Abbreviations: HIV = human immunodeficiency virus; MSA = metropolitan statistical area/division. * Sample excludes participants who reported a previous positive HIV test result. Numbers might not add to totals because of missing data. † Exchange sex is defined as having sex with someone in exchange for things like money or drugs. Includes partners who gave money or drugs to the participant in exchange for sex and partners to whom the participant gave things in exchange for sex. § Neither the participant nor the partner used a condom. ¶ Suppressed because of small sample size (five or fewer participants). ** Persons of Hispanic/Latino ethnicity might be of any race or combination of races. †† Poverty level is based on household income and household size. §§ Injected separately with equal frequency or combined as speedball. ¶¶ Other drugs injected alone or two or more drugs injected with the same frequency. |
|||||||||||||
|
TABLE 9. (Continued) Number and percentage of participants* who reported current, heavy, or binge drinking during the past 30 days and noninjection drug use during the past 12 months, by selected characteristics — National HIV Behavioral Surveillance System: Injecting Drug Users, United States, 2009 |
|||||||||||||||||||||||
|---|---|---|---|---|---|---|---|---|---|---|---|---|---|---|---|---|---|---|---|---|---|---|---|
|
Characteristic |
Alcohol use in the past 30 days |
Noninjection drug use in the past 12 months |
Total |
||||||||||||||||||||
|
Current† |
Heavy§ |
Binge¶ |
Marijuana |
Crack |
Cocaine |
Heroin |
Metham- |
Downers** |
Pain-killers†† |
Any§§ |
|||||||||||||
|
No. |
(%) |
No. |
(%) |
No. |
(%) |
No. |
(%) |
No. |
(%) |
No. |
(%) |
No. |
(%) |
No. |
(%) |
No. |
(%) |
No. |
(%) |
No. |
(%) |
||
|
MSA |
|||||||||||||||||||||||
|
Atlanta, Georgia |
307 |
(77) |
156 |
(39) |
214 |
(53) |
234 |
(58) |
241 |
(60) |
199 |
(50) |
157 |
(39) |
51 |
(13) |
101 |
(25) |
144 |
(36) |
329 |
(82) |
401 |
|
Baltimore, Maryland |
356 |
(76) |
113 |
(24) |
173 |
(37) |
170 |
(36) |
183 |
(39) |
147 |
(31) |
164 |
(35) |
—**** |
— |
94 |
(20) |
113 |
(24) |
290 |
(62) |
471 |
|
Boston, Massachusetts |
360 |
(61) |
137 |
(23) |
268 |
(46) |
304 |
(52) |
359 |
(61) |
324 |
(55) |
263 |
(45) |
51 |
(9) |
361 |
(61) |
321 |
(55) |
466 |
(79) |
588 |
|
Chicago, Illinois |
343 |
(65) |
127 |
(24) |
205 |
(39) |
200 |
(38) |
227 |
(43) |
117 |
(22) |
174 |
(33) |
13 |
(2) |
131 |
(25) |
80 |
(15) |
340 |
(65) |
527 |
|
Dallas, Texas |
455 |
(73) |
150 |
(24) |
229 |
(37) |
279 |
(45) |
251 |
(40) |
229 |
(37) |
223 |
(36) |
49 |
(8) |
207 |
(33) |
144 |
(23) |
426 |
(69) |
620 |
|
Denver, Colorado |
259 |
(63) |
75 |
(18) |
147 |
(36) |
249 |
(60) |
187 |
(45) |
161 |
(39) |
139 |
(34) |
121 |
(29) |
170 |
(41) |
183 |
(44) |
351 |
(85) |
413 |
|
Detroit, Michigan |
215 |
(53) |
83 |
(20) |
121 |
(30) |
139 |
(34) |
149 |
(36) |
73 |
(18) |
119 |
(29) |
— |
— |
114 |
(28) |
101 |
(25) |
243 |
(59) |
409 |
|
Houston, Texas |
415 |
(82) |
259 |
(51) |
314 |
(62) |
288 |
(57) |
300 |
(59) |
282 |
(56) |
165 |
(33) |
78 |
(15) |
206 |
(41) |
198 |
(39) |
407 |
(80) |
507 |
|
Los Angeles, California |
337 |
(67) |
135 |
(27) |
216 |
(43) |
247 |
(49) |
235 |
(46) |
147 |
(29) |
168 |
(33) |
160 |
(32) |
176 |
(35) |
214 |
(42) |
395 |
(78) |
506 |
|
Miami, Florida |
374 |
(69) |
180 |
(33) |
227 |
(42) |
278 |
(51) |
318 |
(59) |
287 |
(53) |
263 |
(49) |
29 |
(5) |
277 |
(51) |
222 |
(41) |
449 |
(83) |
542 |
|
New York, New York |
264 |
(54) |
88 |
(18) |
157 |
(32) |
169 |
(35) |
155 |
(32) |
127 |
(26) |
96 |
(20) |
10 |
(2) |
170 |
(35) |
97 |
(20) |
304 |
(63) |
485 |
|
Nassau-Suffolk, New York |
93 |
(49) |
37 |
(19) |
56 |
(29) |
79 |
(41) |
94 |
(49) |
82 |
(43) |
81 |
(42) |
— |
— |
52 |
(27) |
61 |
(32) |
151 |
(79) |
191 |
|
New Orleans, Louisiana |
476 |
(80) |
299 |
(50) |
362 |
(61) |
381 |
(64) |
349 |
(59) |
342 |
(58) |
263 |
(44) |
92 |
(15) |
258 |
(43) |
300 |
(51) |
516 |
(87) |
594 |
|
Newark, New Jersey |
232 |
(61) |
90 |
(24) |
145 |
(38) |
136 |
(36) |
192 |
(50) |
143 |
(38) |
186 |
(49) |
6 |
(2) |
143 |
(38) |
101 |
(27) |
285 |
(75) |
381 |
|
Philadelphia, Pennsylvania |
250 |
(49) |
82 |
(16) |
154 |
(30) |
191 |
(37) |
201 |
(39) |
161 |
(31) |
135 |
(26) |
17 |
(3) |
242 |
(47) |
143 |
(28) |
342 |
(67) |
512 |
|
San Diego, California |
454 |
(74) |
219 |
(36) |
286 |
(47) |
324 |
(53) |
186 |
(30) |
177 |
(29) |
198 |
(32) |
274 |
(45) |
184 |
(30) |
245 |
(40) |
489 |
(80) |
612 |
|
San Francisco, California |
311 |
(65) |
123 |
(26) |
161 |
(33) |
277 |
(57) |
311 |
(65) |
124 |
(26) |
141 |
(29) |
187 |
(39) |
153 |
(32) |
155 |
(32) |
400 |
(83) |
482 |
|
San Juan, Puerto Rico |
202 |
(46) |
75 |
(17) |
117 |
(27) |
167 |
(38) |
131 |
(30) |
106 |
(24) |
73 |
(17) |
11 |
(3) |
120 |
(28) |
74 |
(17) |
230 |
(53) |
436 |
|
Seattle, Washington |
287 |
(61) |
95 |
(20) |
150 |
(32) |
299 |
(63) |
356 |
(75) |
180 |
(38) |
133 |
(28) |
130 |
(27) |
255 |
(54) |
219 |
(46) |
433 |
(91) |
474 |
|
Washington, DC |
392 |
(78) |
167 |
(33) |
242 |
(48) |
182 |
(36) |
235 |
(47) |
162 |
(32) |
247 |
(49) |
7 |
(1) |
126 |
(25) |
144 |
(29) |
327 |
(65) |
501 |
|
Total |
6,382 |
(66) |
2,690 |
(28) |
3,944 |
(41) |
4,593 |
(48) |
4,660 |
(48) |
3,570 |
(37) |
3,388 |
(35) |
1,298 |
(13) |
3,540 |
(37) |
3,259 |
(34) |
7,173 |
(74) |
9,652 |
|
Abbreviations: HIV = human immunodeficiency virus; MSA = metropolitan statistical area/division. * Sample excludes participants who reported a previous positive HIV test result. Numbers might not add to totals because of missing data. † Current drinking is defined as any alcohol during the past 30 days. § Heavy drinking is defined as more than two drinks on average per day during the past 30 days for males and more than one drink on average per day during the past 30 days for females. ¶ Binge drinking is defined as more than five drinks at one sitting during the past 30 days for males or more than four drinks at one sitting during the past 30 days for females. ** Downers such as Valium, Ativan, or Xanax. †† Painkillers such as Oxycontin, Vicodin, or Percocet. §§ Used any of the following drugs: marijuana, crack cocaine, cocaine (powder), heroin, methamphetamine, downers, painkillers, ecstasy, other cub drugs, hallucinogens, gamma hydroxyl butyrate (GHB), or poppers. ¶¶ Persons of Hispanic/Latino ethnicity might be of any race or combination of races. *** Poverty level is based on household income and household size. ††† Injected separately with equal frequency or combined as speedball. §§§ Other drugs injected alone or two or more drugs injected with the same frequency. ¶¶¶ Includes outpatient, residential, detoxification, and methadone treatment programs. **** Suppressed because of to small sample size (five or fewer participants). |
|||||||||||||||||||||||
|
TABLE 10. (Continued) Number and percentage of participants* who reported receiving a diagnosis of any sexually transmitted disease, syphilis, or herpes during the past 12 months, by selected characteristics — National HIV Behavioral Surveillance System: Injecting Drug Users, 20 U.S. cities, 2009 |
|||||||||||||||||||||
|---|---|---|---|---|---|---|---|---|---|---|---|---|---|---|---|---|---|---|---|---|---|
|
Characteristic |
Any STD† |
Syphilis |
Herpes |
Total |
Total females |
Total |
|||||||||||||||
|
Male |
Female |
Total |
Male |
Female |
Total |
Male |
Female |
Total |
|||||||||||||
|
No. |
(%)§ |
No. |
(%)¶ |
No. |
(%)** |
No. |
(%)§ |
No. |
(%)¶ |
No. |
(%)** |
No. |
(%)§ |
No. |
(%)¶ |
No. |
(%)** |
||||
|
Alcohol or drug treatment program§§§ |
|||||||||||||||||||||
|
≤ 12 months before interview |
145 |
(6) |
134 |
(15) |
279 |
(9) |
25 |
(1) |
15 |
(2) |
40 |
(1) |
33 |
(1) |
22 |
(2) |
55 |
(2) |
2,291 |
911 |
3,202 |
|
> 12 months before interview |
150 |
(5) |
120 |
(10) |
270 |
(7) |
36 |
(1) |
22 |
(2) |
58 |
(1) |
26 |
(1) |
18 |
(2) |
44 |
(1) |
2,938 |
1,158 |
4,096 |
|
Never been in a treatment program |
82 |
(5) |
48 |
(8) |
130 |
(6) |
17 |
(1) |
9 |
(2) |
26 |
(1) |
13 |
(1) |
6 |
(1) |
19 |
(1) |
1,760 |
590 |
2,350 |
|
HIV test result |
|||||||||||||||||||||
|
Negative |
354 |
(5) |
286 |
(11) |
640 |
(7) |
72 |
(1) |
41 |
(2) |
113 |
(1) |
67 |
(1) |
43 |
(2) |
110 |
(1) |
6,646 |
2,539 |
9,185 |
|
Positive |
18 |
(6) |
13 |
(12) |
31 |
(8) |
— |
— |
— |
— |
8 |
(2) |
— |
— |
— |
— |
8 |
(2) |
292 |
105 |
397 |
|
MSA |
|||||||||||||||||||||
|
Atlanta, Georgia |
18 |
(5) |
11 |
(17) |
29 |
(7) |
— |
— |
— |
— |
— |
— |
8 |
(2) |
— |
— |
12 |
(3) |
337 |
64 |
401 |
|
Baltimore, Maryland |
14 |
(4) |
19 |
(15) |
33 |
(7) |
— |
— |
— |
— |
7 |
(1) |
— |
— |
— |
— |
— |
— |
341 |
130 |
471 |
|
Boston, Massachusetts |
33 |
(8) |
36 |
(19) |
69 |
(12) |
— |
— |
— |
— |
— |
— |
— |
— |
— |
— |
7 |
(1) |
394 |
194 |
588 |
|
Chicago, Illinois |
14 |
(4) |
— |
— |
19 |
(4) |
— |
— |
— |
— |
— |
— |
— |
— |
— |
— |
— |
— |
374 |
153 |
527 |
|
Dallas, Texas |
18 |
(4) |
26 |
(13) |
44 |
(7) |
— |
— |
7 |
(4) |
10 |
(2) |
— |
— |
— |
— |
6 |
(1) |
423 |
197 |
620 |
|
Denver, Colorado |
10 |
(4) |
11 |
(8) |
21 |
(5) |
— |
— |
— |
— |
— |
— |
— |
— |
— |
— |
— |
— |
283 |
130 |
413 |
|
Detroit, Michigan |
39 |
(14) |
24 |
(19) |
63 |
(15) |
6 |
(2) |
— |
— |
9 |
(2) |
— |
— |
— |
— |
— |
— |
282 |
127 |
409 |
|
Houston, Texas |
16 |
(4) |
15 |
(15) |
31 |
(6) |
— |
— |
— |
— |
7 |
(1) |
— |
— |
— |
— |
6 |
(1) |
407 |
100 |
507 |
|
Los Angeles, California |
21 |
(6) |
12 |
(9) |
33 |
(7) |
— |
— |
— |
— |
— |
— |
7 |
(2) |
— |
— |
12 |
(2) |
372 |
134 |
506 |
|
Miami, Florida |
14 |
(3) |
13 |
(11) |
27 |
(5) |
6 |
(1) |
— |
— |
9 |
(2) |
— |
— |
— |
— |
— |
— |
422 |
120 |
542 |
|
New York, New York |
13 |
(3) |
10 |
(9) |
23 |
(5) |
— |
— |
— |
— |
— |
— |
— |
— |
— |
— |
— |
— |
372 |
113 |
485 |
|
Nassau-Suffolk, New York |
27 |
(24) |
18 |
(23) |
45 |
(24) |
— |
— |
— |
— |
7 |
(4) |
— |
— |
— |
— |
— |
— |
114 |
77 |
191 |
|
New Orleans, Louisiana |
28 |
(6) |
6 |
(6) |
34 |
(6) |
9 |
(2) |
— |
— |
11 |
(2) |
7 |
(1) |
— |
— |
7 |
(1) |
491 |
103 |
594 |
|
Newark, New Jersey |
18 |
(7) |
14 |
(11) |
32 |
(8) |
— |
— |
— |
— |
6 |
(2) |
9 |
(3) |
— |
— |
13 |
(3) |
259 |
122 |
381 |
|
Philadelphia, Pennsylvania |
14 |
(4) |
16 |
(13) |
30 |
(6) |
— |
— |
— |
— |
— |
— |
— |
— |
— |
— |
— |
— |
389 |
123 |
512 |
|
San Diego, California |
38 |
(9) |
21 |
(12) |
59 |
(10) |
7 |
(2) |
— |
— |
8 |
(1) |
6 |
(1) |
— |
— |
10 |
(2) |
431 |
181 |
612 |
|
San Francisco, California |
11 |
(3) |
10 |
(6) |
21 |
(4) |
— |
— |
— |
— |
— |
— |
— |
— |
— |
— |
— |
— |
323 |
159 |
482 |
|
San Juan, Puerto Rico |
12 |
(3) |
11 |
(15) |
23 |
(5) |
6 |
(2) |
8 |
(11) |
14 |
(3) |
— |
— |
— |
— |
— |
— |
363 |
73 |
436 |
|
Seattle, Washington |
11 |
(4) |
9 |
(5) |
20 |
(4) |
— |
— |
— |
— |
— |
— |
— |
— |
— |
— |
— |
— |
300 |
174 |
474 |
|
Washington, DC |
8 |
(3) |
15 |
(8) |
23 |
(5) |
— |
— |
— |
— |
— |
— |
— |
— |
— |
— |
— |
— |
315 |
186 |
501 |
|
Total |
377 |
(5) |
302 |
(11) |
679 |
(7) |
78 |
(1) |
46 |
(2) |
124 |
(1) |
72 |
(1) |
46 |
(2) |
118 |
(1) |
6,992 |
2,660 |
9,652 |
|
Abbreviations: HIV = human immunodeficiency virus; MSA = metropolitan statistical area/division; STD = sexually transmitted disease. * Sample excludes participants who reported a previous positive HIV test result. Numbers might not add to totals because of missing data. † Includes syphilis, gonorrhea, chlamydia, herpes, or other reported STDs. § The proportion is that of all male participants. ¶ The proportion is that of all female participants. ** The proportion is that of all participants. †† Suppressed because of small sample size (five or fewer participants). §§ Persons of Hispanic/Latino ethnicity might be of any race or combination of races. ¶¶ Poverty level is based on household income and household size. *** Injected separately with equal frequency or combined as speedball. ††† Other drugs injected alone or two or more drugs injected with the same frequency. §§§ Includes outpatient, residential, detoxification, and methadone treatment programs. |
|||||||||||||||||||||
|
TABLE 11. (Continued) Number and percentage of participants* who reported receiving a diagnosis of gonorrhea or chlamydia during the past 12 months, by selected characteristics — National HIV Behavioral Surveillance System: Injecting Drug Users, 20 U.S. cities, 2009 |
|||||||||||||||
|---|---|---|---|---|---|---|---|---|---|---|---|---|---|---|---|
|
Characteristic |
Gonorrhea |
Chlamydia |
Total males |
Total females |
Total |
||||||||||
|
Male |
Female |
Total |
Male |
Female |
Total |
||||||||||
|
No. |
(%)† |
No. |
(%)§ |
No. |
(%)¶ |
No. |
(%)† |
No. |
(%)§ |
No. |
(%)¶ |
||||
|
Alcohol or drug treatment program††† |
|||||||||||||||
|
≤12 months before interview |
43 |
(2) |
28 |
(3) |
71 |
(2) |
43 |
(2) |
49 |
(5) |
92 |
(3) |
2,291 |
911 |
3,202 |
|
>12 months before interview |
68 |
(2) |
27 |
(2) |
95 |
(2) |
31 |
(1) |
49 |
(4) |
80 |
(2) |
2,938 |
1,158 |
4,096 |
|
Never been in a treatment program |
38 |
(2) |
12 |
(2) |
50 |
(2) |
15 |
(1) |
21 |
(4) |
36 |
(2) |
1,760 |
590 |
2,350 |
|
HIV test result |
|||||||||||||||
|
Negative |
137 |
(2) |
63 |
(2) |
200 |
(2) |
88 |
(1) |
113 |
(4) |
201 |
(2) |
6,646 |
2,539 |
9,185 |
|
Positive |
9 |
(3) |
— |
— |
12 |
(3) |
— |
— |
— |
— |
— |
— |
292 |
105 |
397 |
|
MSA |
|||||||||||||||
|
Atlanta, Georgia |
— |
— |
— |
— |
— |
— |
6 |
(2) |
— |
— |
6 |
(1) |
337 |
64 |
401 |
|
Baltimore, Maryland |
— |
— |
— |
— |
— |
— |
— |
— |
— |
— |
9 |
(2) |
341 |
130 |
471 |
|
Boston, Massachusetts |
12 |
(3) |
7 |
(4) |
19 |
(3) |
14 |
(4) |
12 |
(6) |
26 |
(4) |
394 |
194 |
588 |
|
Chicago, Illinois |
— |
— |
— |
— |
— |
— |
— |
— |
— |
— |
— |
— |
374 |
153 |
527 |
|
Dallas, Texas |
9 |
(2) |
7 |
(4) |
16 |
(3) |
— |
— |
11 |
(6) |
16 |
(3) |
423 |
197 |
620 |
|
Denver, Colorado |
— |
— |
— |
— |
— |
— |
— |
— |
— |
— |
(6) |
— |
283 |
130 |
413 |
|
Detroit, Michigan |
31 |
(11) |
10 |
(8) |
41 |
(10) |
11 |
(4) |
11 |
(9) |
22 |
(5) |
282 |
127 |
409 |
|
Houston, Texas |
— |
— |
— |
— |
10 |
(2) |
— |
— |
6 |
(6) |
10 |
(2) |
407 |
100 |
507 |
|
Los Angeles, California |
— |
— |
— |
— |
9 |
(2) |
6 |
(2) |
— |
— |
11 |
(2) |
372 |
134 |
506 |
|
Miami, Florida |
6 |
(1) |
— |
— |
10 |
(2) |
— |
— |
6 |
(5) |
7 |
(1) |
422 |
120 |
542 |
|
New York, New York |
6 |
(2) |
— |
— |
6 |
(1) |
— |
— |
— |
— |
7 |
(1) |
372 |
113 |
485 |
|
Nassau-Suffolk, New York |
21 |
(18) |
8 |
(10) |
29 |
(15) |
— |
— |
10 |
(13) |
13 |
(7) |
114 |
77 |
191 |
|
New Orleans, Louisiana |
8 |
(2) |
— |
— |
8 |
(1) |
— |
— |
— |
— |
— |
— |
491 |
103 |
594 |
|
Newark, New Jersey |
— |
— |
— |
— |
6 |
(2) |
— |
— |
6 |
(5) |
8 |
(2) |
259 |
122 |
381 |
|
Philadelphia, Pennsylvania |
6 |
(2) |
— |
— |
8 |
(2) |
— |
— |
10 |
(8) |
13 |
(3) |
389 |
123 |
512 |
|
San Diego, California |
15 |
(3) |
7 |
(4) |
22 |
(4) |
10 |
(2) |
12 |
(7) |
22 |
(4) |
431 |
181 |
612 |
|
San Francisco, California |
— |
— |
— |
— |
— |
— |
— |
— |
— |
— |
8 |
(2) |
323 |
159 |
482 |
|
San Juan, Puerto Rico |
— |
— |
— |
— |
7 |
(2) |
— |
— |
— |
— |
— |
— |
363 |
73 |
436 |
|
Seattle, Washington |
— |
— |
— |
— |
— |
— |
— |
— |
— |
— |
8 |
(2) |
300 |
174 |
474 |
|
Washington, DC |
— |
— |
— |
— |
6 |
(1) |
— |
— |
— |
— |
— |
— |
315 |
186 |
501 |
|
Total |
149 |
(2) |
67 |
(3) |
216 |
(2) |
89 |
(1) |
119 |
(4) |
208 |
(2) |
6,992 |
2,660 |
9,652 |
|
Abbreviations: HIV = human immunodeficiency virus; MSA = metropolitan statistical area/division. * Sample excludes participants who reported a previous positive HIV test result. Numbers might not add to totals because of missing data. † The proportion is that of all male participants. § The proportion is that of all female participants. ¶ The proportion is that of all participants. ** Suppressed because of small sample size (five or fewer participants). †† Persons of Hispanic/Latino ethnicity might be of any race or combination of races. §§ Poverty level is based on household income and household size. ¶¶ Injected separately with equal frequency or combined as speedball. *** Other drugs injected alone or two or more drugs injected with the same frequency. ††† Includes outpatient, residential, detoxification, and methadone treatment programs. |
|||||||||||||||
|
TABLE 12. (Continued) Number and percentage of participants* who ever received a hepatitis C test or diagnosis, by selected characteristics — National HIV Behavioral Surveillance System: Injecting Drug Users, 20 U.S. cities, 2009 |
|||||
|---|---|---|---|---|---|
|
Characteristic |
Hepatitis C test† |
Hepatitis C diagnosis§ |
Total |
||
|
No. |
(%) |
No. |
(%) |
||
|
Receptive sharing of injecting equipment,††† past 12 months |
|||||
|
Yes |
4,117 |
(74) |
2,481 |
(44) |
5,588 |
|
No |
2,847 |
(73) |
1,379 |
(36) |
3,880 |
|
Receptive sharing of syringes to divide drug,§§§ past 12 months |
|||||
|
Yes |
2,424 |
(72) |
1,506 |
(45) |
3,361 |
|
No |
4,398 |
(74) |
2,256 |
(38) |
5,929 |
|
HIV test result |
|||||
|
Negative |
6,811 |
(74) |
3,777 |
(41) |
9,185 |
|
Positive |
234 |
(59) |
134 |
(34) |
397 |
|
MSA |
|||||
|
Atlanta, Georgia |
259 |
(65) |
83 |
(21) |
401 |
|
Baltimore, Maryland |
370 |
(79) |
232 |
(49) |
471 |
|
Boston, Massachusetts |
494 |
(84) |
339 |
(58) |
588 |
|
Chicago, Illinois |
333 |
(63) |
124 |
(24) |
527 |
|
Dallas, Texas |
439 |
(71) |
259 |
(42) |
620 |
|
Denver, Colorado |
329 |
(80) |
201 |
(49) |
413 |
|
Detroit, Michigan |
237 |
(58) |
136 |
(33) |
409 |
|
Houston, Texas |
357 |
(70) |
133 |
(26) |
507 |
|
Los Angeles, California |
413 |
(82) |
275 |
(54) |
506 |
|
Miami, Florida |
379 |
(70) |
227 |
(42) |
542 |
|
New York, New York |
371 |
(76) |
239 |
(49) |
485 |
|
Nassau-Suffolk, New York |
134 |
(70) |
58 |
(30) |
191 |
|
New Orleans, Louisiana |
389 |
(65) |
136 |
(23) |
594 |
|
Newark, New Jersey |
291 |
(76) |
140 |
(37) |
381 |
|
Philadelphia, Pennsylvania |
397 |
(78) |
250 |
(49) |
512 |
|
San Diego, California |
406 |
(66) |
215 |
(35) |
612 |
|
San Francisco, California |
424 |
(88) |
284 |
(59) |
482 |
|
San Juan, Puerto Rico |
289 |
(66) |
136 |
(31) |
436 |
|
Seattle, Washington |
403 |
(85) |
261 |
(55) |
474 |
|
Washington, DC |
381 |
(76) |
203 |
(41) |
501 |
|
Total |
7,095 |
(74) |
3,931 |
(41) |
9,652 |
|
Abbreviations: HIV = human immunodeficiency virus; MSA = metropolitan statistical area/division. * Sample excludes participants who reported a previous positive HIV test result. Numbers might not add to totals because of missing data. † Reported ever being told that they had hepatitis C infection by a health-care provider or ever having a blood test to check for hepatitis C infection. Because hepatitis C testing information was not directly collected from all participants, calculating the proportion of HCV diagnosis among those tested is discouraged. § Reported ever being told that they had hepatitis C infection by a health-care provider. ¶ Persons of Hispanic/Latino ethnicity might be of any race. ** Poverty level is based on household income and household size. †† Injected separately with equal frequency or combined as speedball. §§ Other drugs injected alone or two or more drugs injected with the same frequency. ¶¶ Includes outpatient, residential, detox, and methadone treatment programs. *** Used a needle and syringe that someone else had previously used to inject. ††† Used cooker (e.g., spoon or bottle cap), cotton (used to filter particles from drug solution), or water (used for rinsing needles or preparing drugs) that had already been used by someone else. §§§ Divided a drug solution with a syringe that someone else had previously used to inject. |
|||||
|
TABLE 13. (Continued) Number and percentage of participants* who reported testing for HIV infection, by selected characteristics — National HIV Behavioral Surveillance System: Injecting Drug Users, 20 U.S. cities, 2009 |
|||||
|---|---|---|---|---|---|
|
Characteristic |
Ever tested |
Tested during |
Total |
||
|
No. |
(%) |
No. |
(%) |
||
|
Alcohol or drug treatment program†† |
|||||
|
≤12 months before interview |
2,956 |
(92) |
1,886 |
(59) |
3,202 |
|
>12 months before interview |
3,697 |
(90) |
1,861 |
(45) |
4,096 |
|
Never been in a treatment program |
1,882 |
(80) |
939 |
(40) |
2,350 |
|
HIV test result |
|||||
|
Negative |
8,197 |
(89) |
4,560 |
(50) |
9,185 |
|
Positive |
281 |
(71) |
96 |
(24) |
397 |
|
MSA |
|||||
|
Atlanta, Georgia |
358 |
(89) |
196 |
(49) |
401 |
|
Baltimore, Maryland |
446 |
(95) |
301 |
(64) |
471 |
|
Boston, Massachusetts |
514 |
(87) |
293 |
(50) |
588 |
|
Chicago, Illinois |
471 |
(89) |
285 |
(54) |
527 |
|
Dallas, Texas |
548 |
(88) |
207 |
(33) |
620 |
|
Denver, Colorado |
358 |
(87) |
191 |
(46) |
413 |
|
Detroit, Michigan |
311 |
(76) |
109 |
(27) |
409 |
|
Houston, Texas |
453 |
(89) |
224 |
(44) |
507 |
|
Los Angeles, California |
455 |
(90) |
230 |
(45) |
506 |
|
Miami, Florida |
488 |
(90) |
303 |
(56) |
542 |
|
New York, New York |
443 |
(91) |
288 |
(59) |
485 |
|
Nassau-Suffolk, New York |
143 |
(75) |
56 |
(29) |
191 |
|
New Orleans, Louisiana |
478 |
(80) |
267 |
(45) |
594 |
|
Newark, New Jersey |
348 |
(91) |
233 |
(61) |
381 |
|
Philadelphia, Pennsylvania |
447 |
(87) |
243 |
(47) |
512 |
|
San Diego, California |
504 |
(82) |
175 |
(29) |
612 |
|
San Francisco, California |
466 |
(97) |
305 |
(63) |
482 |
|
San Juan, Puerto Rico |
378 |
(87) |
172 |
(39) |
436 |
|
Seattle, Washington |
442 |
(93) |
230 |
(49) |
474 |
|
Washington, DC |
488 |
(97) |
381 |
(76) |
501 |
|
Total |
8,539 |
(88) |
4,689 |
(49) |
9,652 |
|
Abbreviations: HIV = human immunodeficiency virus; MSA = metropolitan statistical area/division. * Sample excludes participants who reported a previous positive HIV test result. Numbers might not add to totals because of missing data. † Persons of Hispanic/Latino ethnicity might be of any race or combination of races. § Poverty level is based on household income and household size. ¶ Injected separately with equal frequency or combined as speedball. ** Other drugs injected alone or two or more drugs injected with the same frequency. †† Includes outpatient, residential, detoxification, and methadone treatment programs. |
|||||
|
TABLE 16. (Continued) Number and percentage of participants* who received HIV prevention materials or services during the past 12 months, by selected characteristics — National HIV Behavioral Surveillance System: Injecting Drug Users, 20 U.S. cities, 2009 |
|||||||||||||||||
|---|---|---|---|---|---|---|---|---|---|---|---|---|---|---|---|---|---|
|
Characteristic |
Materials |
Services |
Total |
||||||||||||||
|
Free sterile syringes |
Free injection equipment† |
Free condoms |
Alcohol or drug treatment programs§ |
Individual-level intervention¶ |
Group-level intervention** |
Individual- or group-level intervention |
HIV testing |
||||||||||
|
No. |
(%) |
No. |
(%) |
No. |
(%) |
No. |
(%) |
No. |
(%) |
No. |
(%) |
No. |
(%) |
No. |
(%) |
||
|
Alcohol or drug treatment program |
|||||||||||||||||
|
≤12 months before interview |
1,507 |
(47) |
1,397 |
(44) |
1,773 |
(55) |
3,202 |
(100) |
820 |
(26) |
507 |
(16) |
1,045 |
(33) |
1,886 |
(59) |
3,202 |
|
>12 months before interview |
1,823 |
(45) |
1,690 |
(41) |
2,010 |
(49) |
NA |
NA |
570 |
(14) |
285 |
(7) |
713 |
(17) |
1,861 |
(45) |
4,096 |
|
Never been in a treatment program |
914 |
(39) |
820 |
(35) |
1,054 |
(45) |
NA |
NA |
241 |
(10) |
112 |
(5) |
291 |
(12) |
939 |
(40) |
2,350 |
|
HIV test result |
|||||||||||||||||
|
Negative |
4,002 |
(44) |
3,699 |
(40) |
4,565 |
(50) |
3,083 |
(34) |
1,539 |
(17) |
864 |
(9) |
1,941 |
(21) |
4,560 |
(50) |
9,185 |
|
Positive |
205 |
(52) |
174 |
(44) |
236 |
(59) |
99 |
(25) |
77 |
(19) |
33 |
(8) |
92 |
(23) |
96 |
(24) |
397 |
|
MSA |
|||||||||||||||||
|
Atlanta, Georgia |
186 |
(46) |
147 |
(37) |
226 |
(56) |
91 |
(23) |
55 |
(14) |
56 |
(14) |
85 |
(21) |
196 |
(49) |
401 |
|
Baltimore, Maryland |
284 |
(60) |
271 |
(58) |
278 |
(59) |
189 |
(40) |
110 |
(23) |
51 |
(11) |
130 |
(28) |
301 |
(64) |
471 |
|
Boston, Massachusetts |
285 |
(48) |
289 |
(49) |
330 |
(56) |
346 |
(59) |
167 |
(28) |
118 |
(20) |
223 |
(38) |
293 |
(50) |
588 |
|
Chicago, Illinois |
349 |
(66) |
336 |
(64) |
285 |
(54) |
161 |
(31) |
72 |
(14) |
20 |
(4) |
80 |
(15) |
285 |
(54) |
527 |
|
Dallas, Texas |
57 |
(9) |
58 |
(9) |
135 |
(22) |
209 |
(34) |
84 |
(14) |
42 |
(7) |
97 |
(16) |
207 |
(33) |
620 |
|
Denver, Colorado |
61 |
(15) |
114 |
(28) |
176 |
(43) |
168 |
(41) |
126 |
(31) |
96 |
(23) |
158 |
(38) |
191 |
(46) |
413 |
|
Detroit, Michigan |
131 |
(32) |
79 |
(19) |
115 |
(28) |
99 |
(24) |
20 |
(5) |
7 |
(2) |
22 |
(5) |
109 |
(27) |
409 |
|
Houston, Texas |
33 |
(7) |
16 |
(3) |
256 |
(50) |
118 |
(23) |
84 |
(17) |
62 |
(12) |
121 |
(24) |
224 |
(44) |
507 |
|
Los Angeles, California |
358 |
(71) |
313 |
(62) |
304 |
(60) |
190 |
(38) |
57 |
(11) |
35 |
(7) |
74 |
(15) |
230 |
(45) |
506 |
|
Miami, Florida |
18 |
(3) |
11 |
(2) |
185 |
(34) |
114 |
(21) |
16 |
(3) |
8 |
(1) |
20 |
(4) |
303 |
(56) |
542 |
|
New York, New York |
396 |
(82) |
394 |
(81) |
305 |
(63) |
240 |
(49) |
66 |
(14) |
37 |
(8) |
83 |
(17) |
288 |
(59) |
485 |
|
Nassau-Suffolk, New York |
39 |
(20) |
14 |
(7) |
60 |
(31) |
83 |
(43) |
25 |
(13) |
7 |
(4) |
27 |
(14) |
56 |
(29) |
191 |
|
New Orleans, Louisiana |
68 |
(11) |
44 |
(7) |
289 |
(49) |
182 |
(31) |
71 |
(12) |
41 |
(7) |
94 |
(16) |
267 |
(45) |
594 |
|
Newark, New Jersey |
103 |
(27) |
73 |
(19) |
166 |
(44) |
143 |
(38) |
78 |
(20) |
24 |
(6) |
84 |
(22) |
233 |
(61) |
381 |
|
Philadelphia, Pennsylvania |
304 |
(59) |
292 |
(57) |
235 |
(46) |
195 |
(38) |
106 |
(21) |
45 |
(9) |
139 |
(27) |
243 |
(47) |
512 |
|
San Diego, California |
131 |
(21) |
86 |
(14) |
174 |
(28) |
158 |
(26) |
53 |
(9) |
17 |
(3) |
64 |
(10) |
175 |
(29) |
612 |
|
San Francisco, California |
399 |
(83) |
372 |
(77) |
329 |
(68) |
121 |
(25) |
81 |
(17) |
48 |
(10) |
110 |
(23) |
305 |
(63) |
482 |
|
San Juan, Puerto Rico |
318 |
(73) |
292 |
(67) |
296 |
(68) |
83 |
(19) |
111 |
(25) |
47 |
(11) |
124 |
(28) |
172 |
(39) |
436 |
|
Seattle, Washington |
406 |
(86) |
400 |
(84) |
306 |
(65) |
167 |
(35) |
97 |
(20) |
39 |
(8) |
117 |
(25) |
230 |
(49) |
474 |
|
Washington, DC |
321 |
(64) |
309 |
(62) |
390 |
(78) |
145 |
(29) |
154 |
(31) |
104 |
(21) |
199 |
(40) |
381 |
(76) |
501 |
|
Total |
4,247 |
(44) |
3,910 |
(41) |
4,840 |
(50) |
3,202 |
(33) |
1,633 |
(17) |
904 |
(9) |
2,051 |
(21) |
4,689 |
(49) |
9,652 |
|
Abbreviations: HIV = human immunodeficiency virus; MSA = metropolitan statistical area/division; NA = not applicable. * Sample excludes participants who reported a previous positive HIV test result. Numbers might not add to totals because of missing data. † Free injection equipment was defined as kits that have items such as cookers, cotton, or water for rinsing needles for preparing drugs. § Includes outpatient, residential, detoxification, and methadone treatment programs. ¶ One-on-one conversation with an outreach worker, a counselor, or a prevention program worker about ways to prevent HIV excluding those that were part of HIV testing. ** Small-group discussion to discuss ways of preventing HIV that is part of an organized session and excludes discussions with friends. †† Suppressed because of small sample size (five or fewer participants). §§ Persons of Hispanic/Latino ethnicity might be of any race or combination of races. ¶¶ Poverty level is based on household income and household size. *** Injected separately with equal frequency or combined as speedball. ††† Other drugs injected alone or two or more drugs injected with the same frequency. |
|||||||||||||||||
Use of trade names and commercial sources is for identification only and does not imply endorsement by the U.S. Department of
Health and Human Services.
References to non-CDC sites on the Internet are
provided as a service to MMWR readers and do not constitute or imply
endorsement of these organizations or their programs by CDC or the U.S.
Department of Health and Human Services. CDC is not responsible for the content
of pages found at these sites. URL addresses listed in MMWR were current as of
the date of publication.
All MMWR HTML versions of articles are electronic conversions from typeset documents.
This conversion might result in character translation or format errors in the HTML version.
Users are referred to the electronic PDF version (http://www.cdc.gov/mmwr)
and/or the original MMWR paper copy for printable versions of official text, figures, and tables.
An original paper copy of this issue can be obtained from the Superintendent of Documents, U.S.
Government Printing Office (GPO), Washington, DC 20402-9371;
telephone: (202) 512-1800. Contact GPO for current prices.
**Questions or messages regarding errors in formatting should be addressed to
mmwrq@cdc.gov.
