Skip directly to search Skip directly to A to Z list Skip directly to site content
CDC Home

Persons using assistive technology might not be able to fully access information in this file. For assistance, please send e-mail to: mmwrq@cdc.gov. Type 508 Accommodation and the title of the report in the subject line of e-mail.

Surveillance for Violent Deaths — National Violent Death Reporting System, 16 States, 2009

Debra L. Karch, PhD

Joseph Logan, PhD

Dawn McDaniel, PhD

Sharyn Parks, PhD

Nimesh Patel, MS

Division of Violence Prevention, National Center for Injury Prevention and Control, CDC


Corresponding author: Joseph Logan, PhD, Division of Violence Prevention, National Center for Injury Prevention and Control, CDC, 4770 Buford Hwy, N.E., MS F-64, Atlanta, GA 30341-3724. Telephone: 770-488-1529; Fax: 770-488-4222; E-mail: jlogan@cdc.gov.

Abstract

Problem/Condition: An estimated 50,000 persons die annually in the United States as a result of violence-related injuries. This report summarizes data from CDC's National Violent Death Reporting System (NVDRS) regarding violent deaths from 16 U.S. states for 2009. Results are reported by sex, age group, race/ethnicity, marital status, location of injury, method of injury, circumstances of injury, and other selected characteristics.

Reporting Period Covered: 2009.

Description of System: NVDRS collects data regarding violent deaths obtained from death certificates, coroner/medical examiner reports, and law enforcement reports. NVDRS data collection began in 2003 with seven states (Alaska, Maryland, Massachusetts, New Jersey, Oregon, South Carolina, and Virginia) participating; six states (Colorado, Georgia, North Carolina, Oklahoma, Rhode Island, and Wisconsin) joined in 2004, four (California, Kentucky, New Mexico, and Utah) in 2005, and two (Ohio and Michigan) in 2010, for a total of 19 states. This report includes data from 16 states that collected statewide data in 2009. California is excluded because data were collected in only four counties. Ohio and Michigan are excluded because data collection did not begin until 2010.

Results: For 2009, a total of 15,981 fatal incidents involving 16,418 deaths were captured by NVDRS in the 16 states included in this report. The majority (60.6%) of deaths were suicides, followed by homicides and deaths involving legal intervention (i.e., deaths caused by police and other persons with legal authority to use deadly force, excluding legal executions) (24.7%), deaths of undetermined intent (14.2%), and unintentional firearm deaths (0.5%). Suicides occurred at higher rates among males, non-Hispanic whites, American Indians/Alaska Natives, and persons aged 45–54 years. Suicides occurred most often in a house or apartment and involved the use of firearms. Suicides were preceded primarily by mental health, intimate partner, or physical health problems or by a crisis during the previous 2 weeks. Homicides occurred at higher rates among males and persons aged 20–24 years; rates were highest among non-Hispanic black males. The majority of homicides involved the use of a firearm and occurred in a house or apartment or on a street/highway. Homicides were preceded primarily by arguments and interpersonal conflicts or in conjunction with another crime. Characteristics associated with other manners of death, circumstances preceding death, and special populations also are highlighted in this report.

Interpretation: This report provides a detailed summary of data from NVDRS for 2009. The results indicate that violent deaths resulting from self-inflicted or interpersonal violence disproportionately affected adults aged <55 years, males, and certain racial/ethnic minority populations. For homicides and suicides, relationship problems, interpersonal conflicts, mental health problems, and recent crises were among the primary factors that might have precipitated the fatal injuries. Because additional information might be reported subsequently as participating states update their findings, the data provided in this report are preliminary.

Public Health Action: For the occurrence of violent deaths in the United States to be better understood and ultimately prevented, accurate, timely, and comprehensive surveillance data are necessary. NVDRS data can be used to monitor the occurrence of violence-related fatal injuries and assist public health authorities in the development, implementation, and evaluation of programs and policies to reduce and prevent violent deaths at the national, state, and local levels. The continued development and expansion of NVDRS is essential to CDC's efforts to reduce the personal, familial, and societal costs of violence. Additional efforts are needed to increase the number of states participating in NVDRS, with an ultimate goal of full national representation.

Introduction

An estimated 50,000 persons die annually in the United States as a result of violence-related injuries. Homicide is the second leading cause of death for persons aged 15–24 years, the third leading cause for persons aged 1–4 and 25–34 years, and the fourth leading cause for persons aged 5–9 and 10–14 years. Suicide is the second leading cause of death for persons aged 25–34 years, the third leading cause for persons aged 10–14 years and 15–24 years, and the fourth leading cause for persons aged 35–44 and 45–54 years. Only unintentional injury in those aged 1–44 years and malignant neoplasms and congenital anomalies in children aged 1–14 years of age were more common (1).

Public health authorities require accurate, timely, and comprehensive surveillance data to better understand and ultimately prevent the occurrence of violent deaths in the United States (2). In 2000, CDC started planning to implement the National Violent Death Reporting System (NVDRS) (3,4). The goals of this system are to:

  • collect and analyze timely, high-quality data that monitor the magnitude and characteristics of violent death at the national, state, and local levels;
  • ensure that data are disseminated routinely and expeditiously to public health officials, law enforcement officials, policy makers, and the public;
  • ensure that data are used to develop, implement, and evaluate programs and strategies that are intended to reduce and prevent violent deaths and injuries at the national, state, and local levels; and
  • build and strengthen partnerships among organizations and communities at the national, state, and local levels to ensure that data are collected and used to reduce and prevent violent deaths and injuries.

NVDRS was conceived as a state-based active surveillance system that would collect risk-factor data concerning all violence-related deaths, including homicides, suicides, and legal intervention deaths (i.e., deaths caused by police and other persons with legal authority to use deadly force; excluding legal executions), as well as unintentional firearm deaths and deaths of undetermined intent. NVDRS data are used to assist the development, implementation, and evaluation of programs and strategies designed to reduce and prevent these deaths and injuries at the national, state, and local levels.

Before implementation of NVDRS, single data sources (e.g., death certificates or law enforcement data systems) provided only limited information and few circumstances from which to understand patterns of deaths collected by this system. NVDRS fills this gap in national surveillance; it is the first system to provide detailed information on circumstances precipitating violent deaths, the first to link multiple source documents to enable researchers to understand each death more completely, and the first to link multiple deaths that are related to one another (e.g., multiple homicides, suicide pacts, and cases of homicide followed by the suicide of the suspected perpetrator).

NVDRS began data collection in 2003 with seven states (Alaska, Maryland, Massachusetts, New Jersey, Oregon, South Carolina, and Virginia) participating; six states (Colorado, Georgia, North Carolina, Oklahoma, Rhode Island, and Wisconsin) joined in 2004, four more (California, Kentucky, New Mexico, and Utah) in 2005; and two (Ohio and Michigan) in 2010 for a total of 19 states (Figure). CDC provides funding for state participation and anticipates that NVDRS will expand to include all 50 states, the District of Columbia, and U.S. territories.

This report summarizes data for 2009 for deaths meeting NVDRS inclusion criteria from 16 states that collected statewide data (approximately 26% of the U.S. population). California data are not included in this report because data were collected in only four counties. Ohio and Michigan were excluded because data collection did not begin until 2010. Because additional information might be reported subsequently as participating states update their findings, the data provided in this report are preliminary. Annual updates of NVDRS data also are available through a web-based query system (WISQARS) at http://wisqars.cdc.gov:8080/nvdrs/nvdrsDisplay.jsp.

Methods

NVDRS uses multiple, complementary data sources, including death certificates, coroner/medical examiner (CME) records, and law enforcement reports. In addition, some participating states use secondary sources (e.g., child fatality review team data, supplementary homicide reports, hospital data, crime laboratory data, and trace information from the Bureau of Alcohol, Tobacco, Firearms, and Explosives concerning firearms). NVDRS links multiple documents for each death and also links multiple deaths that are related to each other (e.g., multiple homicides, a homicide followed by a suicide, or multiple suicides) into a single incident. The ability to analyze data linked in this way permits a comprehensive assessment of violent deaths.

NVDRS defines a violent death as a death resulting either from the intentional use of physical force or power against oneself, another person, or a group or community. In addition, NVDRS collects information regarding unintentional firearm injury deaths (i.e., incidents in which the person causing the injury did not intend to discharge the firearm) and deaths of undetermined intent. NVDRS case definitions are coded on the basis of the International Classification of Diseases, Tenth Revision (ICD-10) (5). Cases with selected ICD-10 codes are included in NVDRS (Box 1). ICD-10 case finding is completed by participating states.

Variables analyzed in NVDRS include the following:

  • manner of death (i.e., the intent of the person inflicting a fatal injury);
  • mechanism of injury (i.e., the method used to inflict a fatal injury);
  • circumstances preceding injury (i.e., the events that preceded and therefore might have contributed to the infliction of a fatal injury);
  • whether the decedent was a victim (i.e., a person who died as a result of a violence-related injury);
  • whether the decedent was a suspect (i.e., a person believed to have inflicted a fatal injury on a victim);
  • whether the decedent was both a suspect and a victim (i.e., a person who is believed to have inflicted a fatal injury on a victim and who then was fatally injured);
  • incident (i.e., an occurrence in which one or more persons sustained a fatal injury that was linked to a common event during a 24-hour period); and
  • type of incident (i.e., a combination of the manner of death and the number of victims in an incident).

NVDRS is an incident-based system, and all decedents (both victims and alleged perpetrators [suspects]) associated with a given incident are grouped in one record. Decisions about whether two or more deaths are related and belong to the same incident are made on the basis of the timing of the injuries rather than on that of the deaths. Examples of a violent death incident include 1) a single isolated violent death, 2) two or more related homicides (including legal interventions) when the fatal injuries were inflicted <24 hours apart, 3) two or more related suicides or deaths of undetermined intent when the fatal injuries were inflicted <24 hours apart, and 4) a homicide followed by a related suicide when both fatal injuries were inflicted <24 hours apart.

Data are obtained from individual information sources and entered into source-specific computerized data entry screens (i.e., law enforcement report data are entered into law enforcement report screens and death certificate data into death certificate screens). In addition to allowing independent entry of each source, this approach permits later review of what each source contributed and identification of missing sources. This permits comparisons of the quality and completeness of state-specific data sources and allows states to provide feedback to sources regarding the consistency of their data compared with data from other sources. In addition, the system permits automatic electronic importation of specific data sources without requiring manual entry.

Abstraction of identical variables across multiple source documents can result in data inconsistencies, which NVDRS resolves by assigning a primacy (i.e., hierarchical) rule for each variable. The primacy rules are applied to create a final analysis data set that uses data from all available sources. For each variable in NVDRS, primacy is established on the basis of a hierarchy of assumed reliability of all the sources for a single variable. For example, sex is collected in all three required documents (death certificate, CME record, and law enforcement report). The primacy for sex is expressed as death certificate/CME record/law enforcement report, which means the analysis file is constructed using the sex recorded in the death certificate. If the sex is left blank or is unknown on the death certificate, the sex recorded in the CME record is used, and if the CME record does not provide the sex or lists the sex as unknown, the law enforcement report is used.

Manner of Death

A manner (i.e., intent) of death for each decedent is assigned by a trained abstractor who takes into account information from all source documents. Typically, these documents are consistent regarding the manner of death, and the abstractor-assigned manner of death corresponds to that reported in all the source documents. On rare occasions, when a discrepancy exists among the source documents, the abstractor must assign a manner of death on the basis of the preponderance of evidence in the source documents. For example, if two sources classify a death as a suicide and a third classifies it as undetermined, the death will be coded as a suicide.

NVDRS classifies data using one of five abstractor-assigned manners of death:

  • Suicide. Suicide is defined as a death resulting from the use of force against oneself when a preponderance of the evidence indicates that the use of force was intentional. This category includes deaths of persons who intended only to injure rather than kill themselves, deaths associated with risk-taking behavior without clear intent to inflict fatal injury but associated with high risk of death (e.g., "Russian roulette"), and suicides involving only passive assistance to the decedent (e.g., supplying the means or information needed to complete the act). The category does not include deaths caused by chronic or acute substance abuse without the intent to die or deaths attributed to autoerotic behavior (e.g., self-strangulation during sexual activity). Corresponding ICD-10 codes included in NVDRS are X60–X84 and Y87.0.
  • Homicide. Homicide is defined as a death resulting from the use of physical force or power, threatened or actual, against another person, group, or community when a preponderance of evidence indicates that the use of force was intentional. Two special scenarios that the National Center for Health Statistics (NCHS) regards as homicides are included in the NVDRS definition: 1) arson with no intent to injure a person and 2) a stabbing with intent unspecified. This category excludes vehicular homicide without intent to injure, unintentional firearm deaths (a separate category), combat deaths or acts of war, and deaths of unborn fetuses. Corresponding ICD-10 codes included in NVDRS are X85–X99, Y00–Y09, and Y87.1.
  • Unintentional firearm. An unintentional firearm death is a death that results from a penetrating injury or gunshot wound from a weapon that uses a powder charge to fire a projectile and for which a preponderance of evidence indicates that the shooting was not directed intentionally at the decedent. Examples of deaths included in this category include the death of a person as a result of celebratory firing that was not intended to frighten, control, or harm anyone; a soldier shot during a field exercise but not in a combat situation; and a person who received a self-inflicted wound while playing with a firearm. This category excludes firearm injuries caused by unintentionally striking a person with the firearm (e.g., hitting a person on the head with the firearm rather than firing a projectile) and unintentional injuries from nonpowder guns (e.g., BB, pellet, or other compressed air–powered or gas-powered guns). Corresponding ICD-10 codes included in NVDRS are W32–W34 and Y86 with a method of firearm.
  • Undetermined intent. A death of undetermined intent is a death that results from the use of force or power against oneself or another person for which the evidence indicating one manner of death is no more compelling than evidence indicating another. This category includes CME rulings (e.g., accident or suicide, undetermined, jumped or fell, and self-inflicted injuries) when records give no evidence or opinions in favor of either unintentional or intentional injury. Corresponding ICD-10 codes included in NVDRS are Y10–Y34, Y87.2, and Y89.9.
  • Legal intervention. A death from legal intervention is a death in which a decedent is killed by a police officer or other peace officer (a person with specified legal authority to use deadly force), including military police, acting in the line of duty. This category excludes legal executions. Corresponding ICD-10 codes included in NVDRS are Y35.0–Y35.4, Y35.6, Y35.7, and Y89.0.

Variables Analyzed

NVDRS collects approximately 250 unique variables (available at http://www.cdc.gov/ViolencePrevention/NVDRS/index.html) for each death. The number of variables recorded for each incident depends on the content and completeness of the source documents. Variables include manner of death, demographics, ICD-10 and underlying cause-of-death codes and text, location and date/time of injury and death, toxicology results, bodily injuries, precipitating circumstances, decedent-suspect relationship, and method of injury (Boxes 2 and 3).

Comparability of 2008 and 2009 NVDRS Surveillance Summary Data

Three changes made to the way variables were reported between 2008 and 2009 affect their comparability. These changes involve method of injury, relationship of victim to suspect, and age limits for suicide among older adults.

Method of Injury

In 2008, weapon type for all manners of death was captured in 18 categories such as firearm, sharp instrument, blunt instrument, poisoning, and hanging/strangulation/suffocation. If a decedent was injured by multiple weapon types (e.g., a homicide decedent who experienced both stabbing and firearm injuries), the death was categorized as "firearm and other method type" rather than counted twice in both the individual firearm and sharp instrument categories because NVDRS did not specify which mechanism of the two caused the fatal wound or whether the death was attributable to both types of injuries. Changes to the 2009 software required data abstractors to code weapons as primary, secondary, or tertiary mechanisms, based on lethality, as documented in death certificate and CME reports. For example, the death of a suicide decedent with self-inflicted wrist lacerations experienced before a self-inflicted gunshot wound to the head would have two weapon codes (both firearm and sharp instrument); the primary weapon would be firearm and the secondary weapon a sharp instrument. The death of a homicide decedent who was shot in the foot and then stabbed in the heart would have a sharp instrument coded as the primary method and gunshot wound as the secondary method. The method of injury data reported in this surveillance summary are based on the primary weapon type only and do not include secondary or tertiary weapons. This change allows for better comparability with other violence-related data.

Relationship of Victim to Suspect

The relationship of the victim to the suspect is coded from a list of 31 options in NVDRS. In 2008, each decedent could have up to two relationship categories for each suspect. For example, a suspect could be both the cousin and the roommate of the decedent. As with weapon type, the relationship variables for 2009 include codes for the primary, secondary, and tertiary relationship. Abstractors code the familial relationship first (if appropriate) and then the social relationship (i.e., friend, acquaintance, babysitter, or rival gang member) if no familial relationship exists. This change allows greater specificity for those previously categorized as "more than one relationship" and for better comparability with other violence-related data.

Age Limits for Suicides Among Older Adults

The 2008 suicides among older adults included adults aged 50–59 years. To be consistent with the CDC definition of older adult (i.e., adults aged ≥60 years), the age group 50–59 years was removed in 2009; therefore, the total columns for suicides among older adults for 2009 are not comparable to (i.e., are lower than) 2008 and previous years because this age group is excluded for 2009.

Circumstances Preceding Death

The circumstances preceding death are defined as the events that preceded and therefore might have contributed to the infliction of a fatal injury (described as precipitating circumstances in this report) (Box 3). The circumstances that preceded a fatal injury are reported on the basis of the content of the CME record and police reports. Common sets of circumstances are coded for suicide/undetermined deaths, homicide/legal intervention deaths, and unintentional firearm deaths. The variable "circumstances known" is a gateway variable to a list of potential circumstances. Each incident requires the data abstractor to code all circumstances in cases for which the circumstances are known. If circumstances are not known (e.g., for a body found in the woods with no other detail), the data abstractor leaves the gateway variable blank, and these cases are excluded from the denominator for circumstance values. If either the CME record or the police report indicates that the circumstance is reported to be true, then the abstractor enters data as confirmed (e.g., if the police report indicated that a decedent had disclosed an intent to commit suicide, then suicidal intent is accepted to be true).

Coding Training and Quality Control

Coding training is held annually for all participating states. Ongoing coding support is provided through an e-mail help desk, monthly conference calls with all states, and regular conference calls with individual states. A coding manual is provided. Software features enhance coding reliability, including automated validation rules and a hover-over feature containing variable-specific information. Details regarding NVDRS procedures and coding are available at http://www.cdc.gov/ViolencePrevention/NVDRS/publications.html.

States are requested to perform blind reabstraction of cases using multiple abstractors to identify inconsistencies. CDC also runs a quality-control analysis in which multiple variables are reviewed for their appropriateness, with special focus on abstractor-assigned variables (e.g., method selection and manner of death). If CDC questions any variable, CDC notifies the state and asks for a response or correction.

Time Frame

States are required to report all deaths within 6 months of the end of each calendar year for the preceding January–December time frame. States then have an additional 12 months to complete each incident record. Although states typically meet these timelines, additional details sometimes arrive after a deadline has passed. New incidents also might be identified after the deadline; for example, if a death certificate is revised, new evidence is obtained that changes a manner of death, or a miscoded ICD-10 is corrected to meet NVDRS inclusion criteria. These additional data are incorporated into NVDRS. Analysis files are updated monthly at CDC. On the basis of previous experience, CDC estimates that case counts might increase 1%–2% after the initial 18-month data collection period.

Fatal Injuries During 2009

This report provides preliminary data concerning fatal injuries meeting the NVDRS case definition in 2009 for 16 participating states that were received by CDC as of August 31, 2011. Participating states used vital statistics death certificate files to identify violent deaths meeting NVDRS case definitions. Each state reported all deaths of their residents that occurred within the state and deaths of state residents that occurred elsewhere. Once a death was identified, NVDRS data abstractors linked source documents, linked deaths within each incident, coded data elements, and wrote a short narrative of the incident. These narratives were reviewed for all incidents in which coded data were unclear or incomplete. State-level data then were consolidated and analyzed for this aggregate report. Numbers, percentages, and crude rates are presented in aggregate for all deaths by abstractor-assigned manner of death and for special situations and populations (e.g., homicide followed by suicide, suicides of former or current military personnel, and intimate-partner–related homicides). Rates are not presented when the number of decedents for a variable is <20 because the rates are unstable. In addition, rates could not be calculated for some variables (e.g., marital status and precipitating circumstances) because denominators were unknown. Bridged-race 2009 population estimates were used as denominators in the rate calculations (6). For compatible numerators for rate calculations to be derived, records listing multiple races were recoded to a single race when possible, using a bridging algorithm provided by NCHS (available at http://www.cdc.gov/nchs/nvss/bridged_race.htm).

Results

All Deaths Captured by NVDRS

Deaths by Manner, Method, and Location

The 16 NVDRS states included in this report collected data concerning 15,981 incidents and 16,418 deaths that occurred during 2009. The crude death rate was 20.1 deaths per 100,000 population. Suicides (n = 9,949) accounted for the highest rate of violent deaths (12.2 per 100,000 population) followed by homicide/legal-intervention deaths (n = 4,057; 5.0 per 100,000 population). Deaths of undetermined intent (n = 2,325) and unintentional firearm deaths (n = 87) occurred at lower rates (2.8 and 0.1 per 100,000 population, respectively). Of all incidents occurring in 2009 in the 16 states included in this report, only 2.3% were known to have multiple victims. Firearms accounted for 48.8% of included deaths, poisoning for 19.1%, and hanging/strangulation/suffocation for 16.1% (rates: 9.8, 3.8, and 3.2 per 100,000 population, respectively); rates for other methods were lower. For all deaths, a house or apartment was the most common location (70.9%). The second most common location of injury (7.4%) was a street or highway (Table 1).

Toxicology Results of Decedent

Tests for alcohol were conducted for 72.3% of decedents, and drug tests for amphetamines, antidepressants, cocaine, marijuana, and opiates were conducted for 54.6%, 45.5%, 55.4%, 36.9%, and 55.0% of decedents, respectively. Among decedents who tested positive for alcohol (32.3%), 62.4% had a blood alcohol concentration (BAC) of ≥0.08 g/dL (the legal limit in all states). Opiates, including heroin and prescription pain killers, were identified in 25.4% of cases tested for these substances, antidepressants in 19.9%, marijuana in 12.9%, cocaine in 8.6%, and amphetamines in 3.7% (Table 2).

Suicides

Sex, Race/Ethnicity, Age Group, and Marital Status

The 16 NVDRS states included in this report collected data concerning 9,935 fatal suicide incidents and 9,949 suicides that occurred during 2009. Rates of suicide by month showed little variation throughout the year (range: 0.9–1.1 per 100,000 population) (Table 3). Overall, the crude suicide rate was 12.2 per 100,000 population. The rate for males was nearly four times that for females (19.5 and 5.1 per 100,000 population, respectively) (Table 4). Non-Hispanic whites accounted for the largest number and highest rate (15.1 per 100,000 population) of suicide deaths, followed by American Indian/Alaska Natives (AI/ANs) (14.9 per 100,000 population). The highest rates of suicide by age group occurred among persons aged 45–54 years, 35–44 years, and 55–64 years (19.2, 16.9, and 16.6 per 100,000 population, respectively). Children aged 10–14 years had the lowest rates of suicide among all age groups (1.2 per 100,000 population). Rates of suicide among adolescents aged 15–19 years (8.0 per 100,000 population) were approximately half of those for persons aged 35–64 years.

Decedents aged 35–64 years accounted for 55.9% of suicide deaths among males. Rates among males were highest for adults aged ≥85 years followed by adults aged 75–84 and 45–54 years (40.9, 29.8, and 29.6 per 100,000 population, respectively). Non-Hispanic white males and AI/AN males had the highest rates of any racial/ethnic population and had rates that were more than three times the rate for the group with the lowest rates, Hispanic males. Among females, decedents aged 35–64 years accounted for 64.8% of suicides. Rates for females peaked at 9.1 per 100,000 among those aged 45–54 years. Female suicide rates were highest among AI/ANs (7.4), followed closely by non-Hispanic whites (6.4). Among females, the lowest rates of suicide were among non-Hispanic blacks (1.7) and Hispanics (1.8). Of all suicide decedents aged ≥18 years for whom marital status was known, 38.3% were married, 29.0% had never married, and 23.7% were divorced at the time of death (Table 4).

Method and Location of Injury

Firearms were used in the majority (51.8%) of suicide deaths, followed by hanging/strangulation/suffocation (24.7%) and poisoning (17.2%) (Table 5). The most common method used by male suicide decedents was a firearm (56.7%), followed by hanging/strangulation/suffocation (25.3%). Among females, poisons were used most often (36.9%) followed by firearms (33.8%). The most common place of self-inflicted injury was a house or an apartment (76.4%), followed by natural areas (4.0%) and streets or highways (3.5%). A total of 160 (1.6%) suicides occurred in a jail or prison setting (142 males and 18 females) (Table 5).

Toxicology Results of Decedent and Precipitating Circumstances

Tests for alcohol were conducted for 69.2% of suicide decedents, and drug tests for amphetamines, antidepressants, cocaine, marijuana, and opiates were conducted for 47.3%, 41.3%, 48.1%, 36.8%, and 48.2% of suicide decedents, respectively (Table 6). Among suicide decedents who tested positive for alcohol (33.3%), 64.5% had a BAC of ≥0.08 g/dL. Opiates, including heroin and prescription pain killers, were identified in 20.8% of decedents tested for these substances; cocaine and marijuana were identified in 5.2% and 9.3% of tested decedents, respectively. Of suicide decedents who were tested for antidepressants, 23.1% were positive at the time of their death (Table 6).

Precipitating circumstances were known for approximately 90% of suicide decedents. Overall, mental health problems were the most commonly noted circumstance for suicide decedents, with 41.0% described as experiencing a depressed mood at the time of their deaths. Approximately 44.1% were described as having a diagnosed mental health problem; 31.3% were receiving treatment (Table 7). Of those with a diagnosed mental disorder, 74.1% had received a diagnosis of depression/dysthymia, 14.6% bipolar disorder, and 10.6% anxiety disorder (Table 8).

Among suicide decedents with known circumstance information, 19.8% had a history of previous suicide attempts, 28.3% disclosed their intent before dying, and 33.1% left a suicide note (Table 7). Other than mental health conditions, circumstances noted most often were intimate partner problems (31.4%) and a crisis of some kind in the preceding or impending 2 weeks (26.6%). Physical health problems also were noted in 21.0% of cases with circumstance information and job or financial problems in 14.6% and 13.8% of deaths, respectively.

Approximately 40% of male and female suicide decedents were observed to have a depressed mood at the time of death; however, a higher percentage of females than males had received a diagnosis of a mental health problem (61.3% and 39.3%, respectively) or were being treated for a mental health problem (48.9% and 26.4%, respectively) (Table 7). Among those with a diagnosed mental health problem, females were more likely than males to have received a diagnosis of bipolar, anxiety, or eating disorders, whereas males were more likely than females to have received a diagnosis of posttraumatic stress disorder (PTSD) and attention deficit disorder/attention deficit and hyperactivity disorder (ADD/ADHD) (Table 8). An estimated one fifth of both male (20.5%) and female (22.9%) suicide decedents experienced physical health problems in the period before their deaths (Table 7). Also in the period before their deaths, job problems were noted in higher proportions of males than females (15.9% and 10.0% respectively), as were financial problems (14.2% and 12.1%) and criminal legal problems (10.6% and 5.3%). Intimate partner problems also were cited as a precipitating factor in a higher percentage of male suicides than female suicides (33.0% and 25.5%, respectively). Although occurring in only a limited percentage of cases, being a perpetrator of interpersonal violence in the month before death was more common among male suicide decedents (4.8%) than being a victim of such violence (0.3%), whereas the proportions were similar for females (1.4% and 0.8%, respectively) (Table 7).

Homicides

Sex, Race/Ethnicity, Age Group, and Marital Status

The 16 NVDRS states included in this report collected data concerning 3,840 homicide incidents and 4,057 homicides that occurred during 2009. Overall, the crude homicide rate was 5.0 deaths per 100,000 population in 2009. Rates of homicide by month showed little variation throughout the year (range: 0.3–0.5 per 100,000 population) (Table 9).

The majority (54.3%) of homicide decedents aged ≥18 years for which marital status was known had never been married, and 22.8% were married at the time of their death (Table 10). In 54.2% of homicides, the relation of the victim to the suspect was not known. When a suspect was identified, the suspect most often was a spouse or intimate partner (10.3%), an acquaintance or friend (10.2%), or a stranger (4.6%). Perpetrators were other relatives of the decedent in <8.0% of cases with known information about the relation of the victim to the suspect (Table 10).

The homicide rate for males was approximately 3.2 times higher than that for females (7.7 and 2.4 per 100,000 population, respectively) (Table 11). Non-Hispanic blacks accounted for half (48.7%) of homicide deaths and had the highest rate (15.6 deaths per 100,000 population), followed by AI/ANs (9.4) and Hispanics (4.9). Overall, the highest rate was among black males (27.4 per 100,000). Age-specific homicide rates were highest (11.9 deaths per 100,000 population) among adults aged 20–24 years, followed by adults aged 25–29 years (10.0 deaths per 100,000 population). The rate for infants aged <1 year was nearly four times that for children aged 1–4 years (7.8 and 2.1 per 100,000 population, respectively). Rates were lowest among children aged 5–14 years and adults aged 75–84 years. The majority (56.2%) of all male homicide decedents were aged 15–34 years; males aged 20–24 years had the highest rates of homicide (19.6 per 100,000 population). For females, homicide rates were highest (7.1 deaths per 100,000 population) among infants aged <1 year (Table 11).

Method and Location of Injury

Firearms were used in 66.5% of homicides, followed by sharp instruments (12.9%) and blunt instruments (7.0%). No other single method was used in >3.7% of homicides (Table 9). Firearms were the most common method used in homicides of males (72.1%) and females (48.8%) (Table 12). Hanging/strangulation/suffocation was more than six times more common among female homicide decedents than among males (10.5% and 1.6%, respectively). A house or apartment was the most common location of homicide for both males and females (46.5% and 74.0%, respectively). The next most common location of homicide for males was a street or highway (24.2%), a parking lot or public garage (5.2%), and a commercial/retail area (4.1% each); for females, the next most common locations were a street or highway (6.7%), a natural area (3.1%), and a motor vehicle (2.3%) (Table 12).

Toxicology Results of Decedent and Precipitating Circumstances

Tests for alcohol were conducted for 75.8% of homicide decedents, and drug tests for amphetamines, antidepressants, cocaine, marijuana, and opiates were conducted for 59.5%, 41.9%, 60.4%, 36.2%, and 57.8% of homicide decedents, respectively (Table 13). Among tested homicide decedents who tested positive for alcohol (34.2%), 60.9% had a BAC of ≥0.08 g/dL. Marijuana, cocaine, and opiates were identified in 23.4%, 10.1%, and 9.1% of homicide decedents tested, respectively (Table 13).

Precipitating circumstances were identified for 70.6% of homicide deaths. Nearly one in three of those homicides were precipitated by another crime (Table 14). In 73.4% of cases precipitated by another crime, the crime was in progress at the time of the incident (Table 14). The crime was most often robbery (36.7%), followed by assault/homicide (22.0%), burglary (11.0%), drug trade (7.7%), rape/sexual assault (3.9%), or motor-vehicle theft (1.9%) (Table 15). Other common precipitating circumstances were an argument, abuse, or conflict over something other than money or property (36.0%); drug involvement (11.5%); justifiable self-defense/law enforcement (6.7%); or an argument over money or property (6.1%). In 17.6% of cases with known circumstance information, intimate partner violence was identified as a contributing factor (Table 14).

An argument, abuse, or conflict unrelated to money or property was a factor in more homicides among males than among females (40.8% and 22.2% respectively). Drug-involvement homicides accounted for 14.0% of male homicides and 4.4% of female homicides. Intimate partner violence was a precipitating factor in 45.1% of female homicides but only 8.1% of male homicides. In 11.6% of male homicides with known circumstance information, the decedent also used a weapon during the altercation, compared with 1.9% of female homicides (Table 14).

Deaths of Undetermined Intent

Sex, Race/Ethnicity, Age Group, Education, and Marital Status

The 16 NVDRS states included in this report collected data concerning 2,316 incidents involving 2,325 deaths during 2009 for which a determination of intent could not be made. Rates of undetermined death by month were at 0.2 or 0.3 per 100,000 population throughout the year (Table 16). Overall, the crude rate of undetermined deaths was 2.8 per 100,000 population. Rates of undetermined death were higher among males than among females (3.6 and 2.1 per 100,000 population, respectively) (Table 17). Although non-Hispanic whites accounted for 74.1% of undetermined deaths, rates were highest among AI/ANs (6.6 per 100,000 population). More than half (56.1%) of decedents for whom the manner of death was undetermined were aged 35–64 years. Rates were highest (27.3 per 100,000 population) among infants aged <1 year. Among decedents with an undetermined manner of death aged ≥18 years for which marital status was known, 37.1% never had been married, 26.2% were married, and 27.8% were divorced at the time of death. AI/AN females had the highest rates (7.0 per 100,000 population) of undetermined deaths compared with males or females of any other racial/ethnic population (Table 17).

Method and Location of Injury

The most common method of injury was poisoning (60.5%) (Table 18). No other known single method accounted for >3.2% of undetermined deaths. Among both males and females for which the method of injury was known, poisoning was reported for 58.8% and 63.2% of deaths, respectively. The majority of undetermined violent deaths occurred in a house or apartment, making it the most common place of injury for both males and females (76.4% and 82.6%, respectively). A natural area was the second most common setting, accounting for 3.4% of deaths among males and 1.1% among females, followed by a street or highway, accounting for 2.6% of deaths among males and 0.9% among females (Table 18).

Toxicology Results of Decedent and Precipitating Circumstances

Tests for alcohol were conducted for 80.7% of decedents of undetermined intent, and drug tests for amphetamines, antidepressants, cocaine, marijuana, and opiates were conducted for 77.7%, 70.7%, 79.0%, 39.0%, and 80.5% of decedents, respectively (Table 19). Among decedents who tested positive for alcohol (26.0%), 56.3% had a BAC of ≥0.08 g/dL. Among decedents tested for opiates, 58.2% were positive; of those tested for cocaine, 15.7% were positive; of those tested for marijuana, 10.4% were positive; and of those tested for antidepressants, 27.8% were positive (Table 19).

Precipitating circumstances were known for approximately 72% of deaths of undetermined intent. Of those, 29.9% of decedents had a problem with alcohol, and 56.8% had other substance abuse problems (e.g., those involving an illicit drug or prescription abuse) (Table 20). Although a current depressed mood was reported for only 13.8% of decedents, 40.9% of decedents with known circumstance information had a diagnosed current mental health problem, 29.8% were in treatment at the time of their death, 11.8% had a history of suicide attempts, 7.8% had disclosed intent to commit suicide, and 2.1% left a suicide note. Other circumstances noted most often were physical health problems (33.3%), a crisis during the preceding or impending 2 weeks (14.8%), or an intimate partner problem (11.0%) (Table 20). Of those with a current mental health problem, 63.7% had received a diagnosis of depression/dysthymia, 17.4% of bipolar disorder, and 14.8% of an anxiety disorder (Table 21).

A greater percentage of male than female decedents was reported to have an alcohol problem (32.9% and 25.0%, respectively) or other substance abuse problems (57.9% and 54.9%, respectively) at the time of death. Mental health problems were reported in a higher percentage of undetermined deaths of females than of males (53.2% and 33.3%, respectively). Females were more often diagnosed with bipolar and eating disorders than males, whereas males had higher percentages of anxiety disorders, schizophrenia, PTSD, and ADD/ADHD (Table 21). A higher percentage of females were currently in treatment for a mental health problem than males (43.2% and 21.4%, respectively) and had a history of suicide attempts (17.4% and 8.3%, respectively) (Table 20).

Unintentional Firearm Deaths

Sex, Race/Ethnicity, Age Group, and Seasonality

The 16 NVDRS states included in this report collected data concerning 87 unintentional firearm deaths during 2009 (Table 22). Males accounted for 87.4% of decedents. The majority (71.3%) were non-Hispanic whites, followed by non-Hispanic blacks (16.1%). Nearly one third of unintentional firearm deaths occurred among persons aged 15–19 years (14.9%) and 35–44 years (13.8%). Handguns accounted for 48.3% of unintentional firearm deaths, shotguns for 20.7%, and rifles for 17.2%.

Location of Injury

Approximately 65.5% of all unintentional firearm deaths took place in a house or apartment followed by natural areas (19.5%) (Table 22).

Context of Injury and Precipitating Circumstances

Overall, unintentional firearm injury deaths occurred most commonly while victims were playing with a gun (29.9%) or hunting (26.9%). The circumstances of injury included believing the firearm was unloaded (25.4%) and unintentionally pulling the trigger (11.9%) (Table 23).

Special Topics

Violent Deaths with Multiple Decedents

The 16 NVDRS states included in this report collected data concerning 374 incidents that resulted in multiple decedents. Firearms were the most common method (77.4%) used in incidents with multiple decedents, followed by sharp instruments (8.1%), blunt instruments (3.3%), poisoning (3.1%), and hanging/strangulation/suffocation (2.8%) (Table 24). Of a total of 815 victims, 486 (59.6%) were males; 348 (89.5%) of 389 suspects also were males. Non-Hispanic whites accounted for the highest percentage of decedents (56.1%), followed by non-Hispanic blacks (28.2%) and Hispanics (9.0%). Rates for victims were highest for AI/ANs and persons aged 20–34 years. Suspects most commonly were aged 35–44 years (Table 25).

Homicide Followed by Suicide

The 16 NVDRS states included in this report collected data concerning 198 violent incidents that occurred during 2009 in which a homicide was followed by the suicide of the suspect. Of 229 homicide decedents, 166 (72.5%) were female, and 187 (94.0%) suspects (suicide decedents) were male. More than 60% of both homicide and suicide decedents were non-Hispanic whites. The highest percentages of homicide decedents were aged 35–44 years (20.1%), whereas suicide decedents were most commonly aged 45–54 years (23.6%) (Table 26).

With respect to location, 82.5% of the homicides occurred in a house or apartment and 3.5% in a natural area. Firearms were the most common method used by suspects both in committing the homicide (87.8%) and in subsequently killing themselves (89.9%) (Table 27).

Tests for alcohol were conducted for 73.4% of homicide decedents and 68.8% of suicide decedents. Among decedents who tested positive for alcohol (20.2% of homicide victims and 32.1% of suicide decedents), 35.3% of homicide decedents and 72.7% of suicide decedents had a BAC of ≥0.08 g/dL at the time of death. Suspects who killed themselves following a homicide and who were tested subsequently for drugs had slightly higher percentages of positive tests for cocaine and marijuana than homicide victims (Table 28).

Overall, 10.4% of persons who killed themselves following a homicide had a current depressed mood, and 9.3% were receiving mental health treatment at the time of the fatal incident. Intimate partner relationship problems preceded homicide followed by suicide in 70.5% of suspect suicides. Other nonintimate partner relationship problems contributed to 12.6% of suspect suicides. Of suspects who killed themselves, 73.2% had had a personal crisis within the preceding or impending 2 weeks. Recent criminal legal problems were noted in 21.9% of suspect suicides and noncriminal problems in 2.7%; financial and job problems were contributing circumstances in 10.4% and 4.4% of suspect suicides respectively; 12.0% of suicide decedents had disclosed their intent to kill themselves; and 2.7% had a history of suicide attempts (Table 29).

Intimate Partner–Related Homicide

The 16 NVDRS states included in this report collected data concerning 567 incidents comprising 671 deaths resulting from intimate partner–related homicide that occurred during 2009. Of 671 homicide victims, 353 (52.6%) were female (Table 30). Although 58.4% of homicide victims were non-Hispanic whites, rates were higher for AI/ANs and non-Hispanic blacks (2.5 and 1.5 per 100,000 population respectively). Of 511 suspects, 410 (80.2%) were male; 222 (43.4%) were non-Hispanic whites and 141 (27.6%) were non-Hispanic blacks. The highest percentages of victims and suspects (25.2% and 17.6%, respectively) were persons aged 35–44 years. The highest percentage (41.4%) of victims were married at the time of death (Table 30). Tests for alcohol were conducted for 80.0% of victims. Of the 34.3% of decedents who tested positive for alcohol, 75.0% had a BAC of ≥0.08 g/dL. The percentage of victims tested for substances other than alcohol differed (range: 38.0%–58.1%) for various drugs; marijuana and antidepressants were evident in approximately 14.5% and 11.9% of victims tested for these substances respectively (Table 31).

Suicides Among Former or Current Military Personnel

The 16 NVDRS states included in this report collected data concerning 1,876 suicides by former or current military personnel that occurred during 2009. Of these decedents, 1,806 (96.3%) were male, and 1,695 (90.4%) were non-Hispanic whites. The greatest percentage of decedents were persons aged >35 years. The most common method (69.2%) used was a firearm, followed by hanging/strangulation/suffocation (14.3%) and poisoning (11.6%) (Table 32). Among the 63.6% former or current military personnel suicide decedents who were tested for alcohol, 29.9% tested positive; 65.0% of these decedents had a BAC of ≥0.08 g/dL (Table 33). Of those tested for antidepressants and opiates, 19.6% and 15.9% respectively, were positive. Although 41.5% were reported to be depressed at the time of death, and 39.6% had a diagnosed mental health problem, only 26.0% were receiving mental health treatment (Table 34). With respect to substance abuse, 15.9% had an alcohol problem, and 7.5% had a problem with other substances. Among those with known circumstance information, 27.3% had experienced a problem with an intimate partner, 35.6% had a physical health problem, and 26.9% had experienced an acute crisis during the preceding or impending 2 weeks. With respect to life stressors, 12.5% had experienced a financial problem, 13.8% a job problem, and 8.6% a recent criminal legal problem. Approximately one third (35.4%) left a suicide note, 13.4% had made a previous suicide attempt, and 29.5% had disclosed an intent to commit suicide (Table 34).

Legal Intervention

The 16 NVDRS states included in this report collected data on 127 legal-intervention incidents in 2009 resulting in 125 single-victim deaths, and five deaths in which the legal-intervention victim had recently committed a homicide. Of the 130 legal-intervention decedents, 56.9% were non-Hispanic whites and 29.2% were non-Hispanic blacks. With respect to location, 44.6% of legal-intervention deaths occurred in a house or apartment, 29.2% on a street or highway, and 7.7% in a motor vehicle (Table 35). The majority of decedents were aged 30–54 years (Table 36). Of the 92.3% of decedents from legal-intervention deaths who were tested for alcohol, 40.1% were positive for alcohol, and 79.6% of these decedents had a BAC of ≥0.08 g/dL (Table 37). The percentage of victims tested for other substances varied (range: 47.7%–80.0%). The presence of other drugs for which tests were positive also varied: 17.7% of those tested for marijuana, 15.5% of those tested for antidepressants, 10.8% of those tested for opiates, 10.6% of decedents tested for cocaine, and 4.0% of those tested for amphetamines were positive for these substances (Table 37).

Suicides Among Persons Aged ≥60 Years

In 2009, NVDRS collected data for 2,034 persons aged ≥60 years who died by suicide. Of those, rates of suicide were nearly identical among those aged 60–69 years, 70–79 years, and ≥80 years old (14.1–14.2 per 100,000 population). Male rates increased with age from 23.3 per 100,000 population for those aged 60–69 years, 26.8 for those aged 70–79 years, and 35.6 for those aged ≥80 years (Table 38). The opposite pattern occurred among females; for the same age groups, female rates decreased from 5.8 to 4.2 and 2.7, respectively. Among persons aged ≥60 years, rates were approximately 5.5 times higher among males than among females (26.2 and 4.6 per 100,000 population, respectively). Rates were highest among non-Hispanic whites (16.1 per 100,000 population), followed by A/PIs (8.4), Hispanics (5.8), and non-Hispanic blacks (4.2). At the time of death, persons aged 60–69 years most often were either married or divorced. Those aged 70–79 years and ≥80 years most often were either married or widowed (Table 38).

The majority (84.5%) of suicide decedents aged ≥60 years died in a house or apartment followed by natural areas (2.8%) or a street or highway (1.7%). Among suicide decedents aged ≥60 years, firearms accounted for 70.3% of deaths (9.9 per 100,000 population), poisoning for 14.5% (2.0 per 100,000 population), and hanging/strangulation/suffocation for 10.6% (1.5 per 100,000 population) (Table 38).

Precipitating circumstances were identified for approximately 87.0% of older adult suicides. Current depressed mood (37.4%), current mental health problem (35.2%), and physical health problems (46.2%) were the most commonly identified circumstances; 30.7% left a suicide note, and 23.4% disclosed their intent to commit suicide (Table 39).

Discussion

Violent deaths occur among men and women and among persons of all ages, races, and ethnicities. NVDRS can help identify populations particularly affected by violence. Furthermore, the system not only provides details on specific manners of violent deaths but also identifies common factors that span multiple domains of violence. These details can increase understanding about the nature of various forms of violence and help direct violence prevention efforts so they are more effective.

NVDRS continues to show that relationship problems, particularly with an intimate partner, are common circumstances preceding suicides, homicides, and homicide-suicides (i.e., suicide after homicide). These findings support the potential value of programs that help improve communication skills, social problem-solving, conflict resolution, and individual coping skills. The Safe Dates Program, a school-based program aimed at reducing dating violence among adolescents has shown promise with reducing long-term physical and sexual dating violence (7). Furthermore, primary prevention strategies designed to teach skills that reduce aggressive behavior toward others and improve social skills, emotional well-being and self-esteem can be targeted toward preadolescents and early adolescents before violent behaviors and patterns begin (8,9). Many universal school-based prevention programs have been found to reduce youth violence (9). These programs focus on promoting positive development of children and adolescents with a goal of creating long-term reductions in violence.

Use of alcohol and other substances often precedes both self-directed and interpersonal violent behavior (4,10–13). Intoxication can increase impulsivity (14), which has been linked to suicidal behavior (15) and aggression (16). Intoxication can also reduce physical control and awareness of surrounding risks making individuals more vulnerable to victimization (17). Even though information on alcohol and drug use in NVDRS was limited to victims and homicide-suicide perpetrators, the data still provide some evidence that violence prevention efforts might benefit from strategies intended to prevent and reduce alcohol and other substance abuse.

Most of the undetermined deaths in 2009 resulted from use of multiple substances. Although opioids, either heroin or prescription opioid analgesics, were the most common substances detected by toxicology tests, alcohol was also involved in many of these deaths, which complicates understanding of the intentions of the decedent. In addition, antidepressants were present at the time of death for many decedents, suggesting they had accessed mental health treatment and were prescribed these medications. More research is needed to assess the role prescription medications play in undetermined poisoning deaths. These findings also suggest that efforts are needed to help identify those with co-occurring substance abuse problems so that precautions can be taken by providers when prescribing opioid analgesics and antidepressants.

Mental health problems were the most common circumstances among suicide decedents. Depression was the most common diagnosis among those who were considered to have a current mental health problem. Although efforts are still needed to overcome barriers to seeking mental health services (e.g., financial barriers, lack of available services, and fear of social stigma), the findings in this report show that many suicide victims recently received mental health treatment, suggesting that additional strategies are needed to prevent suicide. Providers need to closely monitor and continually assess the risk for suicide among persons who are receiving mental health services, especially if they have other acute stressors and are using alcohol or other substances. In addition, this report showed that a large proportion of suicide decedents had disclosed their suicide intentions to others, and many had made previous suicide attempts. Both findings support the importance of treatment and monitoring for those who attempt suicide, as well as education for the general public on how to respond and seek help for persons expressing suicidal intentions (4,1012,18).

Financial distress was also a common factor preceding death both from suicide and homicide. In addition, many homicides were precipitated by robberies and burglaries, criminal activities that have been found to be more common among those who are receiving low wages or are unemployed (19). Job training, counseling, and placement services for those facing difficult financial times might help reduce maladaptive responses to this type of strain (1012,20–22).

In addition to demonstrating the importance of addressing individual stressors, a focus on broader factors, such as those stressors occurring at the community or society level, are needed. For example, escalating interpersonal and intimate partner problems often preceded the violent death. These findings underscore the importance of addressing contextual factors that condone or support the use of violence as a means of resolving conflict. For example, social and economic conditions within communities can create inequities in the distribution of and access to resources and opportunities, which can create community conflict and violence. Strategies that provide residents in distressed communities with better access to services that help reduce the stressors that exacerbate violence can be explored for effectiveness. Strategies that help communities plan, implement, and monitor prevention activities that are based on the best available evidence can facilitate prevention. For example, the CDC initiative Striving to Reduce Youth Violence Everywhere provides communities with information, training, and tools to help them identify effective strategies and put them into practice before violence occurs. (Additional information is available at http://www.vetoviolence.org/stryve.)

Limitations

The findings in this report are subject to several limitations. First, NVDRS data are available only from a limited number of states and therefore are not nationally representative. Second, the availability, completeness, and timeliness of data depend on partnerships among state health department NVDRS teams, CMEs, and law enforcement personnel. Data sharing and communication among partners is particularly challenging when states have independent county coroner systems rather than a centralized CME system, a large number of law enforcement jurisdictions, or both. NVDRS incident data might be limited or incomplete for areas in which these data-sharing relations are not developed fully. Third, toxicology data are not collected consistently across all states or for all alcohol and drug categories. The percentage of decedents testing positive might be affected by selective testing biases in medical examiner or coroner offices (23). Fourth, abstractors are limited to the data included in the reports they receive. Reports might not fully reflect all information known about an incident, particularly in the case of homicides, when data are less readily available until after prosecutions are complete. Fifth, case definitions present challenges when a single death is classified differently in different documents (e.g., "unintentional" in a police report, "homicide" in a CME report, and "undetermined" on the death certificate). NVDRS abstractors reconcile these cases using standardized NVDRS case definitions and select a single manner of death on the basis of all source documents. Sixth, although extensive coding training is conducted and help desk support is available daily, coding might vary depending on the abstractor's level of experience. For this reason, states regularly conduct blinded reabstraction of cases to test consistency and identify training needs. Seventh, the medical and mental health information (e.g., type of conditions, whether the victim was currently receiving treatment) are not often captured directly from medical records but from CME reports, family members, and friends of the victims. Therefore, the completeness of this information is limited by the knowledge of the informant. Finally, protective factor data (i.e., characteristics or circumstances that reduce the risk for violent death) are not collected by NVDRS because of the nature of death certificates, CME records, and law enforcement reports, which typically contain only circumstances associated with risk factors.

Conclusion

Accurate, timely, and comprehensive surveillance data can be used to monitor the occurrence of violence-related fatal injuries and assist public health and other authorities in the development, implementation, and evaluation of programs and policies that reduce and prevent violent deaths and injuries at the national, state, and local levels (24,25). Continued development and expansion of NVDRS is critical to the public health and criminal justice communities at the federal, state, and local levels that work to reduce the personal, familial, and societal costs of violence. Additional efforts are needed to increase the number of states participating in NVDRS, with the ultimate goal of full national representation, including all 50 states, the District of Columbia, and U.S. territories.

Acknowledgments

Contributors to this report included participating state Violent Death Reporting Systems; participating state agencies, including state health departments, vital registrars' offices, coroners' and medical examiners' offices, crime laboratories, and local and state law enforcement agencies; partner organizations, including the Safe States Alliance (formerly STIPDA), National Violence Prevention Network, National Association of Medical Examiners, National Association for Public Health Statistics and Information Systems, Council of State and Territorial Epidemiologists, and Association of State and Territorial Health Officials; federal agencies, including the Department of Justice (Bureau of Justice Statistics and the Federal Bureau of Investigation), the Department of the Treasury (Bureau of Alcohol, Tobacco, and Firearms); the International Association of Chiefs of Police; other stakeholders, researchers, and foundations, including Harvard University School of Public Health and the Joyce Foundation; and the National Institute for Occupational Safety and Health and the National Center for Health Statistics, CDC.

References

  1. CDC. Web-based Injury Statistics Query and Reporting System (WISQARS). Atlanta, GA: US Department of Health and Human Services, CDC; 2008. Available at http://www.cdc.gov/ncipc/wisqars/default.htm. Accessed June 22, 2012.
  2. Doll L, Bonzo S, Mercy J, Sleet D, Hass E, eds. Handbook of injury and violence. New York, NY: Springer; 2007.
  3. Paulozzi LJ, Mercy J, Frazier L, Annest JL. CDC's National Violent Death Reporting System: background and methodology. Inj Prev 2004;10:47–52.
  4. CDC. Surveillance for violent deaths—National Violent Death Reporting System, 16 states, 2005. MMWR 2008;57(No. SS-3).
  5. World Health Organization. International classification of diseases, 10th revision. Geneva, Switzerland: World Health Organization; 2007. Available at http://www.who.int/classifications/icd/en/index.html. Accessed June 22, 2012.
  6. CDC. U.S. census populations with bridged race categories. Hyattsville, MD: US Department of Health and Human Services, CDC; 2007. Available at http://www.cdc.gov/nchs/nvss/bridged_race.htm. Accessed June 22, 2012.
  7. Foshee VA, Bauman KE, Ennett ST, Linder GF, Benefield T, Suchindran C. Assessing the long-term effects of the Safe Dates program and a booster in preventing and reducing adolescent dating violence victimization and perpetration. Am J Public Health 2004;94:619–24.
  8. Center for the Study and Prevention of Violence, Institute of Behavioral Science. Blueprints for violence prevention. Boulder, CO: Center for the Study and Prevention of Violence, Institute of Behavioral Science; 2012. Available at http://www.colorado.edu/cspv/blueprints/modelprograms.html. Accessed June 22, 2012.
  9. CDC. The effectiveness of universal school-based programs for the prevention of violent and aggressive behavior: a report on recommendations of the Task Force on Community Preventive Services. MMWR 2007;56(No. RR-7).
  10. CDC. Surveillance for violent deaths—National Violent Death Reporting System, 16 states, 2008. MMWR 2011;60(No. SS-10).
  11. CDC. Surveillance for violent deaths—National Violent Death Reporting System, 16 states, 2007. MMWR 2010;59(No. SS-4).
  12. CDC. Surveillance for violent deaths—National Violent Death Reporting System, 16 states, 2006. MMWR 2009;58(No. SS-1).
  13. Darke S, Duflou J, Torok M. Drugs and violent death: comparative toxicology of homicide and non-substance toxicity suicide victims. Addiction 2009;104:1000–5.
  14. Murphy C, Mackillop J. Living in the here and now: interrelationships between impulsivity, mindfulness, and alcohol misuse. Psychopharmacology (Berl). 2012;219:527–36.
  15. Mann JJ, Waternaux C, Haas GL, Malone KM. Toward a clinical model of suicidal behavior in psychiatric patients. Am J Psychiatry 1999;156:181–9.
  16. Derefinko K, DeWall CN, Metze AV, Walsh EC, Lynam DR. Do different facets of impulsivity predict different types of aggression? Aggress Behav 2011;37:223–33.
  17. Parker RN. Alcohol and violence: connections, evidence and possibilities for prevention. J Psychoactive Drugs 2004;Suppl 2:157–63.
  18. Mayo Clinic. Suicide: what to do when someone is suicidal. Rochester, MN: Mayo Clinic; 2010. Available at http://www.mayoclinic.com/health/suicide/MH00058. Accessed June 22, 2012.
  19. Gould ED, Weinberg BA, Mustard DB. Crime rates and local labor market opportunities in the United States: 1979–1997. Rev Econ Stats 2002;84:45–61
  20. CDC. Homicides and suicides—National Violent Death Reporting System, United States, 2003–2004. MMWR 2006;55:721–4.
  21. Logan J, Hill HA, Black ML, et al. Characteristics of perpetrators in homicide-followed-by-suicide incidents: National Violent Death Reporting System—17 U.S. states, 2003–2005. Am J Epidemiol 2008;168:1056–64.
  22. Bossarte RM, Simon TR, Barker L. Characteristics of homicide followed by suicide incidents in multiple states, 2003–04. Inj Prev 2006;12(Suppl 2):ii33–ii38.
  23. CDC. Toxicology testing and results for suicide victims–13 states, 2004. MMWR 2006;55:1245–8.
  24. Karch D, Logan J. Data consistency in multiple source documents: Findings from homicide incidents in the National Violent Death Reporting System, 2003–2004. Homicide Studies 2008;12:264–76.
  25. Logan J, Karch D, Crosby A. Reducing unknown data in violent death surveillance: A study of death certificates, coroner/medical examiner and police reports from the National Violent Death Reporting System, 2003–2005. Homicide Studies 2009;13:385–97.

FIGURE. States participating in the National Violent Death Reporting System, by year of initial data collection — United States, 2003–2010

This figure is a U.S. map highlighting the 16 states that participate in the National Violent Death Reporting System (NVDRS) and the year each began collecting data. NVDRS began data collection in 2003 with seven states (Alaska, Maryland, Massachusetts, New Jersey, Oregon, South Carolina, and Virginia) participating; six states (Colorado, Georgia, North Carolina, Oklahoma, Rhode Island, and Wisconsin) joined in 2004, four more (California, Kentucky, New Mexico, and Utah) in 2005; and two (Ohio and Michigan) in 2010 for a total of 19 states. California is not shown because data were not collected after 2009. Data from Ohio and Michigan were excluded from this report because data collection did not begin until 2010.

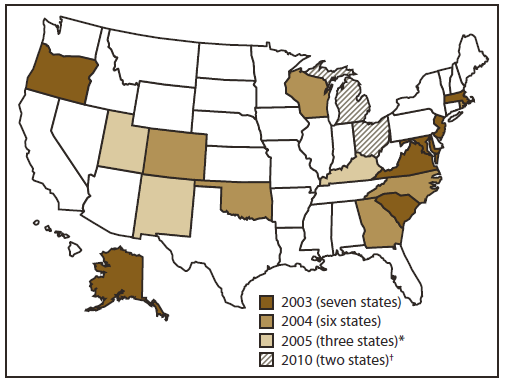
* California collected data in four counties during 2005–2009.

Ohio and Michigan are excluded from the analysis in this report because data collection did not begin until 2010.

Alternate Text: This figure is a U.S. map highlighting the 16 states that participate in the National Violent Death Reporting System (NVDRS) and the year each began collecting data. NVDRS began data collection in 2003 with seven states (Alaska, Maryland, Massachusetts, New Jersey, Oregon, South Carolina, and Virginia) participating; six states (Colorado, Georgia, North Carolina, Oklahoma, Rhode Island, and Wisconsin) joined in 2004, four more (California, Kentucky, New Mexico, and Utah) in 2005; and two (Ohio and Michigan) in 2010 for a total of 19 states. California is not shown because data were not collected after 2009. Data from Ohio and Michigan were excluded from this report because data collection did not begin until 2010.


BOX 1. International Classification of Diseases, Tenth Revision (ICD-10) codes used in the National Violent Death Reporting System

Manner of death

Death ≤1 year after injury

Death >1 year after injury

Intentional self-harm (suicide)

X60–X84

Y87.0

Assault (homicide)

X85–X99, Y00–Y09

Y87.1

Event of undetermined intent

Y10–Y34

Y87.2, Y89.9

Unintentional exposure to inanimate mechanical forces (firearms)

W32–W34

Y86 determined to be attributable to firearms

Legal intervention (excluding executions, Y35.5)

Y35.0–Y35.4, Y35.6–Y35.7

Y89.0

Terrorism

U01, U03

U02


BOX 2. Methods of injury — National Violent Death Reporting System, 16 states, 2009

  • Firearm: method that uses a powder charge to fire a projectile
  • Sharp instrument: knife, razor, machete, or pointed instrument (e.g., chisel or broken glass)
  • Blunt instrument: club, bat, rock, or brick
  • Poisoning: street drug, alcohol, pharmaceutical, carbon monoxide, gas, rat poison, or insecticide
  • Hanging/strangulation/suffocation: hanging by the neck, manual strangulation, or plastic bag over the head
  • Personal weapons: hands, fists, or feet
  • Fall: being pushed or jumping
  • Drowning: inhalation of liquid in bathtub, lake, or other source of water/liquid
  • Fire/burn: inhalation of smoke or the direct effects of fire or chemical burns
  • Shaking: shaking a baby, child, or adult
  • Motor vehicle: car, bus, or motorcycle
  • Other transport vehicle: train or airplane
  • Intentional neglect: starvation, lack of adequate supervision, or withholding of health care
  • Other: any method other than those listed above
  • Unknown: method not reported or not known

BOX 3. Circumstances preceding fatal injury, by manner of death — National Violent Death Reporting System, 16 states, 2009

Suicide/Undetermined Intent

  • Current depressed mood: decedent was perceived by self or others to be depressed.
  • Current mental health problem: decedent has been identified as having a mental health disorder or syndrome listed in the Diagnostic and Statistical Manual, Version IV (DSM-IV).
  • First/second type of mental illness diagnosis: identifies the DSM-IV diagnosis made by a medical or mental health practitioner.
  • Current treatment for mental illness: decedent was currently receiving mental health treatment as evidenced by a current psychotropic medication or visit to a mental health professional in the previous 2 months.
  • Alcohol/other substance problem: decedent was perceived by self or others to have a problem with, or to be addicted to, alcohol or other drugs.
  • Person left a suicide note: decedent left a note, e-mail message, video, or other communication indicating an intent to die by suicide.
  • Disclosed intent to die by suicide: decedent had previously expressed suicidal feelings to another person with time for that person to intervene; disclosure only at the time of the event, with no opportunity to intervene, is not coded as "disclosed intent to commit suicide."
  • History of suicide attempts: decedent was known to have made previous attempts, regardless of the severity of those attempts.
  • Crisis during previous 2 weeks: a very current crisis or acute precipitating event appears to have contributed to the suicide. This is designed to measure impulsivity. The crisis event must have occurred in the previous 2 weeks or be impending in the following 2 weeks (e.g., a trial for a criminal offense begins the following week).
  • Physical health problem: decedent was experiencing physical health problems that are believed to have contributed to the suicide (e.g., a recent cancer diagnosis or chronic pain).
  • Intimate partner problem: problems with a current or former intimate partner that appear to have contributed to the suicide.
  • Other relationship problem: problems with a family member, friend, or associate (other than an intimate partner) that appear to have contributed to the suicide.
  • Job problem: decedent was either experiencing a problem at work or was having a problem with joblessness.
  • School problem: decedent was experiencing a problem such as poor grades, bullying, social exclusion at school, or performance pressures.
  • Financial problem: decedent was experiencing problems such as bankruptcy, overwhelming debt, or foreclosure of a home or business.
  • Suicide of friend or family in previous 5 years: decedent was distraught over, or reacting to, a relatively recent suicide of a friend or family member.
  • Other death of friend or family in previous 5 years: decedent was distraught over, or reacting to, a relatively recent nonsuicide death of a friend or family member.
  • Recent criminal legal problem: decedent was facing criminal legal problems that appear to be associated with the suicide.
  • Other legal problem: decedent was facing civil legal problems (e.g., a child custody or civil lawsuit).
  • Perpetrator of interpersonal violence in previous month: decedent perpetrated interpersonal violence (e.g., being sought by police for assault or having been issued a restraining order resulting from recent violence) during the previous month.
  • Victim of interpersonal violence in previous month: decedent was the target of interpersonal violence in the past month.

Homicide/Legal Intervention

  • Precipitated by another crime: incident occurred as the result of another serious crime.
  • Nature of crime: identifies the actual crime (e.g., robbery or drug trafficking).
  • Crime in progress: crime was in progress at the time of the death.
  • Argument over money/property: conflict between decedent and suspect was over money or property (including drugs).
  • Other argument, abuse, conflict: conflict between decedent and suspect was over something other than money, property, or drugs.
  • Jealousy ("lovers' triangle"): jealousy or distress over an intimate partner's relationship or suspected relationship with another person led to the homicide.
  • Intimate-partner violence–related: homicide is related to conflict between current or former intimate partners; includes the death of actual intimate partners and nonintimate partner decedents killed to cause pain to an intimate partner (e.g., child or parent).

BOX 3. (Continued) Circumstances preceding fatal injury, by manner of death — National Violent Death Reporting System, 16 states, 2009

  • Drug involvement: drug dealing or illegal drug use is suspected to have played a role in precipitating the homicide.
  • Gang-related: homicide is suspected to have resulted from gang activity or gang rivalry; not used if the decedent was a gang member but the homicide did not appear to result from gang activity.
  • Hate crime: decedent was intentionally selected because of his/her actual or perceived gender, religion, sexual orientation, race/ethnicity, or disability.
  • Brawl: mutual physical fight involving three or more persons.
  • Decedent was a bystander: decedent was not directly involved in the incident.
  • Decedent was a police officer on duty: a law enforcement officer killed in the line of duty.
  • Decedent was an intervener assisting a crime victim: decedent was attempting to assist a crime victim at the time of the incident (e.g., a child attempts to intervene and is killed while trying to assist a parent who is being assaulted).
  • Mercy killing: the decedent wished to die because of terminal or hopeless disease or condition, and documentation indicates that the decedent wanted to be killed.

Unintentional Firearm Death

  • Hunting: death occurred anytime after leaving home for a hunting trip and before returning home from a hunting trip; the shooting need not have been during an active hunt to be coded.
  • Target shooting: a shooter was aiming for a target and unintentionally hit a person; can be at a shooting range or an informal backyard setting.
  • Self-defensive shooting: self-inflicted shooting in which the decedent was attempting to use a gun in self-defense.
  • Celebratory firing: shooter fired the gun upward in a celebratory manner with no intention of threatening or endangering others.
  • Loading/unloading gun: firearm discharged when the shooter was loading/unloading ammunition.
  • Cleaning gun: firearm discharged when the shooter was cleaning the gun.
  • Showing gun to others: showing the gun to another person when the gun discharged or the trigger was pulled.
  • Playing with gun: the shooter and one or more others were playing with a gun.
  • Thought safety was engaged: shooter thought the gun was inoperable because the safety was engaged.
  • Thought unloaded/magazine disengaged: shooter thought the gun was unloaded because the magazine was disengaged.
  • Thought gun was unloaded/other: shooter thought the gun was unloaded for other unspecified reason.
  • Unintentionally pulled trigger: shooter unintentionally pulled the trigger (e.g., while grabbing the gun or holding it too tightly).
  • Bullet ricochet: bullet ricocheted from its intended target and unintentionally struck the decedent.
  • Gun defect or malfunction: gun had a defect or malfunctioned as determined by a trained firearm examiner.
  • Fired while holstering/unholstering: gun was being replaced or removed from holster/clothing.
  • Dropped gun: gun discharged when it was dropped or when something was dropped on it.
  • Fired while operating safety/lock: shooter unintentionally fired the gun while operating the safety lock.
  • Gun mistaken for toy: gun was mistaken for a toy and was fired without the user understanding the danger.

TABLE 1. Number,* percentage, and rate§ of incidents, by incident type, manner of death, method used, and location in which injury occurred — National Violent Death Reporting System, 16 states, 2009

Characteristic

No.

(%)

Rate

Incident type

Suicide, single

9,721

(60.8)

—**

Homicide, single

3,371

(21.1)

—**

Unintentional firearm

87

(0.5)

—**

Suicide, multiple

14

(0.1)

—**

Homicide, multiple

141

(0.9)

—**

Legal intervention

120

(0.8)

—**

Homicide followed by suicide

198

(1.2)

—**

Undetermined

2,316

(14.5)

—**

Other combinations of deaths

11

(0.1)

—**

Unknown

2

(0.0)

—**

Total

15,981

(100.0)

—**

Manner of death

Homicide/Legal Intervention

4,057

(24.7)

5.0

Suicide

9,949

(60.6)

12.2

Undetermined intent

2,325

(14.2)

2.8

Unintentional firearm

87

(0.5)

0.1

Total

16,418

(100.0)

20.1

Method

Firearm

8,014

(48.8)

9.8

Sharp instrument

709

(4.3)

0.9

Blunt instrument

342

(2.1)

0.4

Poisoning

3,136

(19.1)

3.8

Hanging/Strangulation/Suffocation

2,644

(16.1)

3.2

Personal weapons (hands, feet, or fists)

149

(0.9)

0.2

Fall

188

(1.1)

0.2

Drowning

158

(1.0)

0.2

Fire/Burns

89

(0.5)

0.1

Shaking

37

(0.2)

0.0

Motor vehicles (e.g., buses, motorcycles, and other transport vehicles)

169

(1.0)

0.2

Intentional neglect

12

(0.1)

††

Other (single method)

98

(0.6)

0.1

Unknown

677

(4.1)

0.8

Total

16,422

(100.0)

20.1

Location

House

11,643

(70.9)

14.2

Street/Highway

1,208

(7.4)

1.5

Motor vehicle

446

(2.7)

0.5

Bar/Nightclub

81

(0.5)

0.1

Commercial/Retail Area

214

(1.3)

0.3

Industrial or construction area

64

(0.4)

0.1

Office building

46

(0.3)

0.1

Parking lot/Public garage

336

(2.0)

0.4

Abandoned house, building, or warehouse

36

(0.2)

0.0

Park, playground, or sports/athletic area

248

(1.5)

0.3

Preschool/School/College/School bus

17

(0.1)

††

Public transportation/Station/Railroad tracks

48

(0.3)

0.1

Hospital or medical facility

104

(0.6)

0.1

Supervised residential facility

55

(0.3)

0.1

Jail/Prison

206

(1.3)

0.3

Farm

49

(0.3)

0.1

Natural area

572

(3.5)

0.7

Hotel/Motel

271

(1.7)

0.3

Other

366

(2.2)

0.4

Unknown

412

(2.5)

0.5

Total

16,422

(100.0)

20.1

* No. of victims = 16,422 (81.5%); no. of suspects/victims = 212 (1.1%); no. of live suspects = 3,705 (18.4%); no. of persons with unknown role = 19 (0.1%); no. of incidents = 15,981.

Percentages might not total 100% because of rounding.

§ Per 100,000 population.

Alaska, Colorado, Georgia, Kentucky, Maryland, Massachusetts, North Carolina, New Jersey, New Mexico, Oklahoma, Oregon, Rhode Island, South Carolina, Utah, Virginia, and Wisconsin.

** Because the number of victims varies in incidents involving multiple deaths, population denominators cannot be determined to compute rates.

†† Rates not reported when number of decedents is <20.


TABLE 2. Number* and percentage of victims who were tested for alcohol and drugs whose results were positive, by toxicology variable — National Violent Death Reporting System, 16 states, 2009

Toxicology variable

Tested

Positive

No.

(%)

No.

(%)

BAC§

11,880

(72.3)

3,841

(32.3)

<0.08 g/dL§

— 

— 

1,278

(33.3)

≥0.08 g/dL§

2,398

(62.4)

Alcohol-positive, level unknown

165

(4.3)

Amphetamines

8,959

(54.6)

334

(3.7)

Antidepressants

7,469

(45.5)

1,483

(19.9)

Cocaine

9,102

(55.4)

786

(8.6)

Marijuana

6,061

(36.9)

784

(12.9)

Opiates

9,039

(55.0)

2,298

(25.4)

Other drug(s)

8,588

(52.3)

3,498

(40.7)

Abbreviation: BAC = blood alcohol concentration.

* N = 16,422

Alaska, Colorado, Georgia, Kentucky, Maryland, Massachusetts, North Carolina, New Jersey, New Mexico, Oklahoma, Oregon, Rhode Island, South Carolina, Utah, Virginia, and Wisconsin.

§ BAC of ≥0.08 g/dL used as the standard for intoxication. Other substances indicated whether any results were positive; levels for these substances are not measured.


TABLE 3. Number,* percentage, and rate§ of suicides, by method used and month in which suicide occurred — National Violent Death Reporting System, 16 states, 2009

Characteristic

No.

(%)

Rate

Method

Firearm

5,154

(51.8)

6.3

Sharp instrument

176

(1.8)

0.2

Blunt instrument

4

(0.0)

—**

Poisoning

1,709

(17.2)

2.1

Hanging/Strangulation/Suffocation

2,462

(24.7)

3.0

Fall

146

(1.5)

0.2

Drowning

93

(0.9)

0.1

Fire/Burns

40

(0.4)

0.0

Motor vehicles (e.g., buses, motorcycles, and other transport vehicles)

119

(1.2)

0.2

Other (single method)

14

(0.1)

—**

Unknown

32

(0.3)

0.0

Total

9,949

(100.0)

12.2

Month

January

794

(8.0)

1.0

February

727

(7.3)

0.9

March

864

(8.7)

1.1

April

815

(8.2)

1.0

May

869

(8.7)

1.1

June

870

(8.7)

1.1

July

895

(9.0)

1.1

August

861

(8.7)

1.1

September

881

(8.9)

1.1

October

841

(8.5)

1.0

November

779

(7.8)

1.0

December

741

(7.4)

0.9

Unknown

12

(0.1)

—**

Total

9,949

(100.0)

12.2

* No. of incidents = 9,935; no. of decedents = 9,949.

Percentages might not total 100% because of rounding.

§ Per 100,000 population.

Alaska, Colorado, Georgia, Kentucky, Maryland, Massachusetts, North Carolina, New Jersey, New Mexico, Oklahoma, Oregon, Rhode Island, South Carolina, Utah, Virginia, and Wisconsin.

** Rates not reported when number of decedents is <20.


TABLE 4. Number, percentage,* and rate of suicides, by decedent's sex, age group, race/ethnicity, and marital status — National Violent Death Reporting System, 16 states,§ 2009

Characteristic

Male

Female

Total

No.

(%)

Rate

No.

(%)

Rate

No.

(%)

Rate

Age group (yrs)

10–14

41

(0.5)

1.5

22

(1.0)

0.9

63

(0.6)

1.2

15–19

360

(4.6)

12.3

96

(4.5)

3.5

456

(4.6)

8.0

20–24

616

(7.9)

20.6

115

(5.4)

4.1

731

(7.3)

12.6

25–29

638

(8.2)

21.8

137

(6.5)

4.9

775

(7.8)

13.5

30–34

606

(7.7)

22.7

142

(6.7)

5.4

748

(7.5)

14.1

35–44

1,447

(18.5)

25.7

450

(21.2)

8.0

1,897

(19.1)

16.9

45–54

1,740

(22.2)

29.6

558

(26.3)

9.1

2,298

(23.1)

19.2

55–64

1,191

(15.2)

26.5

367

(17.3)

7.6

1,558

(15.7)

16.6

65–74

612

(7.8)

24.3

146

(6.9)

5.0

758

(7.6)

13.9

75–84

405

(5.2)

29.8

61

(2.9)

3.1

466

(4.7)

14.0

≥85

170

(2.2)

40.9

25

(1.2)

2.6

195

(2.0)

14.3

Unknown

1

(0.0)

3

(0.1)

4

(0.0)

Total

7,827

(100.0)

19.5

2,122

(100.0)

5.1

9,949

(100.0)

12.2

Race/Ethnicity 

White, non-Hispanic

6,706

(85.7)

24.1

1,846

(87.0)

6.4

8,552

(86.0)

15.1

Black, non-Hispanic

548

(7.0)

9.1

112

(5.3)

1.7

660

(6.6)

5.2

Asian/Pacific Islander

112

(1.4)

7.4

53

(2.5)

3.3

165

(1.7)

5.3

American Indian/Alaska Native

115

(1.5)

22.6

39

(1.8)

7.4

154

(1.5)

14.9

Hispanic**

319

(4.1)

7.2

71

(3.3)

1.8

390

(3.9)

4.7

Other††

26

(0.3)

0.1

1

(0.0)

27

(0.3)

0.0

Unknown††

1

(0.0)

0

(0.0)

1

(0.0)

Total

7,827

(100.0)

18.6

2,122

(100.0)

5.1

9,949

(100.0)

12.2

Marital status§§ 

Married

2,947

(38.7)

¶¶

744

(36.5)

¶¶

3,691

(38.3)

¶¶

Never married

2,329

(30.6)

¶¶

464

(22.8)

¶¶

2,793

(29.0)

¶¶

Widowed

405

(5.3)

¶¶

162

(7.9)

¶¶

567

(5.9)

¶¶

Divorced

1,680

(22.1)

¶¶

606

(29.7)

¶¶

2,286

(23.7)

¶¶

Married, but separated

35

(0.5)

¶¶

6

(0.3)

¶¶

41

(0.4)

¶¶

Single, not otherwise specified

36

(0.5)

¶¶

6

(0.3)

¶¶

42

(0.4)

¶¶

Unknown

177

(2.3)

¶¶

50

(2.5)

¶¶

227

(2.4)

¶¶

Total

7,609

(100.0)

¶¶

2,038

(100.0)

¶¶

9,647

(100.0)

¶¶

* Percentages might not total 100% because of rounding.

Per 100,000 population.

§ Alaska, Colorado, Georgia, Kentucky, Maryland, Massachusetts, North Carolina, New Jersey, New Mexico, Oklahoma, Oregon, Rhode Island, South Carolina, Utah, Virginia, and Wisconsin.

Rates not reported when number of decedents is <20.

** Includes persons of any race.

§§ Includes only decedents aged >18 years.

¶¶ Rates cannot be computed for marital status because denominators are unknown.


TABLE 5. Number and percentage* of suicides, by sex of victim, method used, and location in which injury occurred — National Violent Death Reporting System, 16 states, 2009

Characteristic

Male

Female

Total

No.

(%)

No.

(%)

No.

(%)

Method

Firearm

4,436

(56.7)

718

(33.8)

5,154

(51.8)

Sharp instrument

148

(1.9)

28

(1.3)

176

(1.8)

Blunt instrument

4

(0.1)

0

(0.0)

4

(0.0)

Poisoning

927

(11.8)

782

(36.9)

1,709

(17.2)

Hanging/Strangulation/Suffocation

1,977

(25.3)

485

(22.9)

2,462

(24.7)

Fall

109

(1.4)

37

(1.7)

146

(1.5)

Drowning

60

(0.8)

33

(1.6)

93

(0.9)

Fire/Burns

30

(0.4)

10

(0.5)

40

(0.4)

Motor vehicles (e.g., buses, motorcycles, and other transport vehicles)

97

(1.2)

22

(1.0)

119

(1.2)

Other (single method)

11

(0.1)

3

(0.1)

14

(0.1)

Unknown

28

(0.4)

4

(0.2)

32

(0.3)

Total

7,827

(100.0)

2,122

(100.0)

9,949

(100.0)

Location

House

5,874

(75.0)

1725

(81.3)

7,599

(76.4)

Street/Highway

292

(3.7)

58

(2.7)

350

(3.5)

Motor vehicle

221

(2.8)

54

(2.5)

275

(2.8)

Bar/Nightclub

0

(0.0)

0

(0.0)

0

0

Commercial/Retail Area

50

(0.6)

8

(0.4)

58

(0.6)

Industrial or construction area

35

(0.4)

5

(0.2)

40

(0.4)

Office building

26

(0.3)

3

(0.1)

29

(0.3)

Parking lot/Public garage

131

(1.7)

10

(0.5)

141

(1.4)

Abandoned house, building, or warehouse

12

(0.2)

1

(0.0)

13

(0.1)

Park, playground, or sports/athletic area

145

(1.9)

22

(1.0)

167

(1.7)

Preschool/School/College/School bus

3

(0.0)

5

(0.2)

8

(0.1)

Public transportation/Station/Railroad tracks

33

(0.4)

9

(0.4)

42

(0.4)

Hospital or medical facility

24

(0.3)

20

(0.9)

44

(0.4)

Supervised residential facility

28

(0.4)

10

(0.5)

38

(0.4)

Jail/Prison

142

(1.8)

18

(0.8)

160

(1.6)

Farm

39

(0.5)

3

(0.1)

42

(0.4)

Natural area

344

(4.4)

54

(2.5)

398

(4.0)

Hotel/Motel

151

(1.9)

51

(2.4)

202

(2.0)

Other

189

(2.4)

32

(1.5)

221

(2.2)

Unknown

88

(1.1)

34

(1.6)

122

(1.2)

Total

7,827

(100.0)

2,122

(100.0)

9,949

(100.0)

* Percentages might not total 100% because of rounding.

Alaska, Colorado, Georgia, Kentucky, Maryland, Massachusetts, North Carolina, New Jersey, New Mexico, Oklahoma, Oregon, Rhode Island, South Carolina, Utah, Virginia, and Wisconsin.


TABLE 6. Number* and percentage of suicide victims tested for alcohol and drugs whose results were positive, by toxicology variable — National Violent Death Reporting System, 16 states, 2009

Toxicology variable

Tested

Positive

No.

(%)

No.

(%)

BAC§

6,881

(69.2)

2,290

(33.3)

<0.08 g/dL§

724

(31.6)

≥0.08 g/dL§

1,478

(64.5)

Alcohol-positive, level unknown

88

(3.8)

Amphetamines

4,704

(47.3)

152

(3.2)

Antidepressants

4,104

(41.3)

947

(23.1)

Cocaine

4,782

(48.1)

249

(5.2)

Marijuana

3,663

(36.8)

339

(9.3)

Opiates

4,790

(48.2)

996

(20.8)

Other drug(s)

4,677

(47.0)

2,040

(43.6)

Abbreviation: BAC = blood alcohol concentration.

* N = 9,949.

Alaska, Colorado, Georgia, Kentucky, Maryland, Massachusetts, North Carolina, New Jersey, New Mexico, Oklahoma, Oregon, Rhode Island, South Carolina, Utah, Virginia, and Wisconsin.

§ BAC ≥0.08 g/dL used as the standard for intoxication. Other substances indicated whether any results were positive; levels for these substances are not measured.


TABLE 7. Number* and percentage of suicides, by sex and precipitating circumstances — National Violent Death Reporting System, 16 states,§ 2009

Circumstance

Male

Female

Total

No.

(%)

No.

(%)

No.

(%)

Mental health/Substance abuse

Current depressed mood

2,820

(40.7)

814

(42.1)

3,634

(41.0)

Current mental health problem

2,724

(39.3)

1,184

(61.3)

3,908

(44.1)

Current mental health treatment

1,830

(26.4)

944

(48.9)

2,774

(31.3)

Alcohol problem

1,317

(19.0)

298

(15.4)

1,615

(18.2)

Other substance abuse problem

933

(13.5)

340

(17.6)

1,273

(14.4)

Interpersonal 

Intimate partner problem

2,289

(33.0)

493

(25.5)

2,782

(31.4)

Other relationship problem (nonintimate)

659

(9.5)

267

(13.8)

926

(10.4)

Suicide of family member or friend within past 5 years

127

(1.8)

34

(1.8)

161

(1.8)

Other death of family member or friend within past 5 years

443

(6.4)

110

(5.7)

553

(6.2)

Perpetrator of interpersonal violence within past month

332

(4.8)

27

(1.4)

359

(4.0)

Victim of interpersonal violence within past month

19

(0.3)

15

(0.8)

34

(0.4)

Life stressor 

Crisis in past or impending 2 weeks

1,926

(27.8)

435

(22.5)

2,361

(26.6)

Physical health problem

1,419

(20.5)

442

(22.9)

1,861

(21.0)

Job problem

1,103

(15.9)

194

(10.0)

1,297

(14.6)

Recent criminal legal problem

736

(10.6)

102

(5.3)

838

(9.5)

Noncriminal legal problem

247

(3.6)

70

(3.6)

317

(3.6)

Financial problem

987

(14.2)

233

(12.1)

1,220

(13.8)

School problem

83

(1.2)

24

(1.2)

107

(1.2)

Suicide event

Left a suicide note

2,186

(31.5)

751

(38.9)

2,937

(33.1)

Disclosed intent to commit suicide

1,949

(28.1)

560

(29.0)

2,509

(28.3)

History of suicide attempt(s)

1,102

(15.9)

653

(33.8)

1,755

(19.8)

* N = 8,867 (6,935 males and 1,932 females). Circumstances were unknown for 1,082 deaths.

Percentages might exceed 100% because multiple circumstances might have been coded.

§ Alaska, Colorado, Georgia, Kentucky, Maryland, Massachusetts, North Carolina, New Jersey, New Mexico, Oklahoma, Oregon, Rhode Island, South Carolina, Utah, Virginia, and Wisconsin.


TABLE 8. Number* and percentage of suicide decedents who had received a diagnosis of a current mental health problem, by diagnosis — National Violent Death Reporting System, 16 states,§ 2009

Mental health problem

Male

Female

Total

No.

(%)

No.

(%)

No.

(%)

Depression/Dysthymia

1,988

(73.0)

908

(76.7)

2,896

(74.1)

Bipolar disorder

383

(14.1)

187

(15.8)

570

(14.6)

Anxiety disorder

260

(9.5)

153

(12.9)

413

(10.6)

Schizophrenia

147

(5.4)

43

(3.6)

190

(4.9)

Posttraumatic stress disorder

65

(2.4)

15

(1.3)

80

(2.0)

Obsessive-compulsive disorder

14

(0.5)

4

(0.3)

18

(0.5)

Attention deficit disorder/attention deficit and hyperactivity disorder

43

(1.6)

10

(0.8)

53

(1.4)

Eating disorder

0

(0.0)

11

(0.9)

11

(0.3)

Other

108

(4.0)

44

(3.7)

152

(3.9)

Unknown

238

(8.7)

108

(9.1)

346

(8.9)

* N = 3,908 (2,724 males and 1,184 females).

Percentages might exceed 100% because multiple diagnosis categories might have been coded.

§ Alaska, Colorado, Georgia, Kentucky, Maryland, Massachusetts, North Carolina, New Jersey, New Mexico, Oklahoma, Oregon, Rhode Island, South Carolina, Utah, Virginia, and Wisconsin.


TABLE 9. Number,* percentage, and rate§ of homicides/legal intervention deaths, by method used and month in which death occurred — National Violent Death Reporting System, 16 states, 2009

Characteristic

No.

(%)

Rate

Method

Firearm

2,697

(66.5)

3.3

Sharp instrument

524

(12.9)

0.6

Blunt instrument

285

(7.0)

0.3

Poisoning

21

(0.5)

0.0

Hanging/Strangulation/Suffocation

152

(3.7)

0.2

Personal weapons (hands, feet, or fists)

144

(3.5)

0.2

Fall

10

(0.2)

—**

Drowning

14

(0.3)

—**

Fire/Burns

22

(0.5)

0.0

Shaking

35

(0.9)

0.0

Motor vehicles (e.g., buses, motorcycles, and other transport vehicles)

26

(0.6)

0.1

Intentional neglect

9

(0.2)

—**

Other

24

(0.6)

0.0

Unknown

94

(2.3)

0.1

Total

4,057

(100.0)

5.0

Month

January

368

(9.1)

0.5

February

270

(6.7)

0.3

March

311

(7.7)

0.4

April

337

(8.3)

0.4

May

352

(8.7)

0.4

June

363

(8.9)

0.4

July

389

(9.6)

0.5

August

367

(9.0)

0.4

September

300

(7.4)

0.4

October

341

(8.4)

0.4

November

337

(8.3)

0.4

December

316

(7.8)

0.4

Unknown

6

(0.1)

—**

Total

4,057

(100.0)

5.0

* Total includes 4,046 victims and 11 suspects who were subsequently killed; no. of incidents = 3,840.

Percentages might not total 100% because of rounding.

§ Per 100,000 population.

Alaska, Colorado, Georgia, Kentucky, Maryland, Massachusetts, North Carolina, New Jersey, New Mexico, Oklahoma, Oregon, Rhode Island, South Carolina, Utah, Virginia, and Wisconsin.

** Rates not reported when number of decedents is <20.


TABLE 10. Number and percentage* of homicides/legal intervention deaths, by victim's marital status and relationship to suspect — National Violent Death Reporting System, 16 states, 2009

Characteristic

No.

(%)

Marital status§

Married

834

(22.8)

Never married

1,985

(54.3)

Widowed

125

(3.4)

Divorced

528

(14.4)

Married, but separated

14

(0.4)

Single, not otherwise specified

34

(0.9)

Unknown

136

(3.7)

Total

3,656

(100.0)

Relationship

Spouse/Intimate partner (current or former)

417

(10.3)

Parent

86

(2.1)

Child

116

(2.9)

Other intimate partner involvement

37

(0.9)

Other relative

117

(2.9)

Acquaintance/Friend

412

(10.2)

Rival gang member

32

(0.8)

Stranger

185

(4.6)

Victim injured by a law enforcement officer

137

(3.4)

Other specified relationship

321

(7.9)

Relationship unknown/Missing

2197

(54.2)

Total

4,057

(100.0)

* Percentages might not total 100% because of rounding.

Alaska, Colorado, Georgia, Kentucky, Maryland, Massachusetts, North Carolina, New Jersey, New Mexico, Oklahoma, Oregon, Rhode Island, South Carolina, Utah, Virginia, and Wisconsin.

§ Includes only victims aged >18 years.

Death resulting from intimate partner–related violence but not between the intimate partners themselves (e.g., child killed by mother's boyfriend or teenager kills mother's boyfriend).


TABLE 11. Number, percentage,* and rate of homicides/legal intervention deaths, by victim's sex, age group, and race/ethnicity — National Violent Death Reporting System, 16 states,§ 2009

Characteristic

Male

Female

Total

No.

(%)

Rate

No.

(%)

Rate

No.

(%)

Rate

Age group (yrs)

<1

49

(1.6)

8.5

39

(4.0)

7.1

88

(2.2)

7.8

1–4

50

(1.6)

2.2

44

(4.5)

2.0

94

(2.3)

2.1

5–9

17

(0.6)

14

(1.4)

31

(0.8)

0.6

10–14

26

(0.8)

1.0

13

(1.3)

39

(1.0)

0.7

15–19

311

(10.1)

10.7

69

(7.0)

2.5

380

(9.4)

6.7

20–24

586

(19.1)

19.6

102

(10.4)

3.6

688

(17.0)

11.9

25–29

481

(15.6)

16.4

91

(9.3)

3.2

572

(14.1)

10.0

30–34

352

(11.4)

13.2

92

(9.4)

3.5

444

(10.9)

8.4

35–44

512

(16.6)

9.1

167

(17.0)

3.0

679

(16.7)

6.0

45–54

381

(12.4)

6.5

161

(16.4)

2.6

542

(13.4)

4.5

55–64

180

(5.9)

4.0

90

(9.2)

1.9

270

(6.7)

2.9

65–74

83

(2.7)

3.3

40

(4.1)

1.4

123

(3.0)

2.3

75–84

28

(0.9)

2.1

28

(2.9)

1.4

56

(1.4)

1.7

≥85

19

(0.6)

24

(2.4)

2.5

43

(1.1)

3.2

Unknown

1

(0.0)

7

(0.7)

8

(0.2)

Total

3,076

(100.0)

7.7

981

(100.0)

2.4

4,057

(100.0)

5.0

Race/Ethnicity

White, non-Hispanic

955

(31.0)

3.4

533

(54.3)

1.8

1,488

(36.7)

2.6

Black, non-Hispanic

1642

(53.4)

27.4

333

(33.9)

5.0

1,975

(48.7)

15.6

Asian/Pacific Islander

48

(1.6)

1.2

19

(1.9)

67

(1.7)

2.2

American Indian/Alaska Native

78

(2.5)

15.3

19

(1.9)

97

(2.4)

9.4

Hispanic**

333

(10.8)

7.6

73

(7.4)

1.8

406

(10.0)

4.9

Other††

18

(0.6)

4

(0.4)

22

(0.5)

0.0

Unknown††

2

(0.0)

0

(0.0)

2

(0.0)

Total

3,076

(100.0)

7.7

981

(100.0)

2.4

4,057

(100.0)

5.0

* Percentages might not total 100% because of rounding.

Per 100,000 population.

§ Alaska, Colorado, Georgia, Kentucky, Maryland, Massachusetts, North Carolina, New Jersey, New Mexico, Oklahoma, Oregon, Rhode Island, South Carolina, Utah, Virginia, and Wisconsin.

Rates not reported when number of decedents is <20.

** Includes persons of any race.

†† Rates not computed for "other" or "unknown" categories.


TABLE 12. Number and percentage* of homicides/legal intervention deaths, by victim's sex, method used, and location in which injury occurred — National Violent Death Reporting System, 16 states, 2009

Method/Location

Male

Female

Total

No.

(%)

No.

(%)

No.

(%)

Method

Firearm

2,218

(72.1)

479

(48.8)

2,697

(66.5)

Sharp instrument

363

(11.8)

161

(16.4)

524

(12.9)

Blunt instrument

196

(6.4)

89

(9.1)

285

(7.0)

Poisoning

9

(0.3)

12

(1.2)

21

(0.5)

Hanging/Strangulation/Suffocation

49

(1.6)

103

(10.5)

152

(3.7)

Personal weapons (hands, feet, or fists)

102

(3.3)

42

(4.3)

144

(3.5)

Fall

10

(0.3)

0

(0.0)

10

(0.2)

Drowning

8

(0.3)

6

(0.6)

14

(0.3)

Fire/Burns

12

(0.4)

10

(1.0)

22

(0.5)

Shaking

15

(0.5)

20

(2.0)

35

(0.9)

Motor vehicles (e.g., buses, motorcycles, and other transport vehicles)

18

(0.6)

8

(0.8)

26

(0.6)

Intentional neglect

4

(0.1)

5

(0.5)

9

(0.2)

Other

18

(0.6)

6

(0.6)

24

(0.6)

Unknown

54

(1.8)

40

(4.1)

94

(2.3)

Total

3,076

(100.0)

981

(100.0)

4,057

(100.0)

Location 

House

1,430

(46.5)

726

(74.0)

2,156

(53.1)

Street/Highway

744

(24.2)

66

(6.7)

810

(20.0)

Motor vehicle

112

(3.6)

23

(2.3)

135

(3.3)

Bar/Nightclub

72

(2.3)

6

(0.6)

78

(1.9)

Commercial/Retail area

125

(4.1)

16

(1.6)

141

(3.5)

Industrial or construction area

17

(0.6)

4

(0.4)

21

(0.5)

Office building

10

(0.3)

5

(0.5)

15

(0.4)

Parking lot/Public garage

161

(5.2)

18

(1.8)

179

(4.4)

Abandoned house, building, or warehouse

7

(0.2)

2

(0.2)

9

(0.2)

Park, playground, or sports/athletic area

60

(2.0)

6

(0.6)

66

(1.6)

Preschool/School/College/School bus

7

(0.2)

1

(0.1)

8

(0.2)

Public transportation/Station/Railroad tracks

1

(0.0)

0

(0.0)

1

(0.0)

Hospital or medical facility

13

(0.4)

12

(1.2)

25

(0.6)

Supervised residential facility

5

(0.2)

1

(0.1)

6

(0.1)

Jail/Prison

32

(1.0)

0

(0.0)

32

(0.8)

Farm

4

(0.1)

1

(0.1)

5

(0.1)

Natural area

67

(2.2)

30

(3.1)

97

(2.4)

Hotel/Motel

26

(0.8)

6

(0.6)

32

(0.8)

Other

82

(2.7)

19

(1.9)

101

(2.5)

Unknown

101

(3.3)

39

(4.0)

140

(3.5)

Total

3,076

(100.0)

981

(100.0)

4,057

(100.0)

* Percentages might not total 100% because of rounding.

Alaska, Colorado, Georgia, Kentucky, Maryland, Massachusetts, North Carolina, New Jersey, New Mexico, Oklahoma, Oregon, Rhode Island, South Carolina, Utah, Virginia, and Wisconsin.


TABLE 13. Number* and percentage of homicide/legal intervention victims tested for alcohol and drugs whose results were positive, by toxicology variable — National Violent Death Reporting System, 16 states, 2009

Toxicology variable

Tested

Positive

No.

(%)

No.

(%)

BAC§

3,074

(75.8)

1,051

(34.2)

<0.08 g/dL§

— 

— 

350

(33.3)

≥0.08 g/dL§

— 

— 

640

(60.9)

Alcohol-positive, level unknown

— 

— 

61

(5.8)

Amphetamines

2,415

(59.5)

103

(4.3)

Antidepressants

1,700

(41.9)

79

(4.7)

Cocaine

2,450

(60.4)

247

(10.1)

Marijuana

1,469

(36.2)

343

(23.4)

Opiates

2,343

(57.8)

213

(9.1)

Other drug(s)

2,085

(51.4)

464

(22.3)

Abbreviation: BAC = blood alcohol concentration.

* N = 4,057.

Alaska, Colorado, Georgia, Kentucky, Maryland, Massachusetts, North Carolina, New Jersey, New Mexico, Oklahoma, Oregon, Rhode Island, South Carolina, Utah, Virginia, and Wisconsin.

§ BAC ≥ 0.08 g/dL used as the standard for intoxication. Other substances indicated whether any results were positive; levels for these substances are not measured.


TABLE 14. Number* and percentage of homicide/legal intervention deaths, by precipitating circumstances and victim's sex — National Violent Death Reporting System, 16 states,§ 2009

Circumstance

Male

Female

Total

No.

(%)

No.

(%)

No.

(%)

Precipitated by another crime

719

(33.7)

134

(18.3)

853

(29.8)

Crime in progress

532

(74.0)

94

(70.1)

626

(73.4)

Argument over money/property

143

(6.7)

31

(4.2)

174

(6.1)

Jealousy (lover's triangle)

78

(3.7)

39

(5.3)

117

(4.1)

Other argument, abuse, conflict

871

(40.8)

162

(22.2)

1,033

(36.0)

Drug involvement

298

(14.0)

32

(4.4)

330

(11.5)

Justifiable self-defense/Law enforcement

183

(8.6)

11

(1.5)

193

(6.7)

Brawl

40

(1.9)

0

(0.0)

40

(1.4)

Mercy killing

3

(0.1)

5

(0.7)

8

(0.3)

Victim was a bystander

35

(1.6)

27

(3.7)

62

(2.2)

Victim was a police officer on duty

9

(0.4)

0

(0.0)

9

(0.3)

Victim was an intervener assisting a crime victim

7

(0.3)

2

(0.3)

9

(0.3)

Victim used a weapon

248

(11.6)

14

(1.9)

262

(9.1)

Intimate partner-violence-related

174

(8.1)

330

(45.1)

504

(17.6)

Hate crime

2

(0.1)

1

(0.1)

3

(0.1)

Mentally ill suspect

31

(1.5)

33

(4.5)

64

(2.2)

Drive-by shooting

82

(3.8)

14

(1.9)

96

(3.3)

Random violence

42

(2.0)

16

(2.2)

58

(2.0)

Gang related

134

(6.3)

14

(1.9)

148

(5.2)

* N = 2,866 (2,135 males and 731 females). Circumstances were unknown for 1,191 deaths.

Percentages might exceed 100% because multiple circumstances might have been coded.

§ Alaska, Colorado, Georgia, Kentucky, Maryland, Massachusetts, North Carolina, New Jersey, New Mexico, Oklahoma, Oregon, Rhode Island, South Carolina, Utah, Virginia, and Wisconsin.

Denominator only includes cases that were precipitated by another crime.


TABLE 15. Number and percentage* of homicides/legal intervention deaths precipitated by another crime in progress at the time of injury, by type of crime — National Violent Death Reporting System, 16 states, 2009

Crime type

No.

(%)

Robbery

313

(36.7)

Burglary

94

(11.0)

Assault/Homicide

188

(22.0)

Rape or sexual assault

33

(3.9)

Motor vehicle theft

16

(1.9)

Arson

10

(1.2)

Drug trade

66

(7.7)

Witness intimidation/Elimination

3

(0.4)

Gambling

1

(0.1)

Other

69

(8.1)

Unknown

60

(7.0)

* Percentages might exceed 100% because multiple crimes might have been coded.

Alaska, Colorado, Georgia, Kentucky, Maryland, Massachusetts, North Carolina, New Jersey, New Mexico, Oklahoma, Oregon, Rhode Island, South Carolina, Utah, Virginia, and Wisconsin.


TABLE 16. Number,* percentage, and rate§ of undetermined deaths, by method used and month in which death occurred — National Violent Death Reporting System, 16 states,** 2009

Characteristic

No.

(%)

Rate

Method

Firearm

75

(3.2)

0.1

Sharp instrument

8

(0.3)

††

Blunt instrument

52

(2.2)

0.1

Poisoning

1,406

(60.5)

1.7

Hanging/Strangulation/Suffocation

30

(1.3)

0.0

Personal weapons (hands, feet, or fists)

5

(0.2)

††

Fall

32

(1.4)

0.0

Drowning

51

(2.2)

0.1

Fire/Burns

27

(1.2)

0.0

Shaking

2

(0.1)

††

Motor vehicles (e.g., buses, motorcycles, and other transport vehicles)

24

(1.0)

0.0

Intentional neglect

3

(0.1)

††

Other (single method)

60

(2.6)

0.1

Unknown

550

(23.7)

0.7

Total

2,325

(100.0)

2.8

Month 

January

207

(8.9)

0.3

February

182

(7.8)

0.2

March

212

(9.1)

0.3

April

194

(8.3)

0.2

May

185

(8.0)

0.2

June

167

(7.2)

0.2

July

213

(9.2)

0.3

August

190

(8.2)

0.2

September

187

(8.0)

0.2

October

203

(8.7)

0.2

November

187

(8.0)

0.2

December

190

(8.2)

0.2

Unknown

8

(0.3)

††

Total

2,325

(100.0)

2.8

* No. of victims = 2,325; no. of suspects/victims = 0; no. of live suspects = 61; no. of incidents = 2,316, including two incidents categorized in "other combinations of deaths" in Table 1.

Percentages might not total 100% because of rounding.

§ Per 100,000 population.

Deaths that result from the use of force or power against oneself or another person for which evidence indicating one manner of death is no more compelling than evidence indicating another.

** Alaska, Colorado, Georgia, Kentucky, Maryland, Massachusetts, North Carolina, New Jersey, New Mexico, Oklahoma, Oregon, Rhode Island, South Carolina, Utah, Virginia, and Wisconsin.

†† Rates not reported when number of decedents is <20.


TABLE 17. Number, percentage,* and rate of undetermined deaths,§ by victim's sex, age group, race/ethnicity and marital status — National Violent Death Reporting System, 16 states, 2009

Characteristic

Male

Female

Total

No.

(%)

Rate

No.

(%)

Rate

No.

(%)

Rate

Age group (yrs)

<1

192

(13.2)

33.2

117

(13.4)

21.2

309

(13.3)

27.3

1–4

20

(1.4)

0.9

11

(1.3)

—**

31

(1.3)

0.7

5–9

4

(0.3)

—**

3

(0.3)

—**

7

(0.3)

—**

10–14

7

(0.5)

—**

6

(0.7)

—**

13

(0.6)

—**

15–19

42

(2.9)

1.4

12

(1.4)

—**

54

(2.3)

0.9

20–24

94

(6.5)

3.1

39

(4.5)

1.4

133

(5.7)

2.3

25–29

126

(8.7)

4.3

43

(4.9)

1.5

169

(7.3)

2.9

30–34

100

(6.9)

3.7

57

(6.5)

2.2

157

(6.8)

3.0

35–44

257

(17.7)

4.6

161

(18.4)

2.9

418

(18.0)

3.7

45–54

339

(23.4)

5.8

233

(26.6)

3.8

572

(24.6)

4.8

55–64

189

(13.0)

4.2

125

(14.3)

2.6

314

(13.5)

3.4

65–74

37

(2.6)

1.5

40

(4.6)

1.4

77

(3.3)

1.4

75–84

26

(1.8)

1.9

12

(1.4)

—**

38

(1.6)

1.1

≥85

11

(0.8)

—**

15

(1.7)

—**

26

(1.1)

1.9

Unknown

6

(0.4)

—**

1

(0.1)

—**

7

(0.3)

—**

Total

1,450

(100.0)

3.6

875

(100.0)

2.1

2,325

(100.0)

2.8

Race/Ethnicity 

White, non-Hispanic

1,069

(73.7)

3.8

654

(74.7)

2.3

1,723

(74.1)

3.0

Black, non-Hispanic

255

(17.6)

4.2

146

(16.7)

2.2

401

(17.2)

3.2

Asian/Pacific Islander

13

(0.9)

—**

2

(0.2)

—**

15

(0.6)

—**

American Indian/Alaska Native

31

(2.1)

6.1

37

(4.2)

7.0

68

(2.9)

6.6

Hispanic††

78

(5.4)

1.8

36

(4.1)

0.9

114

(4.9)

1.4

Other

4

(0.3)

—**

0

(0.0)

—**

4

(0.2)

—**

Unknown

0

(0.0)

—**

0

(0.0)

—**

0

(0.0)

—**

Total

1,450

(100.0)

3.6

875

(100.0)

2.1

2,325

(100.0)

2.8

Marital status§§ 

Married

271

(22.3)

¶¶

238

(32.5)

¶¶

509

(26.2)

¶¶

Never married

539

(44.4)

¶¶

183

(25.0)

¶¶

722

(37.1)

¶¶

Widowed

48

(4.0)

¶¶

66

(9.0)

¶¶

114

(5.9)

¶¶

Divorced

314

(25.9)

¶¶

227

(31.0)

¶¶

541

(27.8)

¶¶

Married, but separated

4

(0.3)

¶¶

5

(0.7)

¶¶

9

(0.5)

¶¶

Single, not otherwise specified

3

(0.2)

¶¶

3

(0.4)

¶¶

6

(0.3)

¶¶

Unknown

35

(2.9)

¶¶

10

(1.4)

¶¶

45

(2.3)

¶¶

Total

1,214

(100.0)

¶¶

732

(100.0)

¶¶

1,946

(100.0)

¶¶

* Percentages might not total 100% because of rounding.

Per 100,000 population.

§ Deaths that result from the use of force or power against oneself or another person for which evidence indicating one manner of death is no more compelling than evidence indicating another.

Alaska, Colorado, Georgia, Kentucky, Maryland, Massachusetts, North Carolina, New Jersey, New Mexico, Oklahoma, Oregon, Rhode Island, South Carolina, Utah, Virginia, and Wisconsin.

** Rates not reported when number of decedents is <20.

†† Includes persons of any race.

§§ Includes only those decedents aged >18 years.

¶¶ Rates cannot be computed for marital status because denominators are unknown.


TABLE 18. Number and percentage* of undetermined deaths, by decedent's sex, method used, and location in which injury occurred — National Violent Death Reporting System, 16 states,§ 2009

 Characteristic

Male

Female

Total

No.

(%)

No.

(%)

No.

(%)

Method

Firearm

64

(4.4)

11

(1.3)

75

(3.2)

Sharp instrument

8

(0.6)

0

(0.0)

8

(0.3)

Blunt instrument

35

(2.4)

17

(1.9)

52

(2.2)

Poisoning

853

(58.8)

553

(63.2)

1,406

(60.5)

Hanging/Strangulation/Suffocation

23

(1.6)

7

(0.8)

30

(1.3)

Personal weapons (hands, feet, or fists)

5

(0.3)

0

(0.0)

5

(0.2)

Fall

21

(1.4)

11

(1.3)

32

(1.4)

Drowning

36

(2.5)

15

(1.7)

51

(2.2)

Fire/Burns

17

(1.2)

10

(1.1)

27

(1.2)

Shaking

2

(0.1)

0

(0.0)

2

(0.1)

Motor vehicles (e.g., buses, motorcycles, and other transport vehicles)

20

(1.4)

4

(0.5)

24

(1.0)

Intentional neglect

1

(0.1)

2

(0.2)

3

(0.1)

Other

37

(2.6)

23

(2.6)

60

(2.6)

Unknown

328

(22.6)

222

(25.4)

550

(23.7)

Total

1,450

(100.0)

875

(100.0)

2,325

(100.0)

Location 

House

1,108

(76.4)

723

(82.6)

1,831

(78.8)

Street/Highway

38

(2.6)

8

(0.9)

46

(2.0)

Motor vehicle

28

(1.9)

8

(0.9)

36

(1.5)

Bar/Nightclub

3

(0.2)

0

(0.0)

3

(0.1)

Commercial/Retail area

12

(0.8)

2

(0.2)

14

(0.6)

Industrial or construction area

1

(0.1)

1

(0.1)

2

(0.1)

Office building

2

(0.1)

0

(0.0)

2

(0.1)

Parking lot/Public garage

14

(1.0)

2

(0.2)

16

(0.7)

Abandoned house, building, or warehouse

11

(0.8)

3

(0.3)

14

(0.6)

Park, playground, or sports/athletic area

9

(0.6)

5

(0.6)

14

(0.6)

Preschool/School/College/School bus

1

(0.1)

0

(0.0)

1

(0.0)

Public transportation/Station/Railroad tracks

4

(0.3)

1

(0.1)

5

(0.2)

Hospital or medical facility

16

(1.1)

19

(2.2)

35

(1.5)

Supervised residential facility

6

(0.4)

5

(0.6)

11

(0.5)

Jail/Prison

14

(1.0)

0

(0.0)

14

(0.6)

Farm

1

(0.1)

0

(0.0)

1

(0.0)

Natural area

50

(3.4)

10

(1.1)

60

(2.6)

Hotel/Motel

27

(1.9)

10

(1.1)

37

(1.6)

Other

25

(1.7)

15

(1.7)

40

(1.7)

Unknown

80

(5.5)

63

(7.2)

143

(6.2)

Total

1,450

(100.0)

875

(100.0)

2,325

(100.0)

* Percentages might not total 100% because of rounding.

Deaths that result from the use of force or power against oneself or another person for which evidence indicating one manner of death is no more compelling than evidence indicating another.

§ Alaska, Colorado, Georgia, Kentucky, Maryland, Massachusetts, North Carolina, New Jersey, New Mexico, Oklahoma, Oregon, Rhode Island, South Carolina, Utah, Virginia, and Wisconsin.


TABLE 19. Number* and percentage of decedents with deaths of undetermined intent who were tested for alcohol and drugs whose results were positive, by toxicology variable — National Violent Death Reporting System, 16 states,§ 2009

Toxicology variable

Tested

Positive

No.

(%)

No.

(%)

BAC

1,875

(80.7)

487

(26.0)

<0.08 g/dL

— 

 —

198

(40.7)

≥0.08 g/dL

274

(56.3)

Alcohol-positive, level unknown

15

(3.1)

Amphetamines

1,806

(77.7)

78

(4.3)

Antidepressants

1,644

(70.7)

457

(27.8)

Cocaine

1,836

(79.0)

288

(15.7)

Marijuana

906

(39.0)

94

(10.4)

Opiates

1,872

(80.5)

1,089

(58.2)

Other drug(s)

1,801

(77.5)

991

(55.0)

Abbreviation: BAC = blood alcohol concentration.

* N = 2,325.

Deaths that result from the use of force or power against oneself or another person for which evidence indicating one manner of death is no more compelling than evidence indicating another.

§ Alaska, Colorado, Georgia, Kentucky, Maryland, Massachusetts, North Carolina, New Jersey, New Mexico, Oklahoma, Oregon, Rhode Island, South Carolina, Utah, Virginia, and Wisconsin.

BAC ≥0.08 g/dL used as the standard for intoxication. Other substances indicated whether any results were positive; levels for these substances are not measured.


TABLE 20. Number* and percentage of deaths of undetermined intent,§ by decedent's sex and precipitating circumstances — National Violent Death Reporting System, 16 states, 2009

Characteristic

Male

Female

Total

No.

(%)

No.

(%)

No.

(%)

Mental health/Substance abuse 

Current depressed mood

138

(13.3)

94

(14.6)

232

(13.8)

Current mental health problem

347

(33.3)

342

(53.2)

689

(40.9)

Current mental health treatment

223

(21.4)

278

(43.2)

501

(29.8)

Alcohol problem

343

(32.9)

161

(25.0)

504

(29.9)

Other substance abuse problem

603

(57.9)

353

(54.9)

956

(56.8)

Interpersonal

Intimate partner problem

107

(10.3)

79

(12.3)

186

(11.0)

Other relationship problem (nonintimate)

51

(4.9)

30

(4.7)

81

(4.8)

Suicide of family member or friend within past 5 years

3

(0.3)

7

(1.1)

10

(0.6)

Other death of family member or friend within past 5 years

29

(2.8)

33

(5.1)

62

(3.7)

Perpetrator of interpersonal violence within past month

14

(1.3)

2

(0.3)

16

(1.0)

Victim of interpersonal violence within past month

18

(1.7)

10

(1.6)

28

(1.7)

Life stressor

Crisis in past or impending 2 weeks

139

(13.4)

110

(17.1)

249

(14.8)

Physical health problem

302

(29.0)

259

(40.3)

561

(33.3)

Job problem

53

(5.1)

16

(2.5)

69

(4.1)

Recent criminal legal problem

50

(4.8)

13

(2.0)

63

(3.7)

Non-criminal legal problem

12

(1.2)

5

(0.8)

17

(1.0)

Financial problem

34

(3.3)

17

(2.6)

51

(3.0)

School problem

5

(0.5)

1

(0.2)

6

(0.4)

Suicide event

Left a suicide note

19

(1.8)

16

(2.5)

35

(2.1)

Disclosed intent to commit suicide

71

(6.8)

61

(9.5)

132

(7.8)

History of suicide attempt(s)

86

(8.3)

112

(17.4)

198

(11.8)

* N = 1,684 (1,041 males and 643 females). Circumstances were unknown for 641 deaths.

Percentages might exceed 100% because multiple circumstances might have been coded.

§ Deaths that result from the use of force or power against oneself or another person for which evidence indicating one manner of death is no more compelling than evidence indicating another.

Alaska, Colorado, Georgia, Kentucky, Maryland, Massachusetts, North Carolina, New Jersey, New Mexico, Oklahoma, Oregon, Rhode Island, South Carolina, Utah, Virginia, and Wisconsin.


TABLE 21. Number* and percentage of decedents with deaths of undetermined intent§ who had received a diagnosis of a current mental health problem, by diagnosis — National Violent Death Reporting System, 16 states, 2009

Mental health problem

Male

Female

Total

No.

(%)

No.

(%)

No.

(%)

Depression/Dysthymia

222

(64.0)

217

(63.5)

439

(63.7)

Bipolar disorder

49

(14.1)

71

(20.8)

120

(17.4)

Anxiety disorder

53

(15.3)

49

(14.3)

102

(14.8)

Schizophrenia

25

(7.2)

16

(4.7)

41

(6.0)

Posttraumatic stress disorder

13

(3.7)

7

(2.0)

20

(2.9)

Obsessive compulsive disorder

1

(0.3)

3

(0.9)

4

(0.6)

Attention deficit disorder/hyperactivity disorder

12

(3.5)

8

(2.3)

20

(2.9)

Eating disorder

0

(0.0)

6

(1.8)

6

(0.9)

Other

19

(5.5)

15

(4.4)

34

(4.9)

Unknown

34

(9.8)

40

(11.7)

74

(10.6)

* N = 689 (347 males and 342 females).

Percentages might exceed 100% because two or more diagnosis categories per person could be coded.

§ Deaths that result from the use of force or power against oneself or another person for which evidence indicating one manner of death is no more compelling than evidence indicating another.

Alaska, Colorado, Georgia, Kentucky, Maryland, Massachusetts, North Carolina, New Jersey, New Mexico, Oklahoma, Oregon, Rhode Island, South Carolina, Utah, Virginia, and Wisconsin.


TABLE 22. Number* and percentage of unintentional firearm deaths, by victim's sex, race/ethnicity, age group, month in which death occurred, and location of injury — National Violent Death Reporting System, 16 states,§ 2009

Characteristic

No.

(%)

Sex

Male

76

(87.4)

Female

11

(12.6)

Total

87

(100.0)

Race/Ethnicity

White, non-Hispanic

62

(71.3)

Black, non-Hispanic

14

(16.1)

Asian/Pacific Islander

0

(0.0)

American Indian/Alaska Native

3

(3.4)

Hispanic

8

(9.2)

Total

87

(100.0)

Age group (yrs)

<1

0

(0.0)

1–4

3

(3.4)

5–9

3

(3.4)

10–14

7

(8.0)

15–19

13

(14.9)

20–24

7

(8.0)

25–29

9

(10.3)

30–34

4

(4.6)

35–44

12

(13.8)

45–54

8

(9.2)

55–64

6

(6.9)

65–74

9

(10.3)

75–84

4

(4.6)

≥85

2

(2.3)

Total

87

(100.0)


TABLE 22. (Continued) Number* and percentage of unintentional firearm deaths, by victim's sex, race/ethnicity, age group, month in which death occurred, and location of injury — National Violent Death Reporting System, 16 states,§ 2009

Characteristic

No.

(%)

Month

January

3

(3.4)

February

10

(11.5)

March

5

(5.7)

April

4

(4.6)

May

6

(6.9)

June

4

(4.6)

July

5

(5.7)

August

8

(9.2)

September

12

(13.8)

October

10

(11.5)

November

10

(11.5)

December

10

(11.5)

Total

87

(100.0)

Location

House

57

(65.5)

Street/Highway

2

(2.3)

Farm

1

(1.1)

Park, playground, or sports/athletic area

1

(1.1)

Natural area

17

(19.5)

Other**

6

(6.9)

Unknown

3

(3.4)

Total

87

(100.0)

Firearm type

Handgun

42

(48.3)

Shotgun

18

(20.7)

Rifle

15

(17.2)

Other firearm

2

(2.3)

Unknown

10

(11.5)

Total

87

(100.0)

* No. of incidents = 87; no. of decedents = 87.

Percentages might not total 100% because of rounding.

§ Alaska, Colorado, Georgia, Kentucky, Maryland, Massachusetts, North Carolina, New Jersey, New Mexico, Oklahoma, Oregon, Rhode Island, South Carolina, Utah, Virginia, and Wisconsin.

Includes persons of any race.

** Includes military training exercise, private land camp sites, and private hunting land attached to homes.


TABLE 23. Number* and percentage of unintentional firearm deaths, by context and circumstances of injury — National Violent Death Reporting System, 16 states,§ 2009

Context/Circumstance of injury

No.

(%)

Context

Hunting

18

(26.9)

Target shooting

4

(6.0)

Loading/Unloading gun

8

(11.9)

Cleaning gun

6

(9.0)

Showing gun to others

8

(11.9)

Playing with gun

20

(29.9)

Other context of injury

17

(25.4)

Circumstance

Thought safety was engaged

1

(1.5)

Thought unloaded, magazine disengaged

4

(6.0)

Thought gun was unloaded, other

13

(19.4)

Unintentionally pulled trigger

8

(11.9)

Bullet ricochet

1

(1.5)

Gun defect or malfunction

3

(4.5)

Fired while holstering/unholstering

2

(3.0)

Dropped gun

4

(6.0)

Fired while operating safety/lock

1

(1.5)

Gun mistaken for toy

1

(1.5)

Other mechanism of injury

25

(37.3)

* N = 67. Circumstances were unknown for 20 deaths.

Percentages might exceed 100% because multiple circumstances might have been coded.

§ Alaska, Colorado, Georgia, Kentucky, Maryland, Massachusetts, North Carolina, New Jersey, New Mexico, Oklahoma, Oregon, Rhode Island, South Carolina, Utah, Virginia, and Wisconsin.


TABLE 24. Number* and percentage of incidents involving multiple deaths, by incident type and method used — National Violent Death Reporting System, 16 states,§ 2009

Characteristic

No.

(%)

Incident type

Multiple suicides

14

(3.7)

Multiple homicides

141

(37.7)

Homicide followed by suicide

198

(52.9)

Legal intervention

3

(0.8)

Other combinations of deaths

11

(2.9)

Undetermined

7

(1.9)

Total

374

(100.0)

Method

Firearm

631

(77.4)

Sharp instrument

66

(8.1)

Blunt instrument

27

(3.3)

Poisoning

25

(3.1)

Hanging/Strangulation/Suffocation

23

(2.8)

Personal weapons

2

(0.2)

Fall

1

(0.1)

Drowning

4

(0.5)

Fire/Burns

17

(2.1)

Motor vehicles (e.g., buses, motorcycles, and other transport vehicles)

4

(0.5)

Other, single weapon

1

(0.1)

Unknown

14

(1.7)

Total

815

(100.0)

* No. of victims = 815; no. of suspects = 389; no. of incidents = 374; no. of decedents includes 209 homicide suspects who subsequently killed themselves.

Percentages might not total 100% because of rounding.

§ Alaska, Colorado, Georgia, Kentucky, Maryland, Massachusetts, North Carolina, New Jersey, New Mexico, Oklahoma, Oregon, Rhode Island, South Carolina, Utah, Virginia, and Wisconsin.


TABLE 25. Number, percentage,* and rate of incidents involving multiple victims, by victim's sex, race/ethnicity, and age group — National Violent Death Reporting System, 16 states,§ 2009

Characteristic

Victims

Suspects

No.

(%)

Rate

No.

(%)

Sex

Male

486

(59.6)

1.2

348

(89.5)

Female

329

(40.4)

0.8

25

(6.4)

Unknown

0

(0.0)

—**

16

(4.1)

Total

815

(100.0)

1.0

389

(100.0)

Race/Ethnicity 

White, non-Hispanic

457

(56.1)

0.8

175

(45.0)

Black, non-Hispanic

230

(28.2)

1.8

106

(27.3)

Asian/Pacific Islander

25

(3.1)

0.8

7

(1.8)

American Indian/Alaska Native

25

(3.1)

2.4

6

(1.5)

Hispanic††

73

(9.0)

0.9

38

(9.8)

Other

5

(0.6)

—**

55

(14.1)

Unknown

0

(0.0)

—**

2

(0.1)

Total

815

(100.0)

1.0

389

(100.0)

Age group (yrs)

<1

3

(0.4)

—**

0

(0.0)

1–4

16

(2.0)

—**

0

(0.0)

5–9

11

(1.3)

—**

0

(0.0)

10–14

10

(1.2)

—**

2

(0.5)

15–19

59

(7.2)

1.0

15

(3.9)

20–24

98

(12.0)

1.7

38

(9.8)

25–29

93

(11.4)

1.6

48

(12.3)

30–34

85

(10.4)

1.6

41

(10.5)

35–44

136

(16.7)

1.2

63

(16.2)

45–54

139

(17.1)

1.2

55

(14.1)

55–64

75

(9.2)

0.8

28

(7.2)

65–74

36

(4.4)

0.7

10

(2.6)

75–84

33

(4.0)

1.0

10

(2.6)

≥85

18

(2.2)

—**

7

(1.8)

Unknown

3

(0.4)

—**

72

(18.5)

Total

815

(100.0)

1.0

389

(100.0)

* Percentages might not total 100% because of rounding.

Per 100,000 population.

§ Alaska, Colorado, Georgia, Kentucky, Maryland, Massachusetts, North Carolina, New Jersey, New Mexico, Oklahoma, Oregon, Rhode Island, South Carolina, Utah, Virginia, and Wisconsin.

No. of suspects includes 166 homicide suspects who subsequently committed suicide. Rates cannot be computed for suspects because the number of suspects involved in an incident is not always known.

** Rates not reported when number of decedents is <20.

†† Includes persons of any race.


TABLE 26. Number,* percentage, and rate§ of deaths involving a homicide followed by a suicide, by victim's sex, race/ethnicity, age group, and marital status — National Violent Death Reporting System, 16 states, 2009

 Characteristic

Homicide

Suicide

No.

(%)

Rate

No.

(%)

Rate

Sex

Male

63

(27.5)

0.2

187

(94.0)

0.5

Female

166

(72.5)

0.4

12

(6.0)

—**

Total

229

(100.0)

0.3

199

(100.0)

0.2

Race/Ethnicity

White, non-Hispanic

148

(64.6)

0.3

124

(62.3)

0.2

Black, non-Hispanic

42

(18.3)

0.3

42

(21.1)

0.3

Asian/Pacific Islander

8

(3.5)

—**

6

(3.0)

—**

American Indian/Alaska Native

5

(2.2)

—**

3

(1.5)

—**

Hispanic††

24

(10.5)

0.3

23

(11.6)

0.3

Other

2

(0.9)

—**

1

(0.5)

—**

Total

229

(100.0)

0.3

199

(100.0)

0.2

Age group (yrs)

<1

1

(0.4)

—**

0

(0.0)

—**

1–4

7

(3.1)

—**

0

(0.0)

—**

5–9

7

(3.1)

—**

0

(0.0)

—**

10–14

4

(1.7)

—**

0

(0.0)

—**

15–19

13

(5.7)

—**

3

(1.5)

—**

20–24

20

(8.7)

0.3

14

(7.0)

—**

25–29

29

(12.7)

0.5

20

(10.1)

0.3

30–34

25

(10.9)

0.5

25

(12.6)

0.5

35–44

46

(20.1)

0.4

38

(19.1)

0.3

45–54

27

(11.8)

0.2

47

(23.6)

0.4

55–64

22

(9.6)

0.2

25

(12.6)

0.3

65–74

11

(4.8)

—**

10

(5.0)

—**

75–84

12

(5.2)

—**

10

(5.0)

—**

≥85

4

(1.7)

—**

7

(3.5)

—**

Unknown

1

(0.4)

—**


Total

229

(100.0)

0.3

199

(100.0)

0.2

Marital status§§ 

Married

94

(46.3)

¶¶

58

(29.1)

¶¶

Never married

54

(26.6)

¶¶

53

(26.6)

¶¶

Widowed

15

(7.4)

¶¶

48

(24.1)

¶¶

Divorced

36

(17.7)

¶¶

36

(18.1)

¶¶

Married, but separated

3

(1.5)

¶¶

1

(0.5)

¶¶

Single, not otherwise specified

0

(0.0)

¶¶

0

(0.0)

¶¶

Unknown

1

(0.5)

¶¶

3

(1.5)

¶¶

Total

203

(100.0)

¶¶

199

(100.0)

¶¶

* No. of incidents = 198. This number is one more than reported in Table 1 because one incident included in "other combinations of deaths" also involved a homicide followed by suicide.

Percentages might not total 100% because of rounding.

§ Per 100,000 population.

Alaska, Colorado, Georgia, Kentucky, Maryland, Massachusetts, North Carolina, New Jersey, New Mexico, Oklahoma, Oregon, Rhode Island, South Carolina, Utah, Virginia, and Wisconsin.

** Rates not reported when number of decedents is <20.

†† Includes persons of any race.

§§ Includes only decedents aged >18 years.

¶¶ Rates for marital status cannot be computed because denominators are unknown.


TABLE 27. Number and percentage* of homicides followed by suicide, by location in which injury occurred, and method used — National Violent Death Reporting System, 16 states, 2009

Characteristic

Decedent

Homicide

Suicide

No.

(%)

No.

(%)

Location

House

189

(82.5)

153

(76.9)

Street/Highway

6

(2.6)

12

(6.0)

Motor vehicle

5

(2.2)

2

(1.0)

Commercial/Retail Area

7

(3.1)

4

(2.0)

Industrial or construction area

2

(0.9)

0

(0.0)

Office building

3

(1.3)

2

(1.0)

Parking lot/Public garage

4

(1.7)

4

(2.0)

Park, playground, or sports/athletic area

1

(0.4)

2

(1.0)

Hospital or medical facility

1

(0.4)

1

(0.5)

Supervised residential facility

0

(0.0)

1

(0.5)

Natural area

8

(3.5)

10

(5.0)

Hotel/Motel

3

(1.3)

5

(2.5)

Other

0

(0.0)

2

(1.0)

Unknown

0

(0.0)

1

(0.5)

Total

229

(100.0)

199

(100.0)

Method

Firearm

201

(87.8)

179

(89.9)

Sharp instrument

13

(5.7)

7

(3.5)

Blunt instrument

4

(1.7)

0

(0.0)

Poisoning

2

(0.9)

3

(1.5)

Hanging/Strangulation/Suffocation

4

(1.7)

5

(2.5)

Drowning

3

(1.3)

1

(0.5)

Fire/Burns

1

(0.4)

3

(1.5)

Unknown

1

(0.4)

1

(0.5)

Total

229

(100.0)

199

(100.0)

* Percentages might not total 100% because of rounding.

Alaska, Colorado, Georgia, Kentucky, Maryland, Massachusetts, North Carolina, New Jersey, New Mexico, Oklahoma, Oregon, Rhode Island, South Carolina, Utah, Virginia, and Wisconsin.


TABLE 28. Number* and percentage of homicides followed by suicide, by toxicology variable — National Violent Death Reporting System, 16 states, 2009

Toxicology variable

Homicide victim

Suicide victim

Tested

Positive

Tested

Positive

No.

(%)

No.

(%)

No.

(%)

No.

(%)

BAC§

168

(73.4)

34

(20.2)

137

(68.8)

44

(32.1)

<0.08 g/dL§

— 

20

(58.8)

— 

12

(27.3)

≥0.08 g/dL§

— 

12

(35.3)

— 

32

(72.7)

Alcohol-positive, level unknown

— 

2

(5.9)

— 

0

(0.0)

Amphetamines

111

(48.5)

3

(2.7)

87

(43.7)

2

(2.3)

Antidepressants

84

(36.7)

12

(14.3)

63

(23.7)

6

(9.5)

Cocaine

111

(48.5)

3

(2.7)

87

(43.7)

3

(3.5)

Marijuana

72

(31.4)

6

(8.3)

58

(29.2)

5

(8.6)

Opiates

108

(47.2)

12

(11.1)

85

(42.7)

8

(9.4)

Other drug(s)

93

(40.6)

26

(28.0)

77

(38.7)

24

(31.2)

Abbreviation: BAC = blood alcohol concentration.

* N = 229 homicide victims and 199 suicide victims.

Alaska, Colorado, Georgia, Kentucky, Maryland, Massachusetts, North Carolina, New Jersey, New Mexico, Oklahoma, Oregon, Rhode Island, South Carolina, Utah, Virginia, and Wisconsin.

§ BAC ≥ 0.08 g/dL used as the standard for intoxication. Other substances indicated whether any results were positive; levels for these substances are not measured.


TABLE 29. Number* and percentage of homicide suspects who killed themselves after committing a homicide, by suicide circumstances — National Violent Death Reporting System, 16 states,§ 2009

Circumstance

No.

(%)

Mental health/Substance abuse

Current depressed mood

19

(10.4)

Current mental health problem

26

(14.2)

Current mental health treatment

17

(9.3)

Alcohol problem

15

(8.2)

Other substance abuse problem

11

(6.0)

Interpersonal

Intimate partner problem

129

(70.5)

Other relationship problem (nonintimate)

23

(12.6)

Suicide of family member or friend within past 5 years

1

(0.6)

Other death of family member or friend within past 5 years

13

(7.1)

Perpetrator of interpersonal violence within past month

104

(56.8)

Life stressor

Crisis in past or impending 2 weeks

134

(73.2)

Physical health problem

16

(8.7)

Job problem

8

(4.4)

Recent criminal legal problem

40

(21.9)

Noncriminal legal problem

5

(2.7)

Financial problem

19

(10.4)

Suicide event


Left a suicide note

34

(18.6)

Disclosed intent to commit suicide

22

(12.0)

History of suicide attempt(s)

5

(2.7)

* N = 183. Circumstances were unknown for 6 deaths.

Percentages might exceed 100% because multiple circumstances might have been coded.

§ Alaska, Colorado, Georgia, Kentucky, Maryland, Massachusetts, North Carolina, New Jersey, New Mexico, Oklahoma, Oregon, Rhode Island, South Carolina, Utah, Virginia, and Wisconsin.


TABLE 30. Number,* percentage, and rate§ of deaths related to violence by intimate partners, by victim's and suspect's sex, race/ethnicity, age group, and marital status — National Violent Death Reporting System, 16 states, 2009

Characteristic

Victim

Suspect**

No

(%)

Rate

No

(%)

Sex

Male

318

(47.4)

0.8

410

(80.2)

Female

353

(52.6)

0.9

84

(16.4)

Unknown


17

(3.3)

Total

671

(100.0)

0.8

511

(100.0)

Race/Ethnicity

White, non-Hispanic

392

(58.4)

0.7

222

(43.4)

Black, non-Hispanic

189

(28.2)

1.5

141

(27.6)

Asian/Pacific Islander

10

(1.5)

††

7

(1.4)

American Indian/Alaska Native

26

(3.9)

2.5

8

(1.6)

Hispanic§§

49

(7.3)

0.6

44

(8.6)

Other

5

(0.7)

††

85

(16.6)

Unknown

0

(0.0)

††

4

(0.8)

Total

671

(100.0)

0.8

511

(100.0)

Age group (yrs)

<1

5

(0.7)

††

0

(0.0)

1–4

9

(1.3)

††

0

(0.0)

5–9

6

(0.9)

††

0

(0.0)

10–14

4

(0.6)

††

1

(0.2)

15–19

26

(0.9)

0.5

13

(2.5)

20–24

67

(10.0)

1.2

54

(10.6)

25–29

75

(11.2)

1.3

45

(8.8)

30–34

89

(13.3)

1.7

66

(12.9)

35–44

169

(25.2)

1.5

90

(17.6)

45–54

121

(18.0)

1.0

81

(15.9)

55–64

56

(8.3)

1.0

31

(6.1)

65–74

25

(3.7)

0.5

12

(2.4)

75–84

13

(1.9)

††

8

(1.6)

≥85

5

(0.7)

††

5

(1.0)

Unknown

1

(0.1)

††

105

(20.6)

Total

671

(96.8)

0.8

511

(100.0)

Marital status¶¶

Married

263

(41.4)

—***

†††

†††

Never married

193

(30.3)

—***

†††

†††

Widowed

40

(6.3)

—***

†††

†††

Divorced

125

(19.7)

—***

†††

†††

Married, but separated

6

(0.9)

—***

†††

†††

Single, not otherwise specified

3

(0.5)

—***

†††

†††

Unknown

6

(0.9)

—***

†††

†††

Total

636

(100.0)

—***

†††

†††

* No. of incidents = 567.

Percentages might not total 100% because of rounding.

§ Per 100,000 population.

Alaska, Colorado, Georgia, Kentucky, Maryland, Massachusetts, North Carolina, New Jersey, New Mexico, Oklahoma, Oregon, Rhode Island, South Carolina, Utah, Virginia, and Wisconsin.

** Rates cannot be calculated for suspects because the number of suspects involved in an incident is not always known.

†† Rates not reported when number of decedents is <20.

§§ Includes persons of any race.

¶¶ Includes only decedents aged >18 years.

*** Rates for marital status cannot be computed because denominators are unknown.

††† Data not available.


TABLE 31. Number* and percentage of deaths by intimate partner violence, by toxicology variable — National Violent Death Reporting System, 16 states, 2009

Toxicology variable

Tested

Positive

No.

(%)

No.

(%)

BAC§

537

(80.0)

184

(34.3)

<0.08 g/dL§

— 

46

(25.0)

≥0.08 g/dL§

138

(75.0)

Amphetamines

384

(57.2)

13

(3.4)

Antidepressants

277

(41.3)

33

(11.9)

Cocaine

390

(58.1)

24

(6.2)

Marijuana

255

(38.0)

37

(14.5)

Opiates

383

(57.1)

40

(10.4)

Other drug(s)

337

(50.2)

98

(29.1)

Abbreviation: BAC = blood alcohol concentration.

* N = 671.

Alaska, Colorado, Georgia, Kentucky, Maryland, Massachusetts, North Carolina, New Jersey, New Mexico, Oklahoma, Oregon, Rhode Island, South Carolina, Utah, Virginia, and Wisconsin.

§ BAC ≥0.08 g/dL used as the standard for intoxication. Other substances indicated whether any results were positive; levels for these substances are not measured.


TABLE 32. Number and percentage* of suicides among former or current military personnel, by sex, race/ethnicity, age group, marital status, and method used — National Violent Death Reporting System, 16 states, 2009

Characteristic

No.

(%)

Sex of victim

Male

1,806

(96.3)

Female

70

(3.7)

Total

1,876

(100.0)

Race/Ethnicity

White, non-Hispanic

1,695

(90.4)

Black, non-Hispanic

112

(6.0)

Asian/Pacific Islander

9

(0.5)

American Indian/Alaska Native

12

(0.6)

Hispanic§

47

(2.5)

Other

1

(0.1)

Total

1,876

(100.0)

Age group (yrs) of victim

<19

7

(0.4)

20–24

60

(3.2)

25–29

88

(4.7)

30–34

73

(3.9)

35–44

229

(12.2)

45–54

317

(16.9)

55–64

431

(23.0)

65–74

276

(14.7)

75–84

274

(14.6)

≥85

121

(6.4)

Total

1,876

(100.0)

Marital status

Married

877

(46.7)

Never married

286

(15.2)

Widowed

196

(10.4)

Divorced

452

(24.1)

Married, but separated

10

(0.5)

Single, not otherwise specified

6

(0.3)

Unknown

49

(2.6)

Total

1,876

(100.0)

Method

Firearm

1,298

(69.2)

Sharp instrument

33

(1.8)

Blunt instrument

2

(0.1)

Poisoning

218

(11.6)

Hanging/Strangulation/Suffocation

268

(14.3)

Fall

16

(0.9)

Drowning

7

(0.4)

Fire/Burns

5

(0.3)

Motor vehicle

13

(0.7)

Other (single method)

4

(0.2)

Unknown

12

(0.6)

Total

1,876

(100.0)

* Percentages might not total 100% because of rounding.

Alaska, Colorado, Georgia, Kentucky, Maryland, Massachusetts, North Carolina, New Jersey, New Mexico, Oklahoma, Oregon, Rhode Island, South Carolina, Utah, Virginia, and Wisconsin.

§ Includes persons of any race.

Includes only decedents aged >18 years.


TABLE 33. Number* and percentage of suicides by former or current military personnel, by toxicology variable — National Violent Death Reporting System, 16 states, 2009

Toxicology variable

Tested

Positive

No.

(%)

No.

(%)

BAC§

1,193

(63.6)

357

(29.9)

<0.08 g/dL§

— 

115

(32.2)

≥0.08 g/dL§

232

(65.0)

Alcohol-positive, level unknown

— 

10

(2.8)

Amphetamines

756

(40.3)

17

(2.3)

Antidepressants

649

(34.6)

127

(19.6)

Cocaine

767

(40.9)

26

(3.4)

Marijuana

577

(30.8)

34

(5.9)

Opiates

775

(41.3)

123

(15.9)

Other drug(s)

781

(41.6)

299

(38.3)

Abbreviation: BAC = blood alcohol concentration.

* N = 1,876.

Alaska, Colorado, Georgia, Kentucky, Maryland, Massachusetts, North Carolina, New Jersey, New Mexico, Oklahoma, Oregon, Rhode Island, South Carolina, Utah, Virginia, and Wisconsin.

§ BAC ≥0.08 g/dL used as the standard for intoxication. Other substances indicated whether any results were positive; levels for these substances are not measured.


TABLE 34. Number* and percentage of suicides among former or current military personnel, by precipitating circumstances — National Violent Death Reporting System, 16 states,§ 2009

Circumstance

No.

(%)

Mental health/Substance abuse

Current depressed mood

702

(41.5)

Current mental health problem

669

(39.6)

Current mental health treatment

440

(26.0)

Alcohol problem

268

(15.9)

Other substance abuse problem

126

(7.5)

Interpersonal

Intimate partner problem

462

(27.3)

Other relationship problem (nonintimate)

139

(8.2)

Suicide of family member or friend within past 5 years

31

(1.8)

Other death of family member or friend within past 5 years

137

(8.1)

Perpetrator of interpersonal violence within past month

70

(4.1)

Victim of interpersonal violence within past month

3

(0.2)

Life stressor

Crisis in past or impending 2 weeks

455

(26.9)

Physical health problem

602

(35.6)

Job problem

233

(13.8)

Recent criminal legal problem

145

(8.6)

Noncriminal legal problem

55

(3.3)

Financial problem

211

(12.5)

School problem

2

(0.1)

Suicide event

Left a suicide note

599

(35.4)

Disclosed intent to commit suicide

498

(29.5)

History of suicide attempt(s)

227

(13.4)

* N = 1,690. Circumstances were unknown for 186 deaths.

Percentages might exceed 100% because multiple circumstances might have been coded.

§ Alaska, Colorado, Georgia, Kentucky, Maryland, Massachusetts, North Carolina, New Jersey, New Mexico, Oklahoma, Oregon, Rhode Island, South Carolina, Utah, Virginia, and Wisconsin.


TABLE 35. Number* and percentage of deaths caused by legal intervention, by victim's race/ethnicity, marital status, and location where injury occurred — National Violent Death Reporting System, 16 states,§ 2009

Characteristic

No.

(%)

Race/Ethnicity

White, non-Hispanic

74

(56.9)

Black, non-Hispanic

38

(29.2)

Asian/Pacific Islander

0

(0.0)

American Indian/Alaska Native

5

(3.8)

Hispanic

13

(10.0)

Total

130

(100.0)

Marital status**

Married

37

(28.5)

Never married

59

(45.4)

Widowed

2

(1.5)

Divorced

31

(23.8)

Married, but separated

1

(0.8)

Single, not otherwise specified

0

(0.0)

Total

130

(100.0)

Location of injury

House

58

(44.6)

Street/Highway

38

(29.2)

Motor vehicle

10

(7.7)

Commercial/Retail area

3

(2.3)

Parking lot/Public garage

2

(1.5)

Park, playground, or sports/athletic area

1

(0.8)

Hospital or medical facility

1

(0.8)

Jail/Prison

3

(2.3)

Natural area

5

(3.8)

Hotel/Motel

1

(0.8)

Other

8

(6.2)

Total

130

(100.0)

* No. of incidents = 127; no. of victim decedents = 125; no. of suspect decedents = 5. Number of incidents is seven more than the number provided in Table 1. Five of the "other combinations of death" included at least one legal intervention death.

Percentages might not total 100% because of rounding.

§ Alaska, Colorado, Georgia, Kentucky, Maryland, Massachusetts, North Carolina, New Jersey, New Mexico, Oklahoma, Oregon, Rhode Island, South Carolina, Utah, Virginia, and Wisconsin.

Includes persons of any race.

** Includes only victims aged >18 years.


TABLE 36. Number and percentage* of deaths caused by legal intervention, by sex and age group — National Violent Death Reporting System, 16 states, 2009

Characteristic

Male

Female

Total

No.

(%)

No.

(%)

No.

(%)

Age group (yrs)

<1

0

(0.0)

0

(0.0)

0

(0.0)

1–4

0

(0.0)

0

(0.0)

0

(0.0)

5–9

0

(0.0)

0

(0.0)

0

(0.0)

10–14

0

(0.0)

0

(0.0)

0

(0.0)

15–19

5

(4.1)

0

(0.0)

5

(3.8)

20–24

16

(13.0)

0

(0.0)

16

(12.3)

25–29

15

(12.2)

1

(14.3)

16

(12.3)

30–34

19

(15.4)

0

(0.0)

19

(14.6)

35–44

29

(23.6)

1

(14.3)

30

(23.1)

45–54

22

(17.9)

2

(28.6)

24

(18.5)

55–64

12

(9.8)

2

(28.6)

14

(10.8)

65–74

4

(3.3)

1

(14.3)

5

(3.8)

75–84

1

(0.8)

0

(0.0)

1

(0.8)

≥85

0

(0.0)

0

(0.0)

0

(0.0)

Total

123

(100.0)

7

(100.0)

130

(100.0)

* Percentages might not total 100% because of rounding.

Alaska, Colorado, Georgia, Kentucky, Maryland, Massachusetts, North Carolina, New Jersey, New Mexico, Oklahoma, Oregon, Rhode Island, South Carolina, Utah, Virginia, and Wisconsin.


TABLE 37. Number* and percentage of deaths caused by legal intervention, by toxicology variable — National Violent Death Reporting System, 16 states, 2009

Toxicology variable

Tested

Positive

No.

(%)

No.

(%)

BAC§

120

(92.3)

49

(40.1)

<0.08 g/dL§

9

(18.4)

≥0.08 g/dL§

 —

39

(79.6)

Unknown

1

(2.0)

Amphetamines

99

(76.2)

4

(4.0)

Antidepressants

71

(54.6)

11

(15.5)

Cocaine

104

(80.0)

11

(10.6)

Marijuana

62

(47.7)

11

(17.7)

Opiates

102

(78.5)

11

(10.8)

Other drug(s)

87

(66.9)

26

(29.9)

Abbreviation: BAC = blood alcohol concentration.

* N = 130.

Alaska, Colorado, Georgia, Kentucky, Maryland, Massachusetts, North Carolina, New Jersey, New Mexico, Oklahoma, Oregon, Rhode Island, South Carolina, Utah, Virginia, and Wisconsin.

§ BAC ≥0.08 g/dL used as the standard for intoxication. Other substances indicated whether any results were positive; levels for these substances are not measured.


TABLE 38. Number,* percentage, and rate§ of suicides among persons aged > 60 years, by age group, sex, race/ethnicity, marital status, location in which injury occurred and method — National Violent Death Reporting System, 16 states, 2009

Characteristic

Age group (yrs)

Total

60–69

70–79

≥80

No.

(%)

Rate

No.

(%)

Rate

No.

(%)

Rate

No.

(%)

Rate

Sex

Male

815

(78.4)

23.3

497

(83.4)

26.8

348

(87.4)

35.6

1,660

(81.6)

26.2

Female

225

(21.6)

5.8

99

(16.6)

4.2

50

(12.6)

2.7

374

(18.4)

4.6

Total

1,040

(100.0)

14.1

596

(100.0)

14.2

398

(100.0)

14.1

2,034

(100.0)

14.1

Race/Ethnicity

White, non-Hispanic

960

(92.3)

23.1

560

(94.0)

16.3

376

(94.5)

15.6

1,896

(93.2)

16.1

Black, non-Hispanic

40

(3.8)

4.7

18

(3.0)

—**

8

(2.0)

—**

66

(3.2)

4.2

Asian/Pacific Islander

15

(1.4)

—**

7

(1.2)

—**

7

(1.8)

—**

29

(1.4)

8.4

American Indian/Alaska Native

6

(0.6)

—**

0

(0.0)

—**

1

(0.3)

—**

7

(0.3)

—**

Hispanic††

18

(1.7)

—**

11

(1.8)

—**

6

(1.5)

—**

35

(1.7)

5.8

Other

1

(0.1)

—**

0

(0.0)

—**

0

(0.0)

—**

1

(0.0)

—**

Total

1,040

(100.0)

14.1

596

(100.0)

14.2

398

(100.0)

14.1

2,034

(100.0)

14.1

Marital status

Married

518

(49.8)

§§

307

(51.5)

§§

155

(38.9)

§§

980

(48.2)

§§

Never married

87

(8.4)

§§

31

(5.2)

§§

17

(4.3)

§§

135

(6.6)

§§

Widowed

97

(9.3)

§§

126

(21.1)

§§

182

(45.7)

§§

405

(19.9)

§§

Divorced

298

(28.7)

§§

119

(20.0)

§§

33

(8.3)

§§

450

(22.1)

§§

Married, but separated

2

(0.2)

§§

0

(0.0)

§§

1

(0.3)

§§

3

(0.1)

§§

Single, not otherwise specified

5

(0.5)

§§

1

(0.2)

§§

0

(0.0)

§§

6

(0.3)

§§

Unknown

33

(3.2)

§§

12

(2.0)

§§

10

(2.5)

§§

55

(2.7)

§§

Total

1,040

(100.0)

§§

596

(100.0)

§§

398

(100.0)

§§

2,034

(100.0)

§§

Location

House

844

(81.2)

11.4

513

(86.1)

12.2

362

(91.0)

12.9

1,719

(84.5)

11.9

Street/Highway

26

(2.5)

0.4

7

(1.2)

—**

2

(0.5)

—**

35

(1.7)

0.2

Motor vehicle

25

(2.4)

0.3

12

(2.0)

—**

3

(0.8)

—**

40

(2.0)

0.3

Bar/Nightclub

0

(0.0)

—**

0

(0.0)

—**

0

(0.0)

—**

0

(0.0)

—**

Commercial/Retail area

11

(1.1)

—**

2

(0.3)

—**

0

(0.0)

—**

13

(0.6)

—**

Industrial or construction area

3

(0.3)

—**

2

(0.3)

—**

1

(0.3)

—**

6

(0.3)

—**

Office building

5

(0.5)

—**

1

(0.2)

—**

0

(0.0)

—**

6

(0.3)

—**

Parking lot/Public garage

8

(0.8)

—**

5

(0.8)

—**

4

(1.0)

—**

17

(0.8)

—**

Abandoned house, building, or warehouse

0

(0.0)

—**

1

(0.2)

—**

0

(0.0)

—**

1

(0.0)

—**

Park, playground, or sports/athletic area

11

(1.1)

—**

10

(1.7)

—**

1

(0.3)

—**

22

(1.1)

0.2

Preschool/School/College/School bus

1

(0.1)

—**

0

(0.0)

—**

0

(0.0)

—**

1

(0.0)

—**

Public transportation/Station/Railroad tracks

1

(0.1)

—**

1

(0.2)

—**

0

(0.0)

—**

2

(0.1)

—**

Hospital or medical facility

8

(0.8)

—**

3

(0.5)

—**

3

(0.8)

—**

14

(0.7)

—**

Supervised residential facility

2

(0.2)

—**

1

(0.2)

—**

7

(1.8)

—**

10

(0.5)

—**

Jail/Prison

1

(0.1)

—**

0

(0.0)

—**

0

(0.0)

—**

1

(0.0)

—**

Farm

7

(0.7)

—**

1

(0.2)

—**

2

(0.5)

—**

10

(0.5)

—**

Natural area

34

(3.3)

0.5

16

(2.7)

—**

6

(1.5)

—**

56

(2.8)

0.4

Hotel/Motel

15

(1.4)

—**

5

(0.8)

—**

0

(0.0)

—**

20

(1.0)

0.1

Other

27

(2.6)

0.4

7

(1.2)

—**

1

(0.3)

—**

35

(1.7)

0.2

Unknown

11

(1.1)

—**

9

(1.5)

—**

6

(1.5)

—**

26

(1.3)

0.2

Total

1,040

(100.0)

14.1

596

(100.0)

14.2

398

(100.0)

14.1

2,034

(100.0)

14.1

See table footnotes on page 43.


TABLE 38. (Continued) Number,* percentage, and rate§ of suicides among persons aged > 60 years, by age group, sex, race/ethnicity, marital status, location in which injury occurred and method — National Violent Death Reporting System, 16 states, 2009

Characteristic

Age group (yrs)

Total

60–69

70–79

≥80

No.

%

Rate

No.

%

Rate

No.

%

Rate

No.

%

Rate

Method

Firearm

669

(64.3)

9.1

454

(76.2)

10.8

306

(76.9)

10.9

1,429

(70.3)

9.9

Sharp instrument

16

(1.5)

—**

11

(1.8)

—**

4

(1.0)

—**

31

(1.5)

0.2

Blunt instrument

1

(0.1)

—**

0

(0.0)

—**

1

(0.3)

—**

2

(0.1)

—**

Poisoning

191

(18.4)

2.6

66

(11.1)

10.6

37

(9.3)

1.3

294

(14.5)

2.0

Hanging/Strangulation/Suffocation

120

(11.5)

1.6

56

(9.4)

1.3

40

(10.1)

1.4

216

(10.6)

1.5

Fall

14

(1.3)

—**

3

(0.5)

—**

4

(1.0)

—**

21

(1.0)

0.1

Drowning

13

(1.3)

—**

3

(0.5)

—**

3

(0.8)

—**

19

(0.9)

—**

Fire/Burns

1

(0.1)

—**

0

(0.0)

—**

0

(0.0)

—**

1

(0.0)

—**

Motor vehicle

6

(0.6)

—**

3

(0.5)

—**

1

(0.3)

—**

10

(0.5)

—**

Other (single method)

3

(0.3)

—**

0

(0.0)

—**

0

(0.0)

—**

3

(0.1)

—**

Unknown

6

(0.6)

—**

0

(0.0)

—**

2

(0.5)

—**

8

(0.4)

—**

Total

1,040

(100.0)

14.1

596

(100.0)

14.2

398

(100.0)

14.1

2,034

(100.0)

14.1

* No. of incidents = 2,029; no. of decedents = 2,034.

Percentages might not total 100% because of rounding.

§ Per 100,000 population.

Alaska, Colorado, Georgia, Kentucky, Maryland, Massachusetts, North Carolina, New Jersey, New Mexico, Oklahoma, Oregon, Rhode Island, South Carolina, Utah, Virginia, and Wisconsin.

** Rates not reported when number of decedents is <20.

†† Includes persons of any race.

§§ Rates for marital status cannot be computed because denominators are unknown.


TABLE 39. Number* and percentage of suicides among persons aged >60 years, by age group and precipitating circumstances — National Violent Death Reporting System, 16 states,§ 2009

Circumstance

Age group (yrs)

Total

60–69

70–79

≥80

No.

(%)

No.

(%)

No.

(%)

No.

(%)

Mental health/Substance abuse

Current depressed mood

384

(36.9)

235

(39.4)

142

(35.7)

761

(37.4)

Current mental health problem

421

(40.5)

200

(33.6)

95

(23.9)

716

(35.2)

Current mental health treatment

311

(29.9)

138

(23.2)

57

(14.3)

506

(24.9)

Alcohol problem

116

(11.2)

44

(7.4)

5

(1.3)

165

(8.1)

Other substance abuse problem

46

(4.4)

11

(1.8)

2

(0.5)

59

(2.9)

Interpersonal 

Intimate partner problem

152

(14.6)

54

(9.1)

17

(4.3)

223

(11.0)

Other relationship problem (nonintimate)

60

(5.8)

28

(4.7)

11

(2.8)

99

(4.9)

Suicide of family member or friend within past 5 years

9

(0.9)

9

(1.5)

2

(0.5)

20

(1.0)

Other death of family member or friend within past 5 years

74

(7.1)

57

(9.6)

50

(12.6)

181

(8.9)

Perpetrator of interpersonal violence within past month

21

(2.0)

10

(1.7)

3

(0.8)

34

(1.7)

Victim of interpersonal violence within past month

0

(0.0)

1

(0.2)

0

(0.0)

1

(0.0)

Life stressor 

Crisis in past or impending 2 weeks

194

(18.7)

125

(21.0)

70

(17.6)

389

(19.1)

Physical health problem

394

(37.9)

303

(50.8)

242

(60.8)

939

(46.2)

Job problem

79

(7.6)

13

(2.2)

2

(0.5)

94

(4.6)

Recent criminal legal problem

47

(4.5)

16

(2.7)

5

(1.3)

68

(3.3)

Noncriminal legal problem

19

(1.8)

4

(0.7)

0

(0.0)

23

(1.1)

Financial problem

122

(11.7)

39

(6.5)

10

(2.5)

171

(8.4)

Suicide event 

Left a suicide note

321

(30.9)

171

(28.7)

132

(33.2)

624

(30.7)

Disclosed intent to commit suicide

232

(22.3)

136

(22.8)

108

(27.1)

476

(23.4)

History of suicide attempt(s)

133

(12.8)

54

(9.1)

19

(4.8)

206

(10.1)

* N = 1,774. Circumstances were unknown for 260 deaths.

Percentages might exceed 100% because multiple circumstances might have been coded.

§ Alaska, Colorado, Georgia, Kentucky, Maryland, Massachusetts, North Carolina, New Jersey, New Mexico, Oklahoma, Oregon, Rhode Island, South Carolina, Utah, Virginia, and Wisconsin.


Use of trade names and commercial sources is for identification only and does not imply endorsement by the U.S. Department of Health and Human Services.

References to non-CDC sites on the Internet are provided as a service to MMWR readers and do not constitute or imply endorsement of these organizations or their programs by CDC or the U.S. Department of Health and Human Services. CDC is not responsible for the content of pages found at these sites. URL addresses listed in MMWR were current as of the date of publication.


All MMWR HTML versions of articles are electronic conversions from typeset documents. This conversion might result in character translation or format errors in the HTML version. Users are referred to the electronic PDF version (http://www.cdc.gov/mmwr) and/or the original MMWR paper copy for printable versions of official text, figures, and tables. An original paper copy of this issue can be obtained from the Superintendent of Documents, U.S. Government Printing Office (GPO), Washington, DC 20402-9371; telephone: (202) 512-1800. Contact GPO for current prices.

**Questions or messages regarding errors in formatting should be addressed to mmwrq@cdc.gov.

 
USA.gov: The U.S. Government's Official Web PortalDepartment of Health and Human Services
Centers for Disease Control and Prevention   1600 Clifton Road Atlanta, GA 30329-4027, USA
800-CDC-INFO (800-232-4636) TTY: (888) 232-6348 - Contact CDC–INFO
A-Z Index
  1. A
  2. B
  3. C
  4. D
  5. E
  6. F
  7. G
  8. H
  9. I
  10. J
  11. K
  12. L
  13. M
  14. N
  15. O
  16. P
  17. Q
  18. R
  19. S
  20. T
  21. U
  22. V
  23. W
  24. X
  25. Y
  26. Z
  27. #