 |
|
|
|
|
|
|
| ||||||||||
|
|
|
|
|
|
|
||||
| ||||||||||
|
|
|
|
|
Persons using assistive technology might not be able to fully access information in this file. For assistance, please send e-mail to: mmwrq@cdc.gov. Type 508 Accommodation and the title of the report in the subject line of e-mail. Surveillance for Violent Deaths --- National Violent Death Reporting System, 16 States, 2006Debra L. Karch, PhD1
AbstractProblem/Condition: An estimated 50,000 persons die annually in the United States as a result of violence-related injuries. This report summarizes data from CDC's National Violent Death Reporting System (NVDRS) regarding violent deaths from 16 U.S. states for 2006. Results are reported by sex, age group, race/ethnicity, marital status, location of injury, method of injury, circumstances of injury, and other selected characteristics. Reporting Period Covered: 2006. Description of System: NVDRS collects data regarding violent deaths obtained from death certificates, coroner/medical examiner reports, and law enforcement reports. NVDRS began operation in 2003 with seven states (Alaska, Maryland, Massachusetts, New Jersey, Oregon, South Carolina, and Virginia) participating; six states (Colorado, Georgia, North Carolina, Oklahoma, Rhode Island, and Wisconsin) joined in 2004 and four (California, Kentucky, New Mexico, and Utah) in 2005, for a total of 17 states. This report includes data from 16 states that collected statewide data; data from California are not included in this report because NVDRS has been implemented only in a limited number of California cities and counties rather than statewide. Results: For 2006, a total of 15,007 fatal incidents involving 15,395 violent deaths occurred in the 16 NVDRS states included in this report. The majority (55.9%) of deaths were suicides, followed by homicides and deaths involving legal intervention (e.g. a suspect is killed by a law enforcement officer in the line of duty)(28.2%), violent deaths of undetermined intent (15.1%), and unintentional firearm deaths (0.7%). Suicides occurred at higher rates among males, American Indians/Alaska Natives (AI/ANs), non-Hispanic whites, and persons aged 45--54 years and occurred most often in a house or apartment and involved the use of firearms. Suicides were precipitated primarily by mental-health, intimate-partner, or physical-health problems or by a crisis during the preceding 2 weeks. Homicides occurred at higher rates among males and persons aged 20--24 years; rates were highest among non-Hispanic black males. The majority of homicides involved the use of a firearm and occurred in a house or apartment or on a street/highway. Homicides were precipitated primarily by arguments and interpersonal conflicts or in conjunction with another crime. Other manners of death and special situations or populations also are highlighted in this report. Interpretation: This report provides a detailed summary of data concerning violent deaths collected by NVDRS for 2006. The results indicate that violent deaths resulting from self-inflicted or interpersonal violence affected adults aged 20--54 years, males, and certain minority populations disproportionately. For many types of violent death, relationship problems, interpersonal conflicts, mental-health problems, and recent crises were among the primary precipitating factors. Because additional information might be reported subsequently as participating states update their findings, the data provided in this report are preliminary. Public Health Action: For the occurrence of violent deaths in the United States to be better understood and ultimately prevented, accurate, timely, and comprehensive surveillance data are necessary. NVDRS data can be used to track the occurrence of violence-related fatal injuries and assist public health authorities in the development, implementation, and evaluation of programs and policies to reduce and prevent violent deaths at the national, state, and local levels. The continued development and expansion of NVDRS is essential to CDC's efforts to reduce the personal, familial, and societal costs of violence. Further efforts are needed to increase the number of states participating in NVDRS, with an ultimate goal of full national representation. IntroductionAn estimated 50,000 persons die annually in the United States as a result of violence-related injuries. Homicide is the second leading cause of death for persons aged 15--24 years, the third leading cause for persons aged 25--34 years, and the fourth for persons aged 1--14 years. Suicide is the second leading cause of death for persons aged 25--34 years and the third leading cause for persons aged 10--24 years. Only unintentional injury, malignant neoplasms, and congenital anomalies were more common (1). Public health authorities require accurate, timely, and comprehensive surveillance data to better understand and ultimately prevent the occurrence of violent deaths in the United States (2). In 2000, CDC started planning for the implementation of the National Violent Death Reporting System (NVDRS) (3,4). The goals of this system are to:
NVDRS is a state-based active surveillance system that collects risk-factor data concerning all violence-related deaths, including homicides, suicides, unintentional firearm deaths, legal-intervention deaths (i.e., deaths caused by police and other persons with legal authority to use deadly force, excluding legal executions), and deaths of undetermined intent. NVDRS data are used to assist the development, implementation, and evaluation of programs and policies designed to reduce and prevent violent deaths and injuries at the national, state, and local levels. Before implementation of NVDRS, single data sources (e.g., death certificates or supplemental homicide reports) provided only limited information and few circumstances from which to understand patterns of violent death. NVDRS fills this gap in national surveillance; it is the first system to provide detailed information on circumstances precipitating violent deaths, the first to link multiple source documents to enable researchers to understand each violent death better, and the first to link multiple violent deaths that are related to one another (e.g., multiple homicides, suicide pacts, and cases of homicide followed by the suicide of the suspected perpetrator). NVDRS began operation in 2003 with seven states (Alaska, Maryland, Massachusetts, New Jersey, Oregon, South Carolina, and Virginia) participating; six states (Colorado, Georgia, North Carolina, Oklahoma, Rhode Island, and Wisconsin) joined in 2004 and four more (California, Kentucky, New Mexico, and Utah) in 2005, for a total of 17 states (Figure). CDC provides funding for state participation. CDC anticipates that NVDRS will expand to include all 50 states, the District of Columbia, and U.S. territories. This report summarizes data for 2006 concerning violent deaths from 16 states that collected statewide data (approximately 26% of the U.S. population). Data from California are not included in this report because NVDRS has not been implemented statewide in California as it has in the other 16 states providing data. Because additional information might be reported subsequently as participating states update their findings, the data provided in this report are preliminary. Annual updates of NVDRS data also are available through a web-based query system (WISQARS) at http://wisqars.cdc.gov:8080/nvdrs/nvdrsDisplay.jsp. MethodsNVDRS uses multiple, complementary data sources, including death certificates, coroner/medical examiner (CME) records, and law enforcement reports. Secondary sources used by certain participating states include child fatality review team data; supplementary homicide reports; hospital data; crime laboratory data; and Bureau of Alcohol, Tobacco, Firearms, and Explosives trace information concerning firearms. NVDRS links together multiple documents for each violent death and also links multiple deaths that are related to each other (e.g., multiple homicides, a homicide followed by a suicide, or multiple suicides) into a single incident. The ability to analyze data linked in this way permits a comprehensive assessment of violent deaths. NVDRS defines a violent death as a death resulting from the intentional use of physical force or power against oneself, another person, or a group or community. In addition, NVDRS collects information regarding unintentional firearm injury deaths (i.e., deaths resulting from incidents in which the person causing the injury did not intend to discharge the firearm). NVDRS case definitions are coded on the basis of the International Classification of Diseases, Tenth Revision (ICD-10) (5). Cases with selected ICD-10 codes are included in NVDRS (Box 1). ICD-10 case finding is completed by participating states. Variables analyzed in NVDRS include the following:
NVDRS is incident-based, and all decedents (both victims and alleged perpetrators [suspects]) associated with a given incident are grouped in one record. Decisions about whether two or more deaths are associated with the same incident are made on the basis of the timing of the injuries rather than on that of the deaths. Examples of a violent death incident include 1) a single isolated violent death, 2) two or more related homicides (including legal interventions) when the fatal injuries were inflicted <24 hours apart, 3) two or more related suicides or deaths of undetermined intent when the fatal injuries were inflicted <24 hours apart, and 4) a homicide followed by a related suicide when both fatal injuries were inflicted <24 hours apart. Data are obtained from individual information sources and entered into source-specific computerized data entry screens (e.g., police report data are entered into police report screens and death certificate data into death certificate screens). In addition to allowing independent entry of each source, this approach permits later review of what each source contributed and identification of missing sources. This permits comparisons of the quality and completeness of state-specific data sources and allows states to provide feedback to sources regarding the consistency of their data compared with data from other sources. In addition, the system permits automatic electronic importation of specific data sources without requiring manual entry. Abstraction of identical variables across multiple source documents can result in data inconsistencies, which NVDRS resolves by assigning a primacy (i.e., hierarchical) rule for each variable. The primacy rules are applied to create a final analysis data set that uses data from all available sources. For each variable in NVDRS, primacy is established on the basis of a hierarchy of assumed reliability of all the sources for a single variable. For example, sex is collected in all three required documents (death certificate, CME record, and police report). The primacy for sex is expressed as death certificate/CME record/police report, meaning the analysis file is constructed using the sex recorded in the death certificate; if this is left blank or is unknown, the sex recorded in the CME record is used; and, if the CME record does not provide the sex or lists the sex as unknown, the police report is used. Manner of DeathA manner (i.e., intent) of death for each decedent is assigned by a trained abstractor who takes into account information from all source documents. Typically, these documents are consistent regarding the manner of death, and the abstractor-assigned manner of death corresponds to that reported in all the source documents. On rare occasions, when a discrepancy exists among the source documents, the abstractor must assign a manner of death on the basis of the preponderance of evidence in the source documents. For example, if two sources classify a death as a suicide and a third classifies it as undetermined, the death will be coded as a suicide. NVDRS classifies data using one of five abstractor-assigned manners of death:
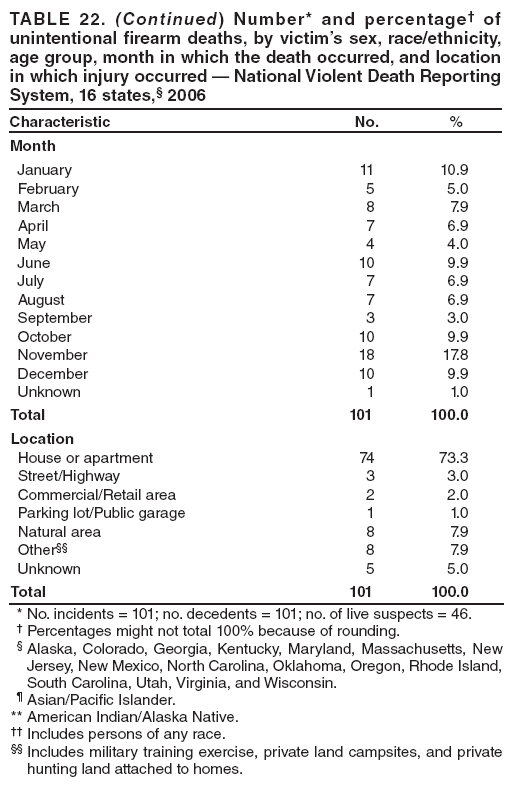
Variables AnalyzedNVDRS collects approximately 250 unique variables (available at http://www.cdc.gov/ncipc/profiles/nvdrs/default.htm); the number of variables recorded for each incident depends on the content and completeness of the source documents. Variables include manner of death, demographics, ICD-10 and underlying cause-of-death codes and text, location and date/time of injury and death, toxicology results, bodily injuries, precipitating circumstances, decedent-suspect relationship, and method of injury (Boxes 2 and 3). Comparability of 2005 and 2006 NVDRS Surveillance Summary DataFour changes were made to how variables were reported between 2005 and 2006 that affect their comparability. Those changes involve race/ethnicity, location of injury, relationship of victim to suspect, and method of injury. In 2005, the race variable was reported in six categories (white, black, Asian Pacific Islander (API), AI/AN, other, and unknown). Ethnicity was categorized separately as persons of any race that reported Hispanic origin. When this methodology was used, Hispanics were reported both within their race category and then again separately by ethnicity. The 2006 methodology classifies each person as non-Hispanic white, non-Hispanic black, API, AI/AN, Hispanic, other, and unknown. Race and ethnicity are combined in one variable. This change allows for better comparability with other violence-related data. Location of injury is coded from a list of 31 location options in NVDRS. Because certain options are selected rarely, certain response categories have been combined. In 2006, the category "bank" was included in "office building" rather than in "commercial/retail area" as it was in 2005. Also in 2006, the category "synagogue/church/temple" was subsumed under "other" and not reported seperately as in 2005. Relationship of the victim to the suspect includes a new category, "other intimate-partner involvement," to refer to a death that is intimate-partner--related but that does not occur between the intimate partners themselves (e.g., when a child is killed by a parent's partner). In addition, the categories "rival gang member" and "victim was injured by a law enforcement officer" are reported in 2006 as separate categories; in 2005, these categories were included in "other specified relationship." The categories "foster child" and "foster parent" also were moved from "other relative" to "child" and "parent," respectively. Four new categories were added to method of injury: "firearm and poisoning," "firearm and other method type," "poisoning and other method type," and "other combination of methods." All deaths in these new categories involved more than one method, and the evidence did not indicate which method caused the fatal injury. For example, a homicide victim might have injuries from both a firearm and a sharp instrument, but the method that actually caused the fatal injury might be unclear. In this case, the method of injury would be categorized as "firearm and other method." Circumstances Preceding DeathThe circumstances preceding death are defined as the precipitating events that led to the infliction of a fatal injury (Box 3). The circumstances that preceded a fatal injury are reported on the basis of the content of the CME record and police reports. Different sets of circumstances are coded for suicide/undetermined deaths, homicide/legal-intervention deaths, and unintentional firearm deaths. The variable "circumstances known" is a gateway variable to a list of potential circumstances. Each incident requires the data abstractor to code all circumstances in cases for which the circumstances are known. If circumstances are not known (e.g., for a body found in the woods with no other information available), the data abstractor leaves the gateway variable blank, and these cases are excluded from the denominator for circumstance values. If either the CME record or the police report indicates that the circumstance is reported to be true, then the abstractor enters data as confirmed (e.g., if the police report indicated that a decedent had disclosed an intent to commit suicide, then suicidal intent is accepted to be true). Coding Training and Quality ControlCoding training is held annually for all participating states. Ongoing coding support is provided through an e-mail help desk, monthly conference calls with all states, and regular conference calls with individual states. A coding manual is provided. Software features enhance coding reliability, including automated validation rules and a hover-over feature containing variable-specific information. Details regarding NVDRS procedures and coding are available at http://www.cdc.gov/ncipc/profiles/nvdrs/publications.htm. States are requested to perform blind reabstraction of cases using multiple abstractors to identify inconsistencies. CDC also runs a quality-control analysis in which multiple variables are reviewed for their appropriateness, with special focus on abstractor-assigned variables such as method selection and manner of death. If CDC questions any variable, CDC notifies the state and asks for a response or correction. Time FrameStates are required to report all deaths within 6 months of the end of each calendar year for the preceding January--December time frame. States then have an additional 12 months to complete each incident record. Although states typically meet these timelines, additional details sometimes arrive after a deadline has passed. New incidents also might be identified after the deadline (e.g., if a death certificate is revised, new evidence is obtained that changes a manner of death, or a miscoded ICD-10 is corrected to meet NVDRS inclusion criteria). These additional data are incorporated into NVDRS. Analysis files are updated monthly at CDC. On the basis of previous experience, CDC estimates that case counts might increase 1%--2% after the initial 18-month data collection period. Fatal Violent Injuries During 2006This report provides preliminary data concerning fatal violent injuries in 2006 for 16 participating states that were received by CDC as of July 31, 2008. Data from California were not included in this report because NVDRS was implemented only in a limited number of cities and counties rather than statewide. Participating states used vital statistics death certificate files to identify violent deaths meeting NVDRS case definitions. Each state reported all violent deaths of their residents that occurred within the state and deaths of state residents that occurred elsewhere. Once a death was identified, NVDRS data abstractors linked source documents, linked violent deaths within each incident, coded data elements, and wrote a short narrative of the incident. These narratives were reviewed for all incidents in which coded data were unclear or incomplete. State-level data then were consolidated and analyzed for this aggregate report. Numbers, percentages, and crude rates are presented in aggregate for all violent deaths by abstractor-assigned manner of death and for special situations and populations (e.g., homicide followed by suicide, suicides of former or current military personnel, and intimate-partner--related homicides). Rates for cells with a frequency of <20 are not reported because of the instability of those rates. In addition, rates could not be calculated for variables such as marital status and precipitating circumstances because denominators were unknown. Bridged-race 2006 population estimates were used as denominators in the rate calculations (6). For compatible numerators for rate calculations to be derived, person records listing multiple races were recoded to a single race when possible, using a bridging algorithm provided by NCHS (available at http://www.cdc.gov/nchs/about/major/dvs/popbridge/popbridge.htm). ResultsAll Violent Deaths Violent Deaths by Manner, Method, and Location The 16 NVDRS states included in this report collected data concerning 15,007 violent death incidents and 15,395 deaths that occurred during 2006. The crude (i.e., not adjusted for age) rate of violent death was 19.5 deaths per 100,000 population. Suicides (n = 8,599) accounted for the highest rate of violent death (10.9 per 100,000 population) followed by homicide/legal-intervention deaths (n = 4,343; rate: 5.5 deaths per 100,000 population). Deaths of undetermined intent (n = 2,332) and unintentional firearm deaths (n = 101) occurred at lower rates (3.0 and 0.1 deaths per 100,000 population, respectively). Of all violent deaths occurring in 2006 in the 16 states included in this report, the great majority (97.8%) of incidents involved a single victim. Firearms accounted for 48.2% of injury deaths, poisoning for 20.4%, and hanging/strangulation/suffocation for 13.3% (rates: 9.4, 4.0, and 2.6 deaths per 100,000 population, respectively); rates for other methods were lower. For all violent deaths, a house or apartment was the most common location (68.8%). The next-most-common location of injury (8.6%) was a street or highway (Table 1). Toxicology Results of DecedentTests for alcohol were conducted for 76.1% of decedents, and drug tests for amphetamines, antidepressants, cocaine, marijuana, and opiates were conducted for 51.2%, 45.0%, 58.2%, 36.1%, and 56.9% of decedents, respectively. Among decedents who tested positive for alcohol (32.2%), 54.2% had a blood alcohol concentration (BAC) of >0.08 mg/dL (the legal limit in the majority of states). Opiates, including heroin and prescription pain killers, were identified in 24.5% of cases tested for these substances, antidepressants in 21.5%, cocaine in 15.6%, marijuana in 11.9%, and amphetamines in 4.7% (Table 2). SuicidesSex, Race/Ethnicity, Age Group, and Marital Status The 16 NVDRS states included in this report collected data concerning 8,593 fatal suicide incidents and 8,599 suicides that occurred during 2006. Rates of suicide by month showed little variation throughout the year (range: 0.8--1.0 deaths per 100,000 population) (Table 3). Overall, the crude suicide rate was 10.9 per 100,000 population. The rate for males was nearly four times that for females (17.3 and 4.7 deaths per 100,000 population, respectively). Non-Hispanic whites accounted for the largest number of suicide deaths, and AI/ANs and non-Hispanic whites had the highest rates of suicide (14.8 and 13.1 deaths per 100,000 population, respectively). The highest rates of suicide by age group occurred among persons aged 45--54 years and 35--44 years (17.1 and 15.3 deaths per 100,000 population, respectively). Children aged 10--14 years had the lowest rates of suicide among all age groups (1.1 deaths per 100,000 population). Rates of suicide among adolescents aged 15--19 years (6.9 deaths per 100,000 population) were approximately half those for persons aged >19 years (Table 4). Males aged 35--64 years accounted for 55.6% of suicide deaths. Rates among males were highest for those aged >85 years followed by those aged 75--84 years (38.6 and 27.3 deaths per 100,000 population, respectively). AI/AN males had the highest rates of any racial/ethnic population and had rates that were more than three times the rate for API males. Among females, decedents aged 35--64 years accounted for 65.5% of suicides. Rates for females peaked at 8.8 deaths per 100,000 among those aged 45--54 years. As with males, suicide rates were highest among AI/ANs (5.9) followed closely by non-Hispanic whites (5.8). Among females, the lowest rates of suicide were among non-Hispanic blacks (1.3) and Hispanics (2.0). Of all decedents aged >18 years whose marital status was known, 38.1% were married, 28.6% never had married, and 23.5% were divorced at the time of death (Table 4). Method and Location of InjuryFirearms were used in the majority (51.3%) of suicide deaths, followed by hanging/strangulation/suffocation (22.1%) and poisoning (18.4%) (Table 3). The most common method used by male suicide decedents was a firearm (56.8 %) followed by hanging/strangulation/suffocation (23.4%). Among females, poisons were used most often (41.0%) followed by firearms (31.4%). The most common place of self-inflicted injury was a house or apartment (75.7%) followed by natural areas (4.2%), streets or highways (3.3%), and motor vehicles (2.8%). A total of 116 (1.3%) suicides occurred in a jail or prison setting (106 males and 10 females) (Table 5). Toxicology Results of Decedent and Precipitating CircumstancesTests for alcohol were conducted for 72.5% of suicide decedents, and drug tests for amphetamines, antidepressants, cocaine, marijuana, and opiates were conducted for 43.8%, 41.2%, 49.5%, 35.9%, and 49.9% of suicide decedents, respectively. Among suicide decedents who tested positive for alcohol (33.3%), 56.3% had a BAC of >0.08 mg/dL. Opiates, including heroin and prescription pain killers, were identified in 19.1% of cases tested for these substances; cocaine and marijuana were identified in 10.3% and 8.1% of persons tested for these substances, respectively. Of suicide decedents who were tested for antidepressants, 26.9% were positive for antidepressants at the time of their death (Table 6). Precipitating circumstances were known for approximately 88% of suicide decedents. Overall, mental-health problems were the most commonly noted circumstance for suicide decedents, with 43.6% described as experiencing a depressed mood at the time of their deaths. Nearly as many were described as having a diagnosed mental-health problem (41.9%), although only 32.8% were receiving treatment (Table 7). Of those with a diagnosed mental disorder, 75.3% had received a diagnosis of depression/dysthymia, 13.4% of bipolar disorder, and 7.7% of an anxiety disorder (Table 8); 19.5% of suicide decedents had a history of previous suicide attempts, 29.0% had disclosed their intent before dying, and 33.0% left a suicide note (Table 7). Other than mental health conditions, circumstances noted most often were intimate-partner problems or a crisis of some kind in the preceding 2 weeks, each indicated in approximately 30% of suicides with known circumstance information. Physical-health problems also were noted in 22.0% of cases. Similar percentages of male and female suicide decedents were observed to have a depressed mood at the time of death; however, nearly twice as many females as males had received a diagnosis of a mental-health problem (63.9% and 36.7%, respectively) or were being treated for a mental-health problem (51.1% and 27.5%, respectively). Approximately the same percentage of male and female suicide decedents experienced physical-health problems in the period before their deaths, although a higher percentage of males than females had job, financial, or criminal problems in the period preceding their deaths. Intimate-partner problems also were cited as a precipitating factor in a higher percentage of male suicides than female suicides (32.9% and 26.4%, respectively). Although occurring in only a limited percentage of cases, being a perpetrator of interpersonal violence in the month before death was more common among male suicide decedents (6.3%) than being a victim of such violence (0.3%) whereas the proportions were similar for females (1.3% and 1.1%, respectively) (Table 7). HomicidesSex, Race/Ethnicity, Age Group, and Marital Status The 16 NVDRS states included in this report collected data concerning 4,138 homicide incidents and 4,335 homicides that occurred during 2006. Overall, the crude homicide rate was 5.5 deaths per 100,000 population in 2006. Rates of homicide by month showed little variation throughout the year (range: 0.3--0.5 per 100,000 population) (Table 9). The majority (52.1%) of homicide decedents aged >18 years for whom marital status was known never had been married, and 23.3% were married at the time of their deaths. In 40.7% of homicides, the relation of the victim to the suspect was not known. When a suspect was identified, the suspect most often was an acquaintance or friend (15.7%), a spouse or intimate partner (10.2%), or a stranger (7.4%). Perpetrators were other relatives of the decedent in <10% of cases (Table 10). The homicide rate for males was approximately 3.8 times that for females (8.8 and 2.3 deaths per 100,000 population, respectively). Non-Hispanic blacks accounted for the majority (52.8%) of homicide deaths and had the highest rate (18.9 deaths per 100,000 population) followed by AI/ANs (8.7) and Hispanics (6.2). Age-specific homicide rates were highest (14.4 deaths per 100,000 population) among those aged 20--24 years followed by those aged 25--29 years (11.2 deaths per 100,000 population). The rate for infants aged <1 year was approximately four times that for children aged 1--4 years (8.2 and 2.1 deaths per 100,000 population, respectively) and similar to that for adolescents aged 15--19 years (8.4 deaths per 100,000 population). Rates were lowest among children aged 5--14 years and persons aged >55 years. The majority (64.6%) of all male homicide decedents were aged 20--44 years; males aged 20--24 years had the highest rates of homicide (24.4 deaths per 100,000 population). For females, homicide rates were highest (7.0 deaths per 100,000 population) among infants aged <1 year (Table 11). Method and Location of InjuryFirearms were used in 65.8% of homicides, followed by sharp instruments (12.1%) and blunt instruments (4.6%). No other single method was used in more than 2.7% of homicides (Table 9). Firearms were the most common method used in homicides of males (70.9%) and females (47.2%). Hanging/strangulation/suffocation was nearly seven times more common among female homicide decedents than among males (8.0% and 1.2%, respectively). A house or apartment was the most common location of homicide for both males and females (45.1% and 73.2%, respectively). The next-most-common location of homicide for males was a street or highway (25.7%), a parking lot or public garage (4.7%), and a motor vehicle (4.6%); for females, the next-most-common locations were a street or highway (8.1%), a commercial/retail area (2.6%), a natural area (2.4%), or a parking lot or public garage (2.4%) (Table 12). Toxicology Results of Decedent and Precipitating CircumstancesTests for alcohol were conducted for 80.1% of homicide decedents, and drug tests for amphetamines, antidepressants, cocaine, marijuana, and opiates were conducted for 53.6%, 39.2%, 64.2%, 34.9%, and 57.9% of homicide decedents, respectively. Among homicide decedents who tested positive for alcohol (33.6%), 51.4% had a BAC of >0.08 mg/dL. Marijuana, cocaine, and opiates were identified in 19.6%, 17.2%, and 8.2% of homicide decedents tested, respectively (Table 13). Precipitating circumstances were identified for 70% of homicide deaths. Approximately one third of those homicides were precipitated by another crime. In 79.0% of these cases, the crime was in progress at the time of the incident (Table 14). The crime was most often robbery (37.0%), followed by assault (24.4%), burglary (9.3%), drug-related (7.9%), rape/sexual assault (4.3%), or motor-vehicle theft (4.0%) (Table 15). Other common precipitating circumstances were an argument, abuse, or conflict over something other than money or property (39.3%); drug-related (16.0%); or an argument over money or property (7.6%). In 20.1% of cases, intimate-partner violence was identified as a contributing factor. In <1% of the cases, the decedent was a police officer killed in the line of duty or an intervening person assisting a crime victim (Table 14). An argument, abuse, or a conflict unrelated to money or property was a factor in more homicides among males than among females (43.0% and 27.1% respectively). Drug-related homicides accounted for 18.1% of male homicides and 9.0% of female homicides. Intimate-partner violence was a precipitating factor in 52.2% of female homicides but only 10.3% of male homicides. In 12.9% of male homicides, the decedent also used a weapon during the altercation, compared with 2.8% of female homicides (Table 14). Deaths of Undetermined IntentSex, Race/Ethnicity, Age Group, and Marital Status The 16 NVDRS states included in this report collected data concerning 2,323 violent death incidents involving 2,332 deaths during 2006 for which a determination of intent could not be made. Rates of undetermined death by month were at 0.2 or 0.3 deaths per 100,000 population throughout the year (Table 16). Overall, the crude rate of undetermined violent deaths was 3.0 per 100,000 population. Rates of undetermined death were higher among males than among females (3.8 and 2.2 deaths per 100,000 population, respectively). Although non-Hispanic whites accounted for 71.5% of undetermined deaths, rates were highest among AI/ANs and non-Hispanic blacks (5.4 and 3.7 deaths per 100,000 population, respectively). The majority (50.4%) of decedents for whom the manner of death was undetermined were aged 35--54 years. Rates were highest (20.0 deaths per 100,000 population) among infants aged <1 year. Among decedents with an undetermined manner of death age >18 years for whom marital status was known, 39.3% never had been married, 27.6% were married, and 25.0% were divorced at the time of death. AI/AN males had the highest rates (6.9 deaths per 100,000 population) of undetermined death compared with males or females of any other racial/ethnic population (Table 17). Method and Location of InjuryThe most common method of injury was poisoning (65.7%). No other known single method accounted for >2.4% of undetermined deaths. Among both males and females for which the method of injury was known, poisoning was reported for 65.1% and 66.9% of deaths, respectively. The majority of undetermined violent deaths occurred in a house or apartment, making it the most common place of injury for both males and females (72.4% and 81.6%, respectively). A street or highway was the second-most-common setting, accounting for 4.5% of deaths among males and 3.2% among females (Table 18). Toxicology Results of Decedent and Precipitating CircumstancesTests for alcohol were conducted for 83.1% of decedents of undetermined intent, and drug tests for amphetamines, antidepressants, cocaine, marijuana, and opiates were conducted for approximately 75.2%, 71.0%, 80.0%, 39.7%, and 82.2% of decedents, respectively. Among decedents who tested positive for alcohol (26.6%), 50.8% had a BAC of >0.08 mg/dL. Among decedents tested for opiates, 58.6% were positive; of those tested for cocaine, 25.8% were positive; of those tested for marijuana, 11.9% were positive; and of those tested for antidepressants, 28.1% were positive (Table 19). Precipitating circumstances were known in approximately 70% of deaths of undetermined intent. Of those, 26.3% were related to alcohol, and 60.5% were "other substance-abuse problems" (e.g., those involving an illicit drug); Although a current depressed mood was reported for only 13.7% of decedents, 32.7% had a current mental-health problem, 25.2% were in treatment at the time of their death, 9.2% had a history of suicide attempts, 6.5% had disclosed an intent to commit suicide, and 1.9% had left a suicide note. Other circumstances noted most often were physical-health problems (32.1%), a crisis during the preceding 2 weeks (14.4%), or an intimate-partner problem (9.7%) (Table 20). Of those with a current mental-health problem, 57.1% had received a diagnosis of depression/dysthymia, 20.3% of bipolar disorder, and 11.3% of an anxiety disorder (Table 21). A greater percentage of male than female decedents were reported to have an alcohol problem (31.3% and 17.7%, respectively) or other substance-abuse problems (64.9% and 52.9%, respectively) at the time of death. Mental-health problems were reported in a higher percentage of undetermined deaths of females than of males (47.6% and 24.0%, respectively), and a higher percentage of females were currently in treatment for a mental-health problem than males (37.1% and 18.3%, respectively) and had a history of suicide attempts (12.6% and 7.2%, respectively) (Table 20). Unintentional Firearm DeathsSex, Race/Ethnicity, Age Group and Seasonality The 16 NVDRS states included in this report collected data concerning 101 unintentional firearm deaths during 2006. Males accounted for 85.1% of decedents. The majority (74.3%) were non-Hispanic whites, followed by non-Hispanic blacks (14.9%). More than half (51.5%) of unintentional firearm fatalities occurred among persons aged 10--29 years. November had the highest percentage of unintentional deaths (17.8%) followed by January (10.9%) and June, October, and December, each with 9.9% (Table 22). Location of InjuryApproximately 73.3% of all unintentional firearm fatalities took place in a house or apartment, making it the most common place of injury for both males and females, followed by natural areas (7.9%) (Table 22). Context of the Injury and Associated CircumstancesOverall, unintentional firearm injury deaths occurred more commonly while victims were playing with a gun (32.5%), showing a gun to others (15.7%), hunting (13.3%), or loading or unloading a gun (13.3%). The circumstances of injury included thinking that a gun was unloaded, unintentionally pulling the trigger, and dropping a gun (25.3%, 19.3%, and 10.8%, respectively) (Table 23). Special TopicsViolent Deaths with Multiple Decedents The 16 NVDRS states included in this report collected data concerning 331 violent incidents that resulted in multiple decedents. Firearms were the most common method (74.8%) used in violent deaths with multiple decedents, followed by sharp instruments (5.0%) and poisonings (2.9%); other combinations of mechanisms accounted for 6.3%. Of a total of 719 victims, 453 (63.0%) were males; 325 (91.6%) of 355 suspects also were males (Table 24). Non-Hispanic whites accounted for the highest percentage of decedents (50.5%), followed by non-Hispanic blacks (37.3%) and Hispanics (6.3%). Rates for decedents were highest for persons aged 20--54 years. Suspects most commonly were aged 20--54 years (Table 25). Homicide Followed by SuicideThe 16 NVDRS states included in this report collected data concerning 166 violent incidents that occurred during 2006 in which a homicide was followed by the suicide of the suspect. Of 194 homicide decedents, 141 (72.7%) were female; and 157 (94.6%) suspects who committed suicide after committing a homicide (suicide decedents) were male. Homicide rates were similar for non-Hispanic whites and non-Hispanic blacks (0.2 and 0.3 deaths per 100,000 population respectively); 66.5% of homicide decedents were non-Hispanic whites. Among suspects who killed themselves after committing a homicide, 59.0% were non-Hispanic whites, and 24.1% were non-Hispanic blacks. The highest percentages of both homicide and suicide decedents were aged 35--54 years (33.0% and 51.2%, respectively) (Table 26). The majority of homicide decedents and suspects (47.9% and 32.5%, respectively) were married at the time of death (not necessarily to each other) (Table 26). With respect to location, 83.0% of the homicides occurred in a house or apartment, 2.1% in a parking lot/public garage, 2.6% in a natural area, and 2.1% on streets or highways. Firearms were the most common (82.0%) method used by suspects both in committing the homicide and in subsequently committing suicide (Table 27). Tests for alcohol were conducted for 76.8% of homicide decedents and 80.1% of suicide decedents. Among decedents who tested positive for alcohol (10.7% of homicide victims; 27.1% of suicide decedents), 26.7% of homicide decedents and 41.7% of suicide decedents had a BAC of >0.08 mg/dL at the time of death. Suspects who killed themselves following a homicide and who were tested subsequently for drugs had higher percentages of positive tests for antidepressants, cocaine, marijuana, and opiates than homicide victims (Table 28). Although 12.3% of persons who committed suicide following a homicide had a current depressed mood, only 3.1% were receiving mental-health treatment at the time of the fatal incident. Intimate-partner--relationship problems preceded homicide followed by suicide in 73.0% of suspect suicides. Other nonintimate-partner--relationship problems contributed to 17.8% of suspect suicides. Of suspects who killed themselves, 87.7% had had a personal crisis within the preceding 2 weeks. Previous criminal legal problems were noted in 20.3% of suspect suicides and noncriminal problems in 3.1%; physical health or financial problems were contributing circumstances in 4.9% and 9.2% of suspect suicides respectively; 11.7% of suicide decedents had disclosed their intent to kill themselves; and 3.1% had a history of suicide attempts (Table 29). Intimate-Partner HomicideThe 16 NVDRS states included in this report collected data concerning 559 incidents comprising 616 deaths of intimate-partner--related homicide that occurred during 2006. Of 616 homicide victims, 370 (60.1%) were female. Although 51.0% of homicide victims were non-Hispanic whites, rates were higher for AI/ANs and non-Hispanic blacks (2.3 and 1.8 per 100,000 population, respectively). Of 583 suspects, 454 (77.9%) were male; 217 (37.2%) were non-Hispanic whites and 203 (34.8%) non-Hispanic blacks. The highest percentages of victims and suspects (26.8% and 24.7%, respectively) were persons aged 35--44 years. The highest percentage (43.8%) of victims were married at the time of death (Table 30). Tests for alcohol were conducted for 79.4% of victims. Of the 30.1% of decedents who tested positive for alcohol, 59.9% had a BAC of >0.08 mg/dL. The percentage of victims tested for substances other than alcohol varied (range: 34.3%--56.2%) for various drugs; cocaine and marijuana were evident in approximately 13% of victims tested for these substances (Table 31). Suicide of Former or Current Military PersonnelThe 16 NVDRS states included in this report collected data concerning 1,596 suicides by former or current military personnel that occurred during 2006. Of these 1,596 suicide decedents, 1,547 (96.9%) were male, and 1,451 (90.9%) were non-Hispanic whites. The greatest percentage of decedents were persons aged >45 years. The most common method (68.7%) used was a firearm followed by hanging/strangulation/suffocation (13.0%) and poisoning (12.0%) (Table 32). Among the 69.2% of former or current military personnel suicide decedents who were tested for alcohol, 30.5% tested positive; 60.2% of these decedents had a BAC of >0.08 mg/dL (Table 33). Although 46.9% were depressed at the time of death, and 36.6% had a diagnosed mental-health problem, only 28.3% were receiving mental-health treatment. With respect to substance abuse, 16.0% had an alcohol problem, and 7.3% had a problem with other substances. With respect to other difficulties: 24.9% had experienced a problem with an intimate partner, 39.7% had a physical-health problem, and 27.8% had experienced an acute crisis during the preceding 2 weeks. With respect to life stressors, 10.4% had experienced a job problem, 12.4% a financial problem, and 7.5% a criminal legal problem. Approximately one third (36.6%) left a suicide note, 12.9% had made a previous suicide attempt, and 27.4% had disclosed an intent to commit suicide (Table 34). Legal InterventionThe 16 NVDRS states included in this report collected data on 173 legal-intervention incidents resulting in 174 deaths in 2006. Of the 174 decedents, 50.6% were non-Hispanic whites and 35.1% were non-Hispanic blacks. With respect to location, 44.8% of legal-intervention deaths occurred in a house or apartment, 24.1% on a street or highway, and 6.3% in a parking lot or public garage (Table 35). The majority of decedents were aged 20--54 years (Table 36). Of the 86.2% of legal-intervention decedents tested for alcohol, 38.7% were positive for alcohol and 62.1% of these decedents had a BAC of >0.08 mg/dL. The percentage of victims tested for other substances varied (range: 38.5%--72.4%). The presence of other drugs for which tests were positive also varied: 26.2% of decedents tested for cocaine, 18.3% of those tested for marijuana, 13.4% of those tested for antidepressants, 11.4% of those tested for amphetamines, and 9.2% of those tested for opiates were positive for these substances (Table 37). Suicide Among Persons Aged >50 YearsIn 2006, NVDRS collected data for 3,300 persons aged >50 years who died by suicide. Of those, 1,658 (50.2%) were aged 50--59 years (16.0 per 100,000 population), 783 (23.7%) were aged 60--69 years (12.5 per 100,000), 481 (14.6%) were aged 70--79 years (11.9 per 100,000), and 378 (11.5%) were aged >80 years (14.1 per 100,000 population). Among persons aged >50 years, rates were four times higher among males than among females (24.0 and 5.8 per 100,000 population, respectively). Rates were highest among non-Hispanic whites (16.2 per 100,000 population), followed by AI/ANs (11.3 per 100,000 population), APIs (8.0), Hispanics (5.9), and non-Hispanic blacks (4.3). At the time of death, persons aged 50--69 years most often were either married or divorced and those aged 70--79 years and those aged >80 years most often were either married or widowed (Table 38). The majority (79.6%) of suicide decedents aged >50 years died in a house or apartment. The second-most-common place for all age groups except those aged >80 years was a natural area (4.2%, 3.8%, and 3.7% for those aged 50--59, 60--69, and 70--79 years, respectively). The second-most-common location for those aged >80 years was a hospital/medical facility (1.9%), followed by a park, playground, or sports/athletic area (1.6%). As to method used by suicide decedents aged >50 years, firearms accounted for 61.1% of deaths (rate: 8.6 deaths per 100,000 population), poisoning for 18.2% (2.6 deaths per 100,000 population), and hanging/strangulation/suffocation for 12.2% (1.7 deaths per 100,000 population). Rates of firearm suicide were highest among persons aged >80 years (10.1 deaths er 100,000) and those aged 70--79 years (9.0 per deaths 100,000 population) (Table 38). Precipitating circumstances were identified for approximately 90% of older adult suicides. Current depressed mood (45.8%), current mental-health problem (41.7%), and physical-health problems (40.2%) were the most commonly identified circumstances; 36% left a suicide note, and 26.5% disclosed their intent to commit suicide (Table 39). DiscussionThe findings in this report indicate clear variations in patterns of death from violence-related injuries reported from the 16 states included in this report. Rates for violent death were disproportionately higher among males, younger adults (with the exception of suicides), and minority populations. A residence (house or apartment) was the most common location for all injury deaths. Of all incidents of violent deaths occurring in 2006 in the 16 states included in this report, 97.8% involved a single victim. Suicide PatternsSuicide rates were higher among AI/ANs and non-Hispanic whites than among non-Hispanic blacks and highest among persons aged 45--54 years. These findings are similar to those that have been documented in other reports (7--9), with the exception of age. For example, overall rates of suicide in the United States are highest among persons aged >80 years (1). However, the specific age patterns for males and females in this report were similar to those reported elsewhere (1,7). The overall high rates of suicide among persons aged 45--54 years might be related, in part, to the fact that NVDRS states include four states (Alaska, Colorado, New Mexico, and Oregon) with some of the highest rates of suicide in this age group in the United States (1). However, problems related to mental health, jobs, finances, or relationships also might have contributed to the high rates of suicide in this age group. Current mental health and/or substance-abuse problems, relationship problems and losses, and recent crises were frequent precipitants for suicide. These factors have been documented in other studies as important risk factors for suicide (8,10). Despite the high prevalence of mental-health problems among suicide decedents, only one third of such decedents were known to be receiving treatment at the time of death. Whether the lack of treatment is related to limited access to care or an unwillingness or inability to seek care is unknown. Persons might be unwilling to seek care because of the stigma attached to mental-health problems or severe mental illness affecting their capacity to make treatment decisions. Barriers in accessing mental-health treatment and stigma are both contributing factors in cases of suicide (8,10). Alcohol was a factor in approximately one third of the reported suicides, and 56.3% of these decedents had a BAC of >0.08 mg/dL at the time of death. Alcohol and drug abuse in persons with and without affective mood disorders both are associated with suicidal behavior (11,12). However, the relation is complex; for example, alcohol abuse might lead directly to depression or indirectly through the sense of decline and failure that is experienced by the majority of persons who are dependent on alcohol. Alcohol also might be a form of self-medication to alleviate depression. Both depression and alcohol abuse also might be the result of specific stresses in a person's life (13). Approximately 30% of suicide victims had disclosed their intent to commit suicide, and approximately 20% had made a previous suicide attempt. A previous suicide attempt is an important predictor of subsequent fatal suicidal behavior (8,13). Disclosure of intent also is an important warning sign of suicidal intentions, although persons in close contact with potential victims of suicide often are unaware of the significance of these warnings or unsure how to act on them (14). A unique feature of NVDRS is that it permits examination of violent deaths involving specific populations. Military personnel (former or current) were one of the special populations included in this report. The findings for suicide revealed similar precipitating circumstances among this population compared with those among all other male suicide decedents, with one exception. The proportion of former or current military personnel reported to be experiencing health problems was nearly double that for nonmilitary personnel. This might reflect a difference in reporting and contact with health-care professionals related to their military personnel status. In >40% of suicides, physical illness is considered a contributory factor, especially if mood disorders or depressive symptoms also are present (13). Homicide PatternsHomicide rates were higher among males than among females, among non-Hispanic blacks compared with members of other racial/ethnic populations, and among persons aged 20--24 years compared with persons in other age groups. These findings also are consistent with patterns documented in other reports. Homicide is the second leading cause of death in the United States among persons aged 10--24 years, and rates among non-Hispanic blacks in this age group exceed those of other racial/ethnic populations by approximately fourfold to sevenfold (1). Males also are disproportionately represented among victims of homicide in the United States and elsewhere (1,15). The majority of homicides involved a single victim. Multiple decedent homicides and homicide-suicide incidents accounted for <3% of violent deaths. The majority of homicides were related to interpersonal conflicts. Crime was a factor in approximately one third of all homicide/legal-intervention deaths. These findings also are consistent with other research on homicide. Arguments and conflicts are immediate motivations for the majority of both male and female homicides in the United States (16). One factor that distinguishes male from female homicides is the relationship between the victim and the perpetrator. In the United States, approximately one in three homicides of females is committed by a current or former spouse or partner (17). Among male homicide victims, approximately 5% are killed by intimate partners. The findings of this report indicate that male homicide decedents mostly were killed following arguments or conflicts with persons other than an intimate partner or for other reasons, whereas more than half of homicides involving a female victim involved intimate-partner--related violence. As with suicide decedents, alcohol was present in approximately one third of homicide decedents; approximately half of these decedents had BACs of >0.08 mg/dL. Alcohol is an important situational factor in interpersonal violence. In the case of interpersonal violence among youths, excessive alcohol consumption might increase impulsivity and make some drinkers resort more often to violence in a confrontation or argument (18,19). Reduced physical control and the ability to assess risks in potentially dangerous situations also can make some drinkers more vulnerable to victimization (18,19). In the case of intimate-partner violence, excessive alcohol consumption by one or both partners might exacerbate financial or child care problems or other family stressors and increase tension and conflict in the relationship (20). Alcohol also can be a form of self-medication to cope with previous or current experiences of abuse (20). Method of InjuryApproximately two thirds of all homicides and approximately one half of all suicides in the United States are committed with a firearm (1). In the 16 states included in this report, firearms were the most common method used in homicides, incidents involving multiple victims, and incidents of homicide followed by suicide. Previous research indicates that interpersonal disputes can escalate and cause serious violent injury or death, especially when weapons of lethal means (e.g., firearms) are involved in the dispute (21,22). Firearms also were the most common method used in suicides, although methods differed by sex. Firearms were the most common method used by males to complete suicide followed by hanging/strangulation/suffocation. Poisoning was the most common method used by females, followed closely by firearms. The majority of deaths with undetermined intent were the result of poisonings or had an unknown cause. Poisoning was the most common method for both males and females. Toxicology results documented a high prevalence of alcohol and other substances at the time of death. For example, approximately 80% of decedents with undetermined intent were tested for opiates, and nearly 59% tested positive for these substances. Whether these deaths were related to unintentional drug poisonings (which have increased substantially in recent years, particularly among adults aged 35--54 years [23,24]) or were suicides is unknown. The majority (59.6%) of decedents in the 16 states discussed in this report were aged 35--54 years. Substance-abuse problems involving drugs other than alcohol were the most commonly noted circumstance; approximately one third of such decedents had a current mental-health problem, and nearly 10% had a history of suicide attempts. Prevention OpportunitiesMany prevention opportunities are available to reduce violent deaths that are common across types of violence. Risk and protective factors for interpersonal and self-directed violence operate at multiple levels of social influence (15). Prevention programs can benefit from considering both the best way to address individual-level factors and the factors within families, peer groups, schools, or communities that contribute to violent behavior. In general, prevention approaches that address multiple domains of influence on behavior are more likely to have a preventive impact than those that focus on a single risk factor (25). Information concerning the precipitating circumstances in violent deaths described in this report provides some important clues regarding where to focus prevention efforts. For example, relationship problems, interpersonal conflicts, and recent crises were important precipitating factors for both homicide and suicide. Intimate-partner--related problems, in particular, were a factor in many types of violent death. Programs designed to enhance social problem-solving and coping skills to deal with stressful life events, health and financial problems, or other problems that occur within interpersonal relationships can potentially reduce violence (26). In addition to demonstrating the need to address situational stressors, the findings in this report underscore the importance of changing cultural and social norms (e.g., attitudes toward the use of violence as a means of resolving conflict), addressing the social and economic conditions within communities that often give rise to violence (e.g., social isolation, lack of connectedness, and unemployment), and intervening much earlier by teaching young persons the skills to develop and promote nonviolent interpersonal relationships. Some of the strategies that offer the strongest evidence of effectiveness with respect to the latter are primary prevention strategies that focus on family environments, school environments, and building individual social, emotional, and behavioral competencies (26--29). Substance abuse, especially alcohol, was also an important contributing factor in cases of homicide and suicide. This finding underscores the need for primary prevention efforts aimed at preventing substance abuse, such as family, school, and community-based approaches, and programs and policies aimed at increasing the accessibility of treatment for those with substance-abuse problems. Approximately one third of the suicide decedents had disclosed their intent to commit suicide, and one in five had made a previous attempt. Mental-health problems also were highly prevalent among suicide decedents, yet many were not known to be receiving treatment at the time of death. These results underscore the importance of knowing the signs and symptoms of suicidal behavior, reaching out to those with problems, reducing the stigma of mental illness, and increasing the accessibility of treatment. LimitationsThe findings provided in this report are subject to at least seven limitations. First, the availability, completeness, and timeliness of data are dependent on the sharing of data among state health department NVDRS teams, CMEs, and law enforcement personnel in their states. This is particularly challenging when states have independent county coroner systems rather than a centralized CME system. NVDRS incident data might be limited or incomplete for areas in which these data-sharing relations are not developed fully. Second, toxicology data are not collected consistently across all states or for all alcohol and drug categories. The percentage of decedents testing positive might be affected by selective testing biases in medical examiner or coroner offices (30). Third, abstractors are limited to the data included in the reports they receive. Reports might not fully reflect all information known about an incident, particularly in the case of homicides, when data are less readily available until after prosecutions are complete. Fourth, case definitions present challenges when a single death is classified differently in different documents (e.g., "unintentional" in a police report, "homicide" in a CME report, and "undetermined" on the death certificate). NVDRS abstractors reconcile these cases using standardized NVDRS case definitions and select a single manner of death on the basis of all source documents. Fifth, NVDRS data are available only from a limited number of states and therefore are not nationally representative. Sixth, although extensive coding training is conducted and help desk support is available daily, variations in coding might occur depending on the abstractor's level of experience. For this reason, states regularly conduct blinded reabstraction of cases to test consistency and identify training needs. Finally, protective factor data (i.e., characteristics or circumstances that reduce the risk for violent death) are not collected by NVDRS as a result of the nature of death certificate, CME record, and police reports, which typically contain only circumstances associated with risk factors. ConclusionAccurate, timely, and comprehensive surveillance data such as those in NVDRS (31,32) can be used to track the occurrence of violence-related fatal injuries and assist public health and other authorities in the development, implementation, and evaluation of programs and policies that reduce and prevent violent deaths and injuries at the national, state, and local levels. Continued development and expansion of NVDRS is critical to CDC, the public health community, and state and local efforts to reduce the personal, familial, and societal costs of violence. Further efforts are needed to increase the number of states participating in NVDRS, with the ultimate goal of full national representation, including all 50 states, the District of Columbia, and U.S. territories. Additional information regarding NVDRS is available at http://www.cdc.gov/ncipc/dvp/NVDRS/nvdrs_aag_2008-a.pdf. Acknowledgments Contributors to this report included participating State Violent Death Reporting Systems; participating state agencies, including state health departments, vital registrars' offices, coroners' and medical examiners' offices, crime laboratories, and local and state law enforcement agencies; partner organizations, including the State and Territorial Injury Prevention Directors' Association, National Association of Medical Examiners, National Association for Public Health Statistics and Information Systems, Council of State and Territorial Epidemiologists, and Association of State and Territorial Health Officials; federal agencies, including the Department of Justice (Bureau of Justice Statistics and the Federal Bureau of Investigation), the Department of the Treasury (Bureau of Alcohol, Tobacco, and Firearms); the International Association of Chiefs of Police; other stakeholders, researchers, and foundations, including Harvard University School of Public Health, the Joyce Foundation, and Fenton Communications; and the National Institute for Occupational Safety and Health, National Center for Health Statistics, CDC. References
National Violent Death Reporting System State Coordinators
Deborah Choromanski Hull-Hilly, MPH, Scott Saxton, Alaska Department of Health and Social Services, Anchorage, Alaska; Roger Trent, PhD, Jason Van Court, California Department of Health Services, Sacramento, California; Holly Hedegaard, MD, Colorado Department of Public Health and Environment, Denver, Colorado; John Horan, MD, Georgia Department of Human Resources, Atlanta, Georgia; Sabrina Walsh, DrPH, University of Kentucky, Lexington, Kentucky; Joan Stine, MHS, MS, Bert Cramer, Maryland Department of Health and Mental Hygiene, Baltimore, Maryland; Victoria Ozonoff, PhD, Lauren Kievits, Massachusetts Department of Public Health, Boston, Massachusetts; Katherine Hempstead, PhD, Bretta Jacquemin, New Jersey Department of Health and Senior Services, Trenton, New Jersey; Anne Styka, MPH, New Mexico Department of Health, Santa Fe, New Mexico; Scott Proescholdbell, MPH, Tammy Norwood, North Carolina Department of Health and Human Services, Raleigh, North Carolina; Sheryll Brown, MPH, Oklahoma State Department of Health, Oklahoma City, Oklahoma; Lisa Millet, MSH, Xun Shen, MD, Oregon Department of Health, Portland, Oregon; Thomas Gilson, MD, Wendy Verhoek-Oftedahl, PhD, Rhode Island Department of Health, Providence, Rhode Island; Ted Holland, Jr, Keisha Adams, MPH, South Carolina Department of Health, Columbia, South Carolina; Virginia Powell, PhD, Marc Leslie, MS, Virginia Department of Health, Richmond, Virginia; Patricia Keller, MPH, Utah Department of Health, Salt Lake City, Utah; Linda Hale, Debi Peters, Wisconsin Department of Health and Human Services, Madison, Wisconsin. Table 1 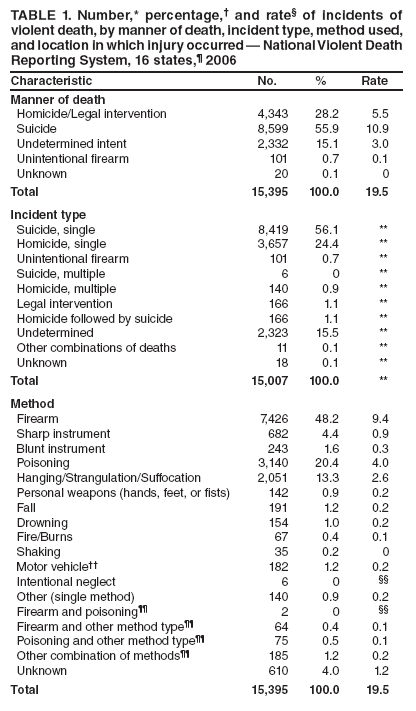
 Return to top. Box 1 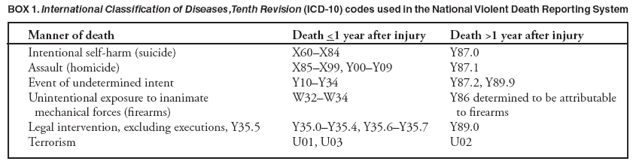 Return to top. Table 2 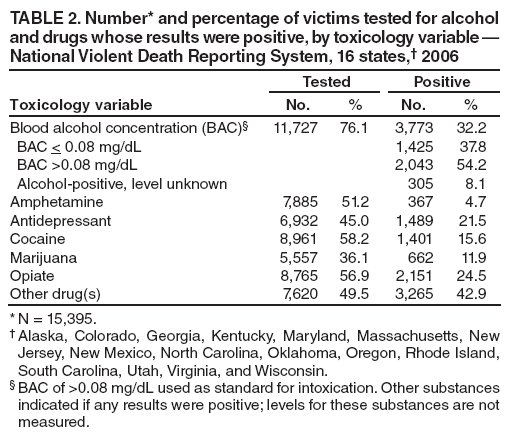 Return to top. Box 2 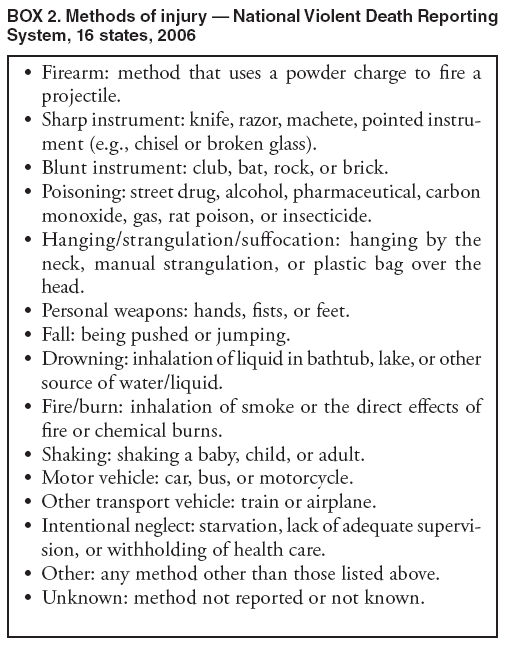 Return to top. Table 3 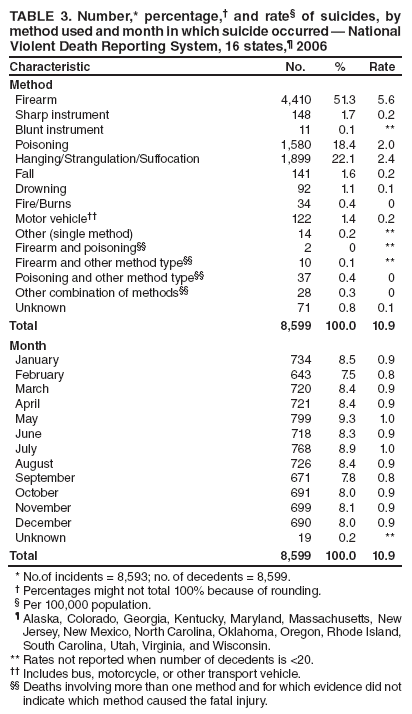 Return to top. Box 3 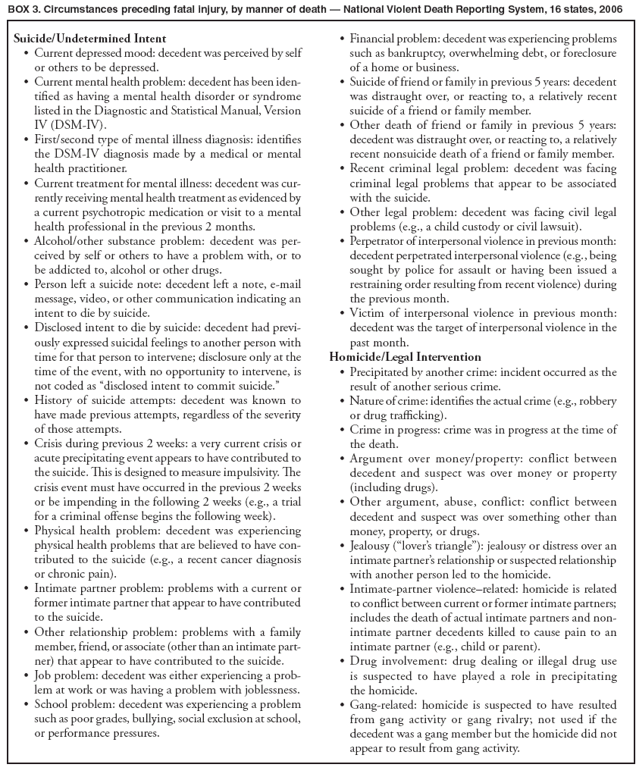 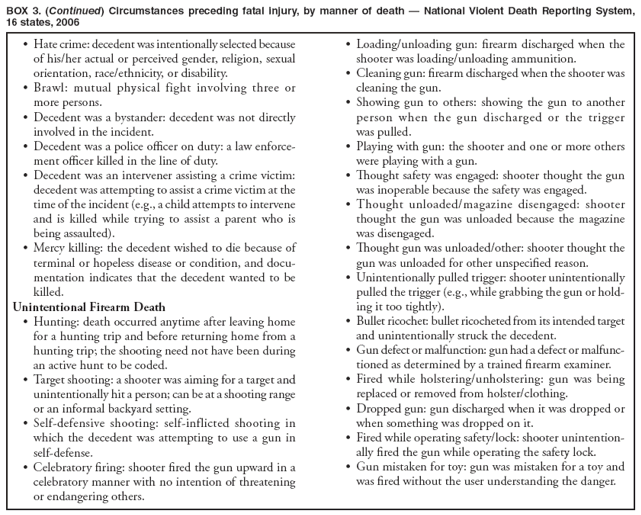 Return to top. Table 4 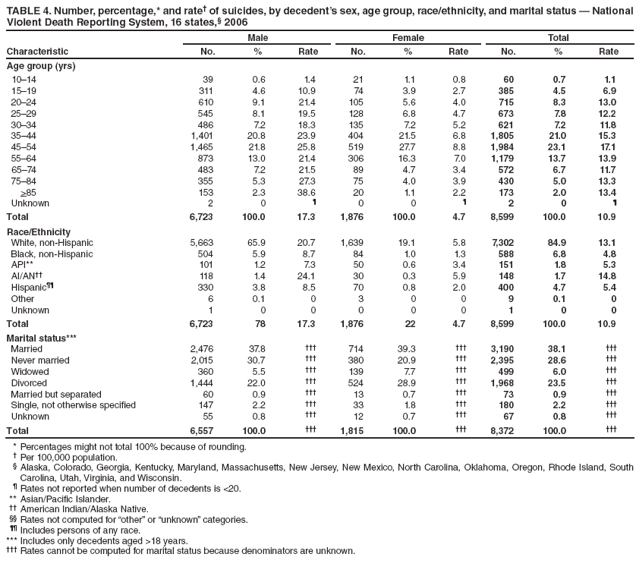 Return to top. Table 5 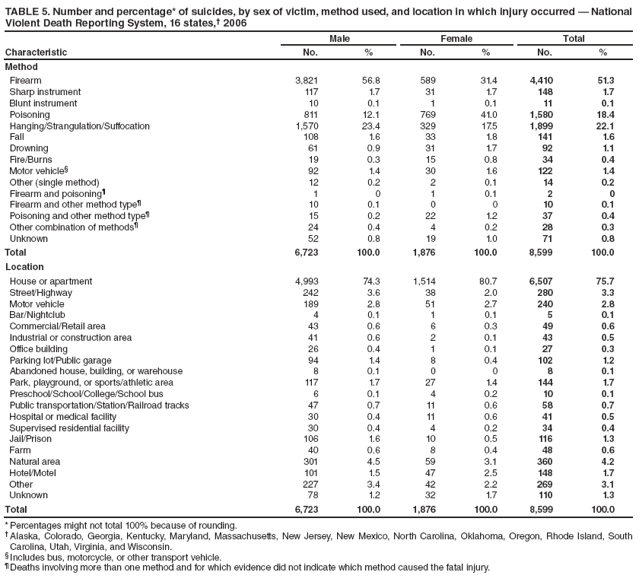 Return to top. Table 6 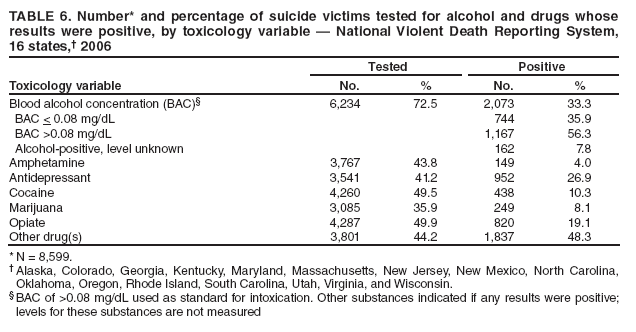 Return to top. Table 7 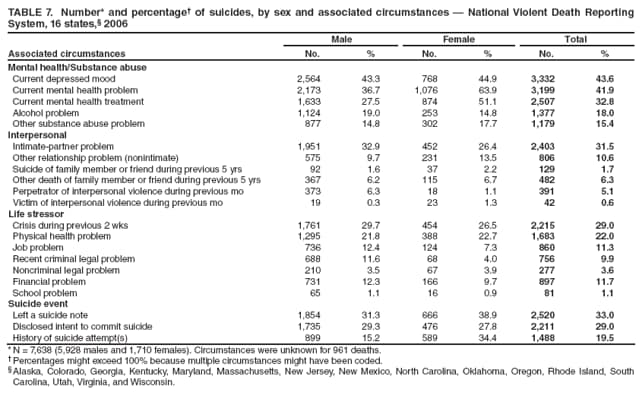 Return to top. Table 8 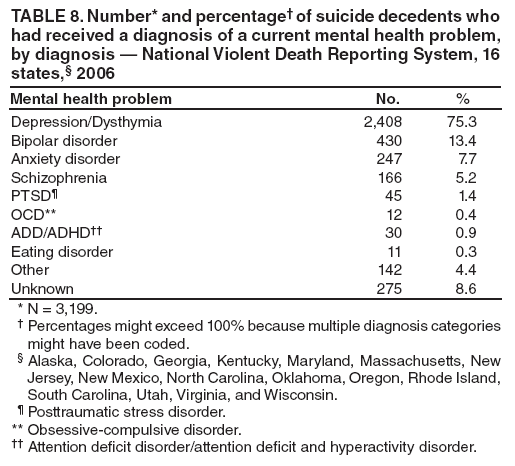 Return to top. Table 9 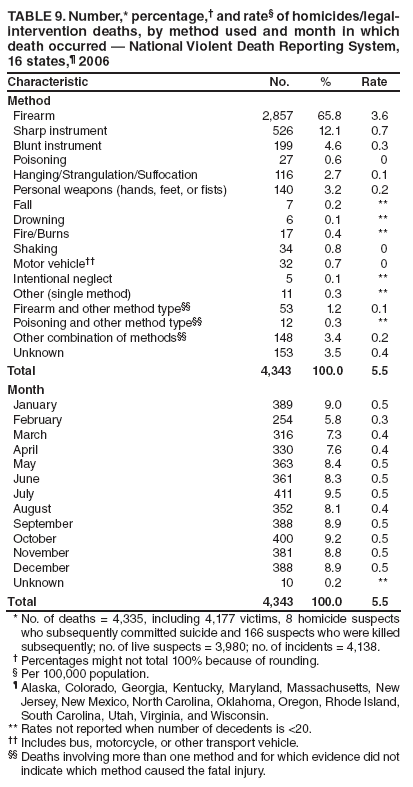 Return to top. Table 10 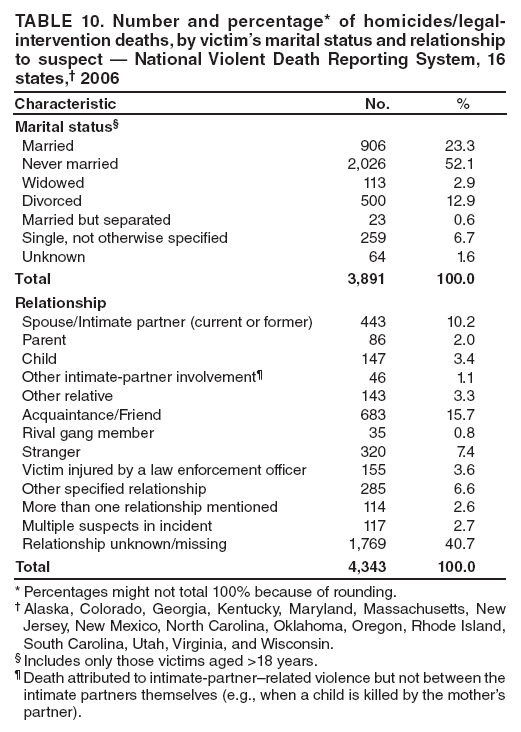 Return to top. Table 11 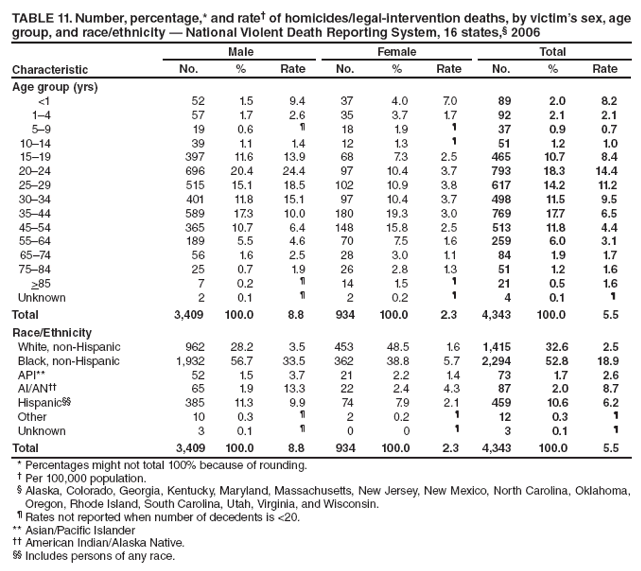 Return to top. Table 12 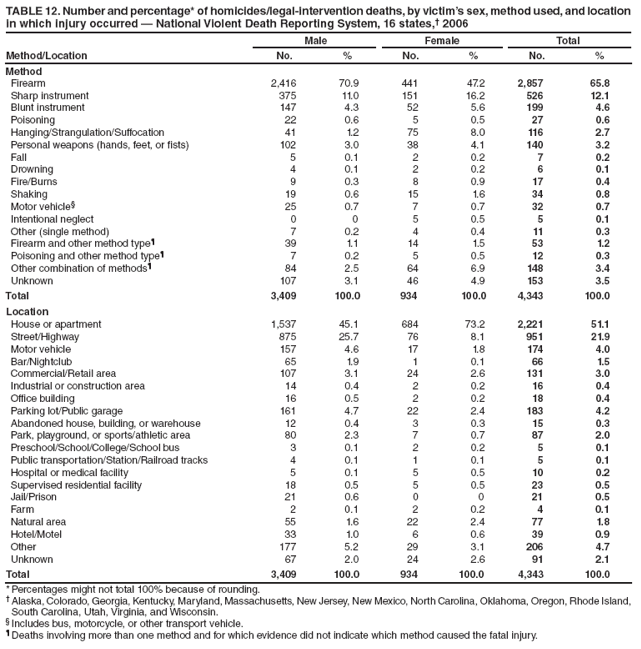 Return to top. Table 13 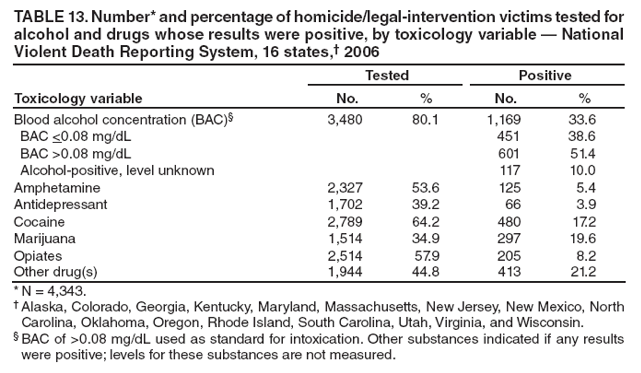 Return to top. Table 14 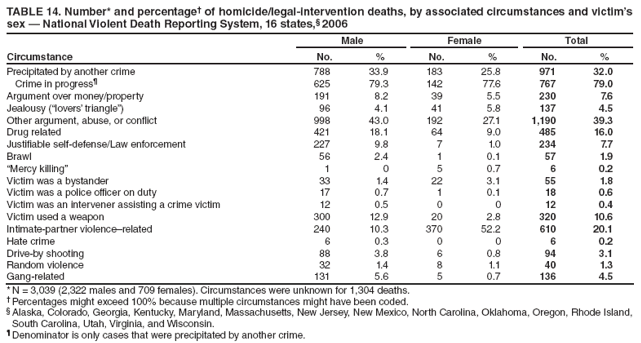 Return to top. Table 15 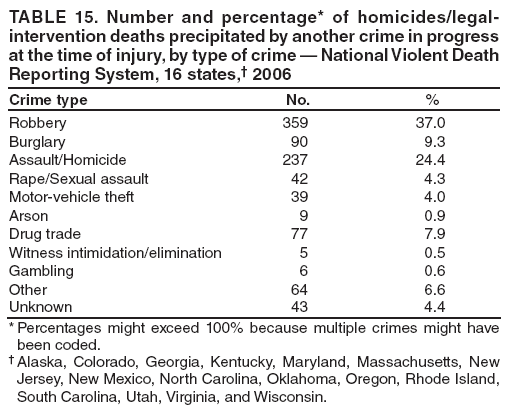 Return to top. Table 16 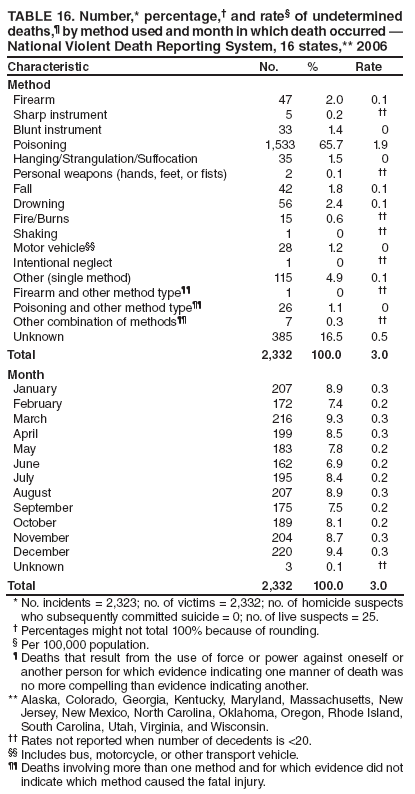 Return to top. Table 17 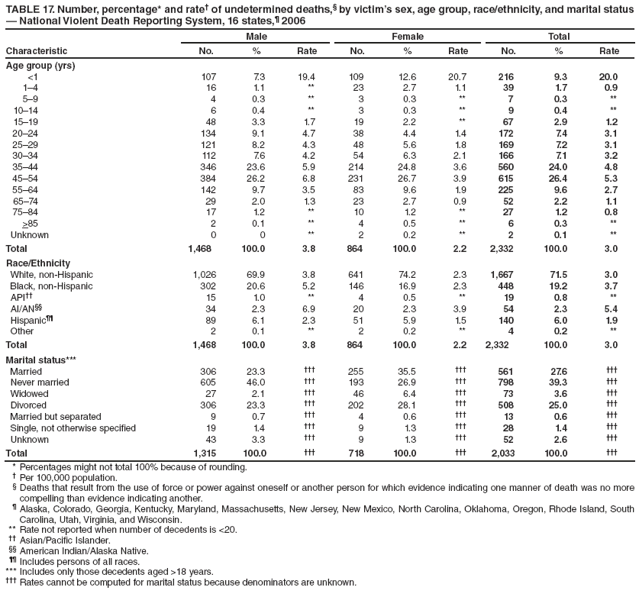 Return to top. Table 18 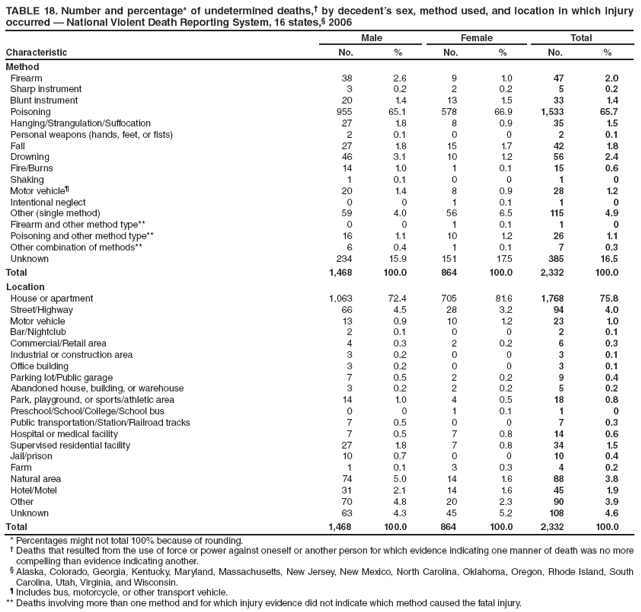 Return to top. Table 19 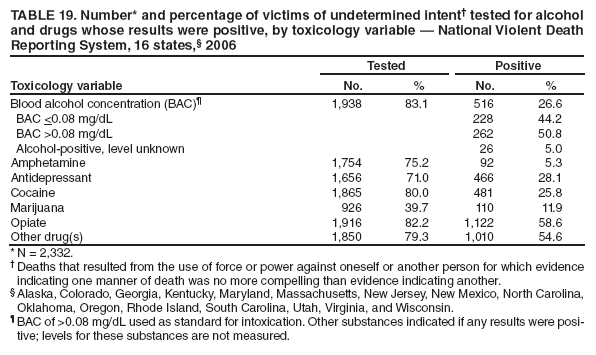 Return to top. Table 20 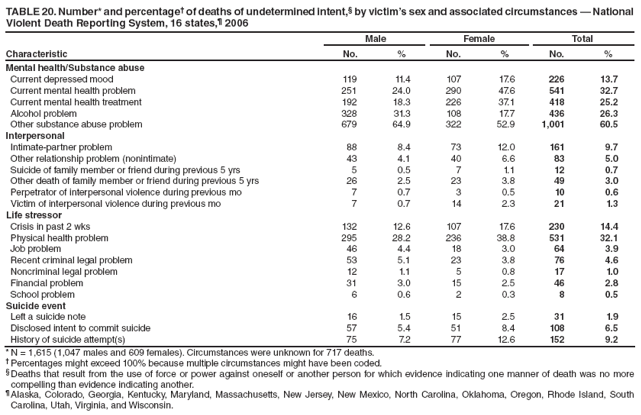 Return to top. Table 21 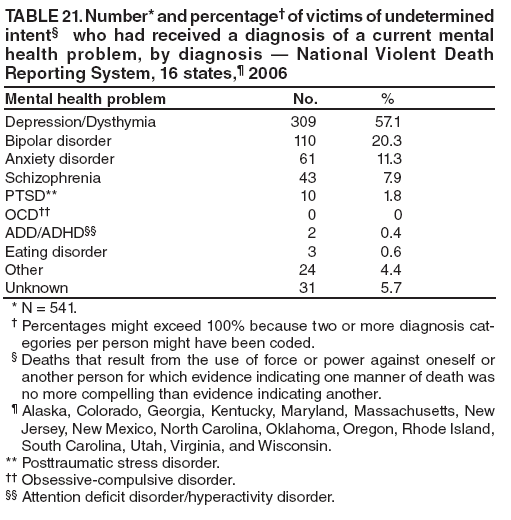 Return to top. Table 22 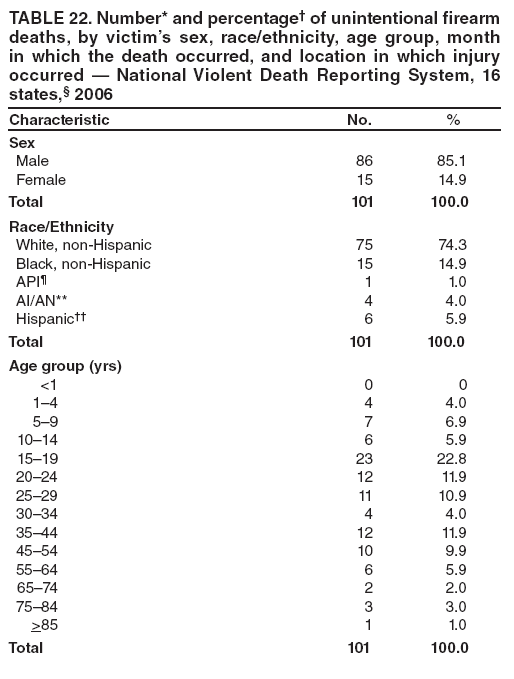
 Return to top. Table 23 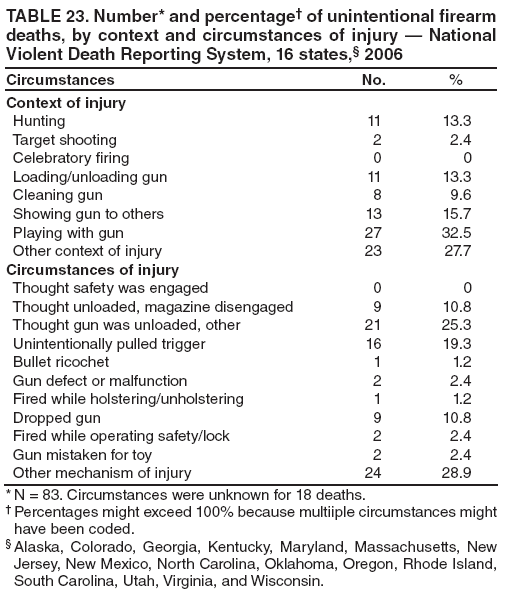 Return to top. Table 24 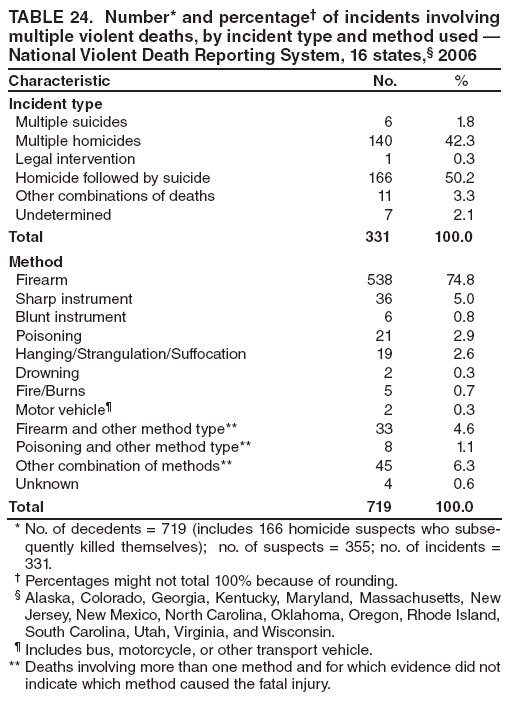 Return to top. Table 25 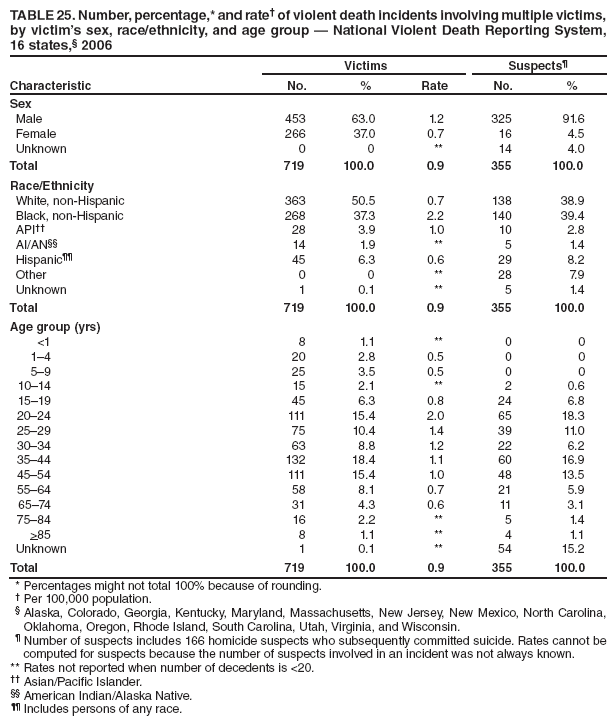 Return to top. Table 26 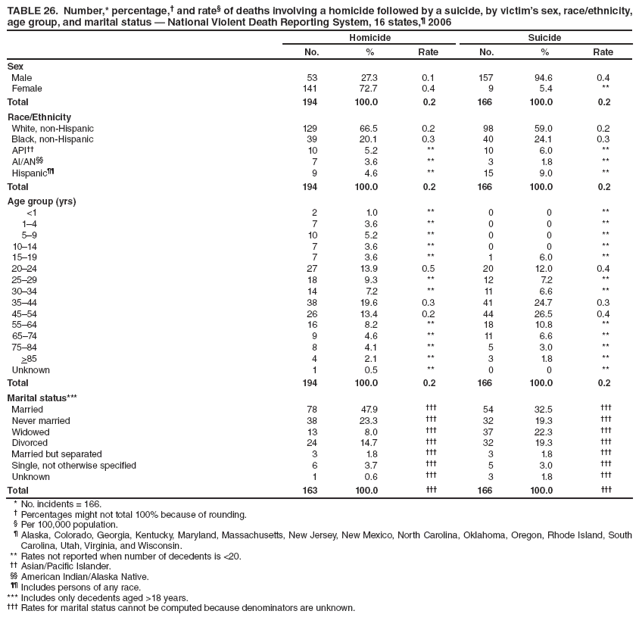 Return to top. Table 27 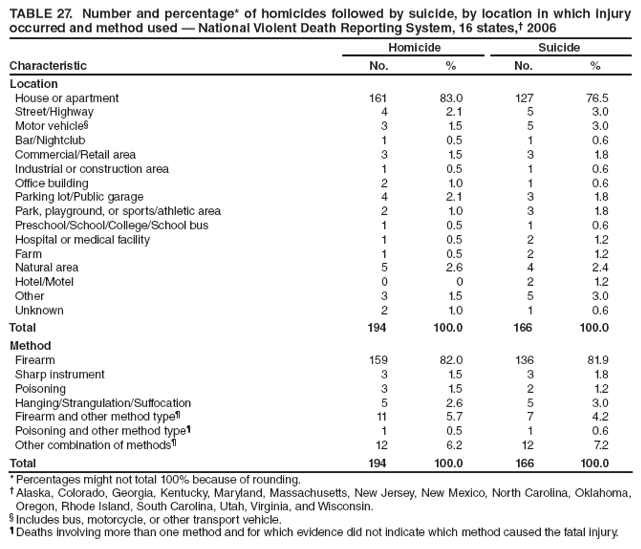 Return to top. Table 28 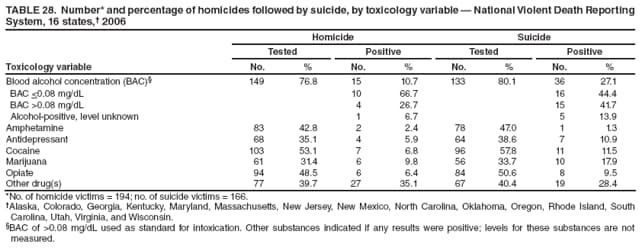 Return to top. Table 29 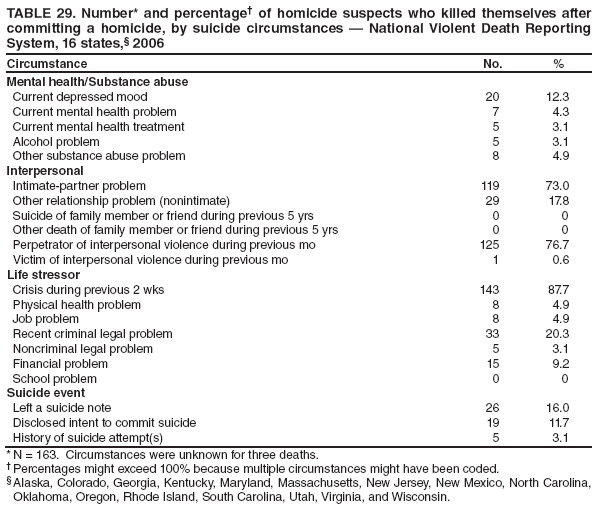 Return to top. Table 30 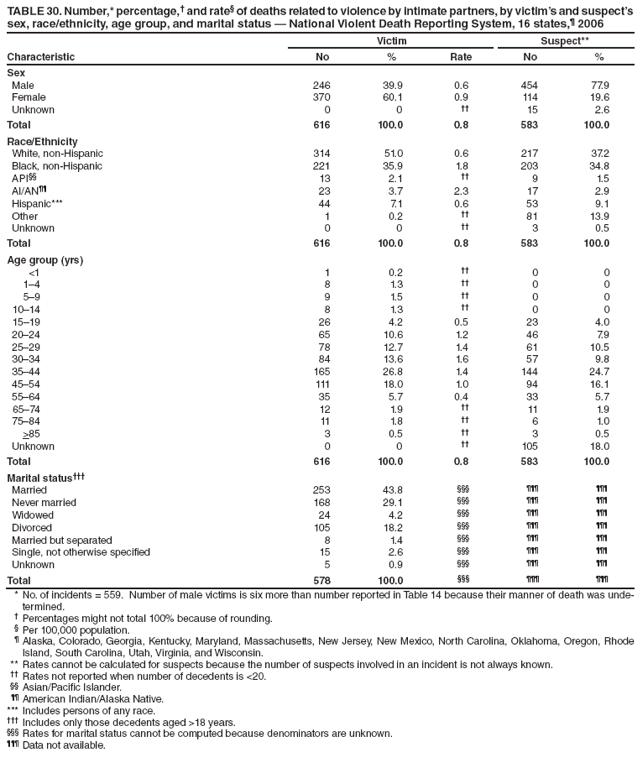 Return to top. Table 31 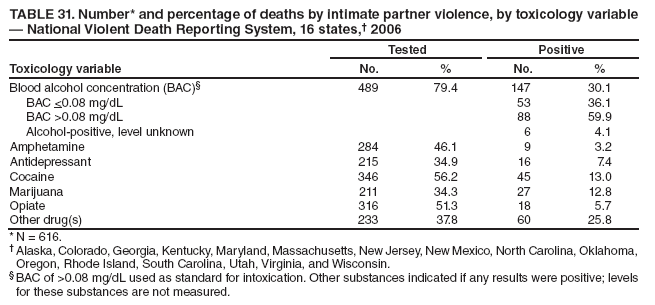 Return to top. Table 32 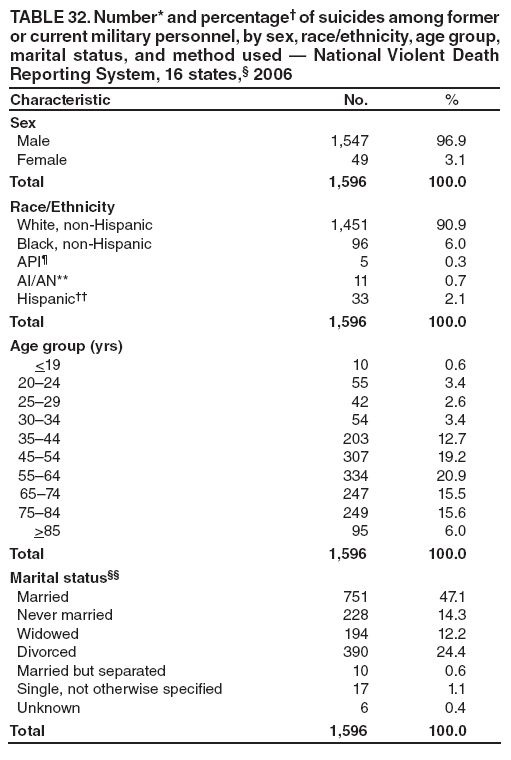
 Return to top. Table 33 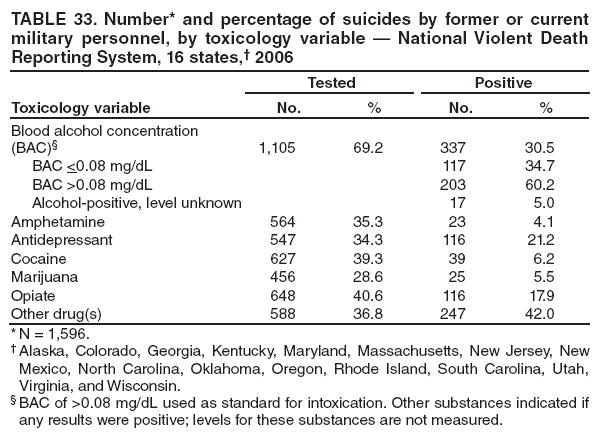 Return to top. Table 34 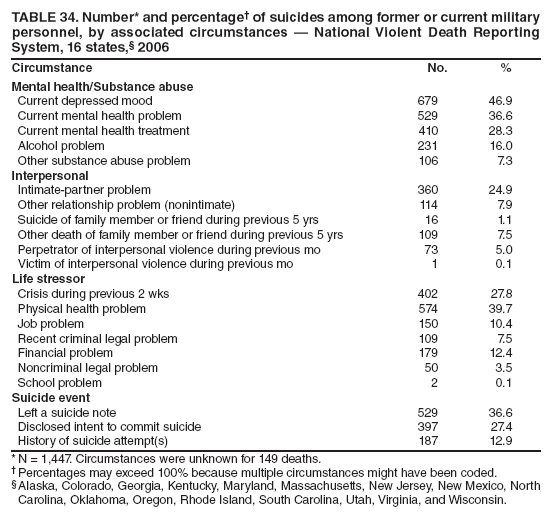 Return to top. Table 35 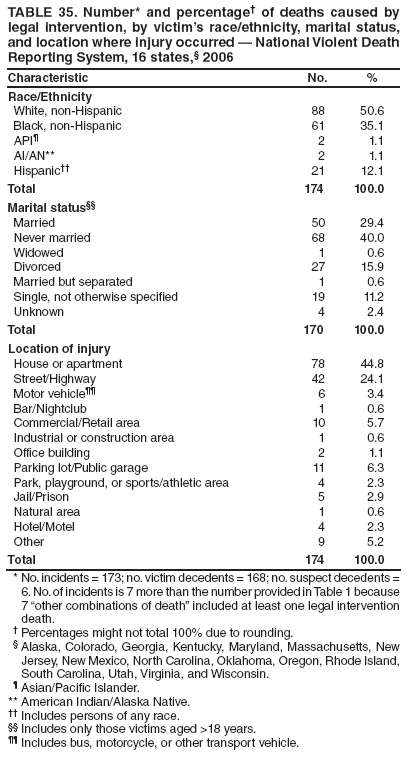 Return to top. Table 36 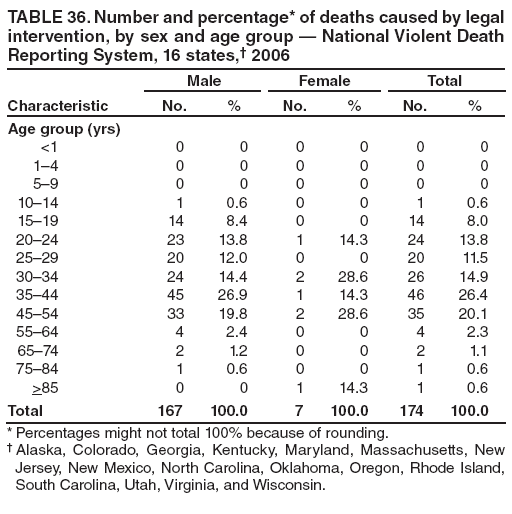 Return to top. Table 37 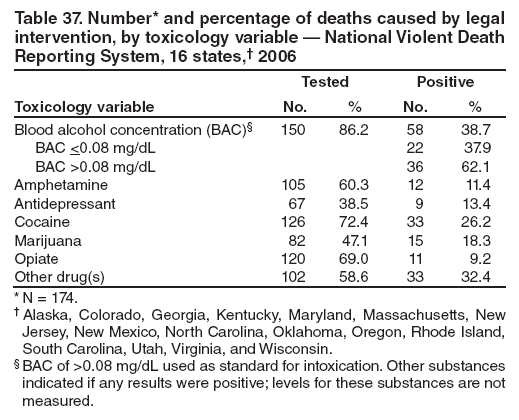 Return to top. Table 38 
 Return to top. Table 39 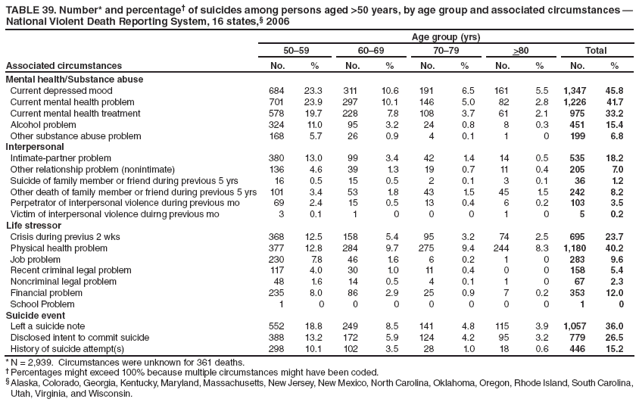 Return to top. Figure 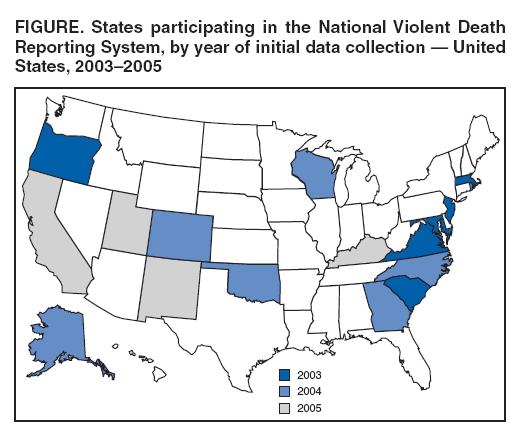 Return to top.
All MMWR HTML versions of articles are electronic conversions from typeset documents. This conversion might result in character translation or format errors in the HTML version. Users are referred to the electronic PDF version (http://www.cdc.gov/mmwr) and/or the original MMWR paper copy for printable versions of official text, figures, and tables. An original paper copy of this issue can be obtained from the Superintendent of Documents, U.S. Government Printing Office (GPO), Washington, DC 20402-9371; telephone: (202) 512-1800. Contact GPO for current prices. **Questions or messages regarding errors in formatting should be addressed to mmwrq@cdc.gov.Date last reviewed: 3/18/2009 |
|||||||||
|