Trends in HIV-Related Risk Behaviors Among High School Students — United States, 1991–2011
One of the three primary goals of the National HIV/AIDS Strategy for the United States is to reduce the number of persons who become infected with human immunodeficiency virus (HIV) (1). In 2009, persons aged 15–29 years comprised 21% of the U.S. population but accounted for 39% of all new HIV infections (2). Sexual intercourse, sexual intercourse with multiple partners, sexual intercourse without using a condom, and injection drug use are behaviors that increase risk for HIV infection. To describe trends in the prevalence of HIV-related risk behaviors among high school students, CDC analyzed data from the biennial national Youth Risk Behavior Survey (YRBS) for the period 1991–2011. The results of that analysis indicated that, although the percentage of students overall who had ever had sexual intercourse decreased significantly from 54.1% in 1991 to 47.4% in 2011, the prevalence of ever having had sexual intercourse did not change significantly after reaching 45.6% in 2001. Similarly, although the percentage of students who had four or more sex partners decreased significantly from 18.7% in 1991 to 15.3% in 2011, the prevalence of having four or more sex partners did not change significantly after reaching 14.2% in 2001. Condom use at most recent sexual intercourse among students currently having sexual intercourse increased from 46.2% in 1991 to 60.2% in 2011. However, the prevalence of condom use did not change significantly beginning in 2003 (63.0%). The prevalence of injection drug use among students overall did not change significantly from 1995 (2.1%) to 2011 (2.3%). The results suggest that progress in reducing some HIV-related risk behaviors among high school students overall and in certain populations stalled in the past decade. To reduce the number of young persons who become infected with HIV, renewed educational efforts and other risk reduction interventions are warranted.
The national YRBS, a component of CDC's Youth Risk Behavior Surveillance System, used independent, three-stage cluster samples for the 1991–2011 biennial surveys to obtain cross-sectional data representative of public and private school students in grades 9–12 in all 50 states and the District of Columbia (3). Sample sizes in the surveys ranged from 10,904 to 16,410. School response rates ranged from 70% to 81%, student response rates ranged from 83% to 90%, and overall response rates* ranged from 60% to 71%.
For each survey, students completed anonymous, self-administered questionnaires that included identically worded questions about their sexual experience, number of sexual intercourse partners, current sexual intercourse, condom use, and injection drug use.† Sexual experience was defined as ever having had sexual intercourse. Having multiple sex partners was defined as having sexual intercourse with four or more persons during their life. Current sexual activity was defined as having sexual intercourse with at least one person during the 3 months before the survey. Condom use was defined as using a condom during the most recent sexual intercourse among currently sexually active students. Injection drug use was defined as using a needle to inject any illegal drug into their body one or more times during their life. Data by race/ethnicity are presented for black, white, and Hispanic students only. The three populations are mutually exclusive. All black and white students were non-Hispanic; Hispanic students might be of any race. The numbers of students from other racial/ethnic populations were too small for meaningful trend analysis.
Data were weighted to provide national estimates, and the statistical software used for all analyses accounted for the complex sample design. Changes over time during 1991–2011 were analyzed using logistic regression analyses that controlled for sex, race/ethnicity, and grade and simultaneously assessed significant (p<0.05) linear and quadratic time effects.§ T-tests were used to test for significant (p<0.05) differences between prevalence estimates for 2009 and those for 2011.
During 1991–2011, a significant linear decrease occurred in the prevalence of sexual experience overall and among male, female, black, and white high school students (overall: 54.1% to 47.4%; male: 57.4% to 49.2%; female: 50.8% to 45.6%; black: 81.5% to 60.0%; and white: 50.0% to 44.3%) (Table). Among Hispanic students, no significant change was detected. Overall and among male and white students a significant quadratic trend also occurred. Overall, the prevalence of sexual experience decreased during 1991–2001 and then did not change significantly during 2001–2011 (54.1% to 45.6%, and then 47.4%). Among male students, the prevalence of sexual experience decreased during 1991–1997 and then did not change significantly during 1997–2011 (57.4% to 48.9% and then 49.2%), and among white students the prevalence of sexual experience decreased during 1991–2003 and then did not change significantly during 2003–2011 (50.0% to 41.8% and then 44.3%). The prevalence of sexual experience was lower in 2011 compared with 2009 among black students (65.2% to 60.0%), but not but not overall or among either sex or any other racial/ethnic population.
A significant linear decrease occurred during 1991–2011 in the prevalence of having four or more sex partners overall and among male, female, black, and white high school students (overall: 18.7% to 15.3%; male: 23.4% to 17.8%; female: 13.8% to 12.6%; black: 43.1% to 24.8%; and white: 14.7% to 13.1%) (Table, Figure 1). Among Hispanic students, no significant change was detected. Overall and among male and white students a significant quadratic trend also occurred. Overall, the prevalence of having four or more sex partners decreased during 1991–2001 and then did not change significantly during 2001–2011 (18.7% to 14.2% and then 15.3%). Among male students, the prevalence of having four or more sex partners decreased during 1991–2005 and then did not change significantly during 2005–2011 (23.4% to 16.5% and then 17.8%), and among white students the prevalence of having four or more sex partners decreased during 1991–2003 and then did not change significantly during 2003–2011 (14.7% to 10.8% and then 13.1%). The prevalence of having four or more sex partners was higher in 2011 compared with 2009 among white students (13.1% to10.5%), but not overall or among either sex or any other racial/ethnic population.
During 1991–2011, a significant linear decrease occurred in the prevalence of current sexual activity overall and among male, female, and black high school students (overall: 37.5% to 33.7%; male: 36.8% to 33.3%; female: 38.2% to 34.2%; and black: 59.3% to 41.3%) (Table). Among Hispanic and white students, no significant change was detected. The prevalence of current sexual activity was lower in 2011 (41.3%) compared with 2009 (47.7%) among black students, but not overall or among either sex or any other racial/ethnic population.
A significant linear increase occurred during 1991–2011 in the prevalence of condom use among currently sexually active students overall and among both sexes and all three racial/ethnic populations (overall: 46.2% to 60.2%; male: 54.5% to 67.0%; female: 38.0% to 53.6%; black: 48.0% to 65.3%; Hispanic: 37.4% to 58.4%; and white: 46.5% to 59.5%) (Table, Figure 2). In addition, a significant quadratic trend occurred overall and among both sexes and all three racial/ethnic populations. Overall and among female and white students, condom use increased during 1991–2003 and then did not change significantly during 2003–2011 (overall: 46.2% to 63.0% and then 60.2%; female: 38.0% to 57.4% and then 53.6%; and white: 46.5% to 62.5% and then 59.5%). Among male students, condom use increased during 1991–2005 and then did not change significantly during 2005–2011 (54.5% to 70.0% and then 67.0%). Among Hispanic students, condom use increased during 1991–2007 and then did not change significantly during 2007–2011 (37.4% to 61.4% and then 58.4%). Among black students, condom use increased during 1991–1999 and then decreased during 1999–2011 (48.0% to 70.0% to 65.3%).
During 1995–2011, a significant linear increase occurred in the prevalence of injection drug use among black and Hispanic students (black: 1.1% to 2.4%; and Hispanic: 2.2% to 2.9%) (Table). Overall and among male, female, and white students, no significant change was detected.
Reported by
Laura Kann, PhD, Richard Lowry, MD, Danice Eaton, PhD, Howell Wechsler, EdD, Div of Adolescent and School Health, National Center for HIV/AIDS, Viral Hepatitis, STD, and TB Prevention, CDC. Corresponding contributor: Laura Kann, lkann@cdc.gov, 770-488- 6181.
Editorial Note
The findings in this report suggest that previously reported progress in reducing some HIV-related risk behaviors among students (4) stalled overall and among certain populations of students. Most concerning are the decrease in condom use among black students since 1999 and the lack of any significant decrease since 1991 in the percentage of Hispanic students who have had sexual intercourse, four or more sex partners, and current sexual activity.
Another of the three primary goals of the National HIV/AIDS Strategy for the United States is to reduce HIV-related health disparities. In 1991, a gap of 32 percentage points was observed in sexual experience prevalence between black and white students (black: 81.5%; white: 50.0%). In 2011, this gap had been reduced to 16 percentage points (black: 60.0%; white: 44.3%). Large differences between black and white students in the prevalence of having four or more sex partners and current sexual activity also have been reduced over time. Nonetheless, black students still report significantly higher prevalence of sexual risk behaviors than white or Hispanic students and remain at increased risk for HIV infection and sexually transmitted diseases, a finding that underscores the importance of the decreasing trend in condom use among black students since 1999. YRBS data cannot isolate the effects of race/ethnicity from the effects of other factors on the prevalence of HIV-related behaviors. Additional research is needed to assess the effects of education, socioeconomic status, and cultural factors on the prevalence of these behaviors and to help intensify HIV prevention efforts in the communities where HIV infection is most heavily concentrated (1).
The findings in this report are subject to at least two limitations. First, these data apply only to youths who attend school and therefore are not representative of all persons in this age group. Nationwide, in 2009, of persons aged 16–17 years, approximately 4% were not enrolled in a high school program and had not completed high school (5). Second, the extent of underreporting or overreporting of self-reported behaviors cannot be determined, although the survey questions demonstrate good test-retest reliability (6).
The National HIV/AIDS Strategy for the United States recommends educating young persons about HIV before they begin engaging in behaviors that place them at risk for HIV infection (1), and the Community Preventive Services Task Force recommends risk reduction interventions to prevent HIV infection among adolescents (7). Although in another study a median of 90% of all public secondary schools in 45 states taught HIV prevention in a required course during 2010, the percentage that taught 16 specific topics varied widely (8).
To achieve the National HIV/AIDS Strategy for the United States goal of reducing the number of persons who become infected with HIV, further improvements in the prevalence of behaviors that contribute to HIV infection among young persons are needed. Renewed educational efforts that reach all students before risk behaviors are initiated and that seek to delay the onset of sexual activity, increase condom use among students who are sexually active, and decrease injection drug use are warranted.
References
- Office of National AIDS Policy. National HIV/AIDS strategy for the United States. Washington, DC: The White House, Office of National AIDS Policy; 2010. Available at http://www.whitehouse.gov/sites/default/files/uploads/NHAS.pdf. Accessed July 20, 2012.
- CDC. HIV among youth. Atlanta, GA: US Department of Health and Human Services, CDC; 2011. Available at http://www.cdc.gov/hiv/youth/index.htm. Accessed July 20, 2012.
- CDC. Youth Risk Behavior Surveillance—United States, 2011. MMWR 2012;61(No. SS-4).
- Eaton DK, Lowry R, Brener ND, Kann L, Romero L, Wechsler H. Trends in human immunodeficiency virus- and sexually transmitted disease-related risk behaviors among U.S. high school students, 1991–2009. Am J Prev Med 2011;40:427–33.
- National Center for Education Statistics. Common core of data: public elementary/secondary school universe survey. Washington, DC: US Department of Education, National Center for Education Statistics. Available at hhtp://nces.ed.gov/ccd. Accessed July 20, 2012.
- Brener ND, Kann L, McManus T, Kinchen SA, Sundberg EC, Ross JG. Reliability of the 1999 Youth Risk Behavior Survey questionnaire. J Adolesc Health 2002;31:336–42.
- CDC. Guide to community preventive services. Prevention of HIV/AIDS, other STIs and pregnancy: group-based comprehensive risk reduction interventions for adolescents. Atlanta, GA: US Department of Health and Human Services, CDC; 2010. Available at http://www.thecommunityguide.org/hiv/riskreduction.html. Accessed July 20, 2012.
- CDC. HIV, other STD, and pregnancy prevention education in public secondary schools—45 states, 2008–2010. MMWR 2012;61:222–8.
* Overall response rate = (number of participating schools/number of eligible sampled schools) x (number of usable questionnaires/number of eligible students sampled).
† The YRBS questions were as follows: "Have you ever had sexual intercourse?" "During your life, with how many people have you had sexual intercourse?" "During the past 3 months, with how many people did you have sexual intercourse?" "The last time you had sexual intercourse, did you or your partner use a condom?" and "During your life, how many times have you used a needle to inject any illegal drug into your body?" The wording of the question on injection drug use changed substantially after the 1993 survey, so 1991 and 1993 data on injection drug use are not included in this report.
§ A quadratic time effect indicates a significant but nonlinear trend in prevalence over time. Whereas a linear trend is depicted with a straight line, a quadratic trend is depicted with a curve with one bend. A temporal change that includes a significant linear and quadratic time effect demonstrates nonlinear variation (e.g., leveling off or change in direction of prevalence) in addition to an overall increase or decrease in prevalence over time.
What is already known on this topic?
One of the three primary goals of the National HIV/AIDS Strategy for the United States is to reduce the number of persons who become infected with human immunodeficiency virus (HIV). In 2009, young persons aged 15–29 years comprised 21% of the U.S. population but accounted for 39% of all new HIV infections.
What is added by this report?
Overall, decreases in sexual experience and having four or more sex partners did not change significantly beginning in 2001, and increases in condom use did not change significantly beginning in 2003.
What are the implications for public health practice?
To achieve the National HIV/AIDS Strategy for the United States goal of reducing the number of persons who become infected with HIV, renewed educational efforts that reach all students before HIV-related risk behaviors are initiated and that seek to delay the onset of sexual activity, increase condom use among students who are sexually active, and decrease injection drug use are warranted.
|
TABLE. (Continued) Percentage of high school students who reported HIV-related risk behaviors, by sex, race/ethnicity, and survey year — Youth Risk Behavior Surveys, United States, 1991–2011 |
|||||||||||
|---|---|---|---|---|---|---|---|---|---|---|---|
|
Characteristic |
Survey year |
Ever had sexual intercourse |
Had sexual intercourse with four or more persons during their life |
Currently sexually active* |
Condom use† |
Ever injected and illegal drug¶ |
|||||
|
% |
(95% CI) |
% |
(95% CI) |
% |
(95% CI) |
% |
(95% CI) |
% |
(95% CI) |
||
|
Race/ethnicity** |
|||||||||||
|
Black |
1991 |
81.5 |
(78.0–84.5) |
43.1 |
(39.5–46.7) |
59.3 |
(55.3–63.1) |
48.0 |
(44.1–51.9) |
NA |
— |
|
1993 |
79.7 |
(76.2–82.7) |
42.7 |
(38.8–46.7) |
59.1 |
(54.6–63.5) |
56.5 |
(52.6–60.3) |
NA |
— |
|
|
1995 |
73.4 |
(68.4–77.8) |
35.6 |
(31.2–40.3) |
54.2 |
(49.4–59.0) |
66.1 |
(61.0–70.9) |
1.1 |
(0.6–2.0) |
|
|
1997 |
72.7 |
(69.7–75.4) |
38.5 |
(34.9–42.3) |
53.6 |
(50.3–56.9) |
64.0 |
(61.0–66.8) |
1.0 |
(0.5–2.0) |
|
|
1999 |
71.2 |
(62.2–78.8) |
34.4 |
(24.7–45.7) |
53.0 |
(43.8–62.0) |
70.0 |
(64.1–75.2) |
0.9 |
(0.5–1.6) |
|
|
2001 |
60.8 |
(53.9–67.4) |
26.6 |
(22.9–30.6) |
45.6 |
(40.1–51.2) |
67.1 |
(63.4–70.6) |
1.6 |
(1.0–2.5) |
|
|
2003 |
67.3 |
(63.7–70.6) |
28.8 |
(26.3–31.5) |
49.0 |
(46.0–52.0) |
72.8 |
(68.8–72.4) |
2.4 |
(1.5–3.9) |
|
|
2005 |
67.6 |
(64.4–70.7) |
28.2 |
(25.6–30.9) |
47.4 |
(44.7–50.1) |
68.9 |
(65.0–72.5) |
1.7 |
(0.9–3.0) |
|
|
2007 |
66.5 |
(63.0–69.9) |
27.6 |
(24.8–30.6) |
46.0 |
(42.3–49.7) |
67.3 |
(62.6–71.6) |
1.8 |
(1.2–2.6) |
|
|
2009 |
65.2 |
(62.0–68.3) |
28.6 |
(25.5–32.0) |
47.7 |
(44.2–51.2) |
62.4 |
(57.9–66.8) |
2.4 |
(1.7–3.4) |
|
|
2011 |
60.0 |
(56.6–63.4)¶ |
24.8 |
(22.4–27.3)¶ |
41.3 |
(38.4–44.3)¶ |
65.3 |
(60.4–69.9)¶** |
2.4 |
(1.7–3.5)¶ |
|
|
White |
1991 |
50.0 |
(46.7–53.4) |
14.7 |
(13.0–16.7) |
33.9 |
(31.1–36.9) |
46.5 |
(41.8–51.2) |
NA |
— |
|
1993 |
48.4 |
(45.6–51.3) |
14.3 |
(12.3–16.6) |
34.0 |
(31.9–36.2) |
52.3 |
(48.2–56.3) |
NA |
— |
|
|
1995 |
48.9 |
(43.8–54.1) |
14.2 |
(11.8–16.8) |
34.8 |
(30.8–39.0) |
52.5 |
(48.4–56.6) |
2.0 |
(1.5–2.7) |
|
|
1997 |
43.6 |
(39.4–48.0) |
11.6 |
(10.2–13.2) |
32.0 |
(29.0–35.3) |
55.8 |
(53.8–57.8) |
1.8 |
(1.4–2.4) |
|
|
1999 |
45.1 |
(41.1–49.2) |
12.4 |
(10.4–14.7) |
33.0 |
(29.0–36.5) |
55.0 |
(49.8–60.2) |
1.6 |
(1.2–2.1) |
|
|
2001 |
43.2 |
(40.7–45.8) |
12.0 |
(10.6–13.5) |
31.3 |
(29.0–33.6) |
56.8 |
(53.7–59.9) |
2.4 |
(2.0–2.9) |
|
|
2003 |
41.8 |
(39.0–44.5) |
10.8 |
(9.4–12.4) |
30.8 |
(28.7–32.9) |
62.5 |
(59.2–65.6) |
2.5 |
(1.5–4.3) |
|
|
2005 |
43.0 |
(38.8–47.3) |
11.4 |
(9.7–13.3) |
32.0 |
(28.7–35.5) |
62.6 |
(60.0–65.2) |
1.9 |
(1.6–2.3) |
|
|
2007 |
43.7 |
(40.5–47.0) |
11.5 |
(9.6–13.7) |
32.9 |
(30.3–35.5) |
59.7 |
(56.8–62.5) |
1.5 |
(1.0–2.3) |
|
|
2009 |
42.0 |
(37.9–46.3) |
10.5 |
(9.0–12.3) |
32.0 |
(28.8–35.3) |
63.3 |
(60.4–66.1) |
1.6 |
(1.2–2.1) |
|
|
2011 |
44.3 |
(41.1–47.4)¶** |
13.1 |
(11.7–14.5)¶** |
32.4 |
(29.7–35.3) |
59.5 |
(55.4–63.5)¶** |
1.9 |
(1.6–2.3) |
|
|
Hispanic |
1991 |
53.1 |
(49.4–56.7) |
16.8 |
(14.3–19.7) |
37.0 |
(33.4–40.8) |
37.4 |
(31.3–44.0) |
NA |
— |
|
1993 |
56.0 |
(51.8–60.2) |
18.6 |
(15.7–22.0) |
39.4 |
(35.6–43.3) |
46.1 |
(41.6–50.6) |
NA |
— |
|
|
1995 |
57.6 |
(48.6–66.1) |
17.6 |
(14.1–21.7) |
39.3 |
(32.3–46.8) |
44.4 |
(33.4–56.0) |
2.2 |
(1.4–3.4) |
|
|
1997 |
52.2 |
(48.4–55.8) |
15.5 |
(13.2–18.1) |
35.4 |
(31.5–39.5) |
48.3 |
(42.6–54.0) |
2.2 |
(1.6–2.9) |
|
|
1999 |
54.1 |
(49.0–59.0) |
16.6 |
(13.2 –18.1) |
36.3 |
(32.2–40.5) |
55.2 |
(48.1–62.0) |
1.8 |
(1.1–2.8) |
|
|
2001 |
48.4 |
(43.8–53.0) |
14.9 |
(13.2–16.7) |
35.9 |
(32.7–39.4) |
53.5 |
(48.2–58.7) |
2.5 |
(1.8–3.4) |
|
|
2003 |
51.4 |
(48.1–54.8) |
15.7 |
(13.5–18.1) |
37.1 |
(34.4–40.0) |
57.4 |
(51.9–62.8) |
3.9 |
(2.2–6.8) |
|
|
2005 |
51.0 |
(46.5–55.4) |
15.9 |
(13.6–18.5) |
35.0 |
(31.3–39.1) |
57.7 |
(53.4–61.8) |
3.0 |
(2.1–4.2) |
|
|
2007 |
52.0 |
(48.3–55.6) |
17.3 |
(15.2–19.5) |
37.4 |
(33.8–41.1) |
61.4 |
(56.7–65.9) |
3.1 |
(2.2–4.3) |
|
|
2009 |
49.1 |
(46.0–52.2) |
14.2 |
(12.7–15.9) |
34.6 |
(32.2–37.0) |
54.9 |
(51.7–58.0) |
3.1 |
(2.4–4.0) |
|
|
2011 |
48.6 |
(46.1–51.0) |
14.8 |
(13.6–16.0) |
33.5 |
(31.6–35.4) |
58.4 |
(54.0–62.7)¶** |
2.9 |
(2.2–3.8)¶ |
|
|
Abbreviations: HIV = human immunodeficiency virus; CI = confidence interval; NA = not available. * Had sexual intercourse with at least one person during the 3 months before the survey. † During most recent sexual intercourse among students who were currently sexually active. § Used a needle to inject any illegal drug into their body one or more times during their life. Wording of this question changed substantially after the 1993 survey, so 1991 and 1993 data are not included. ¶ Significant linear effect (p<0.05). ** Significant quadratic effect (p<0.05). †† Data by race/ethnicity are presented for black, white, and Hispanic students only. The three populations are mutually exclusive. All black and white students were non-Hispanic; Hispanic students might be of any race. The numbers of students from other racial/ethnic populations were too small for meaningful trend analysis. |
|||||||||||
FIGURE 1. Percentage of high school students who had sexual intercourse with four or more persons during their life, by race/ethnicity* — Youth Risk Behavior Surveys, United States, 1991–2011†
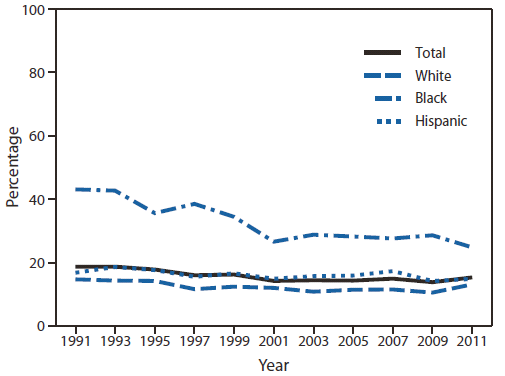
* Data by race/ethnicity are presented for black, white, and Hispanic students only. The three populations are mutually exclusive. All black and white students were non-Hispanic; Hispanic students might be of any race. The numbers of students from other racial/ethnic populations were too small for meaningful trend analysis.
† A significant linear effect (p<0.05) was observed for participants overall and for black and white students. A significant quadratic effect (p<0.05) was observed for participants overall and for white students.
Alternate Text: The figure above is a line graph showing the percentage of high school students surveyed during 1991-2011 who reported having sexual intercourse with four or more persons during their life, by race/ethnicity. Overall, the percentage was 18.7% in 1991 and 15.3% in 2011. For blacks, the percentage was 43.1% in 1991 and 24.8% in 2011. For whites, the percentage was 14.7% in 1991 and 13.1% in 2011. For Hispanics, the percentage was 16.8% in 1991 and 14.8% in 2011.
FIGURE 2. Percentage of sexually active high school students who used a condom during most recent sexual intercourse, by race/ethnicity* — Youth Risk Behavior Surveys, United States, 1991–2011†
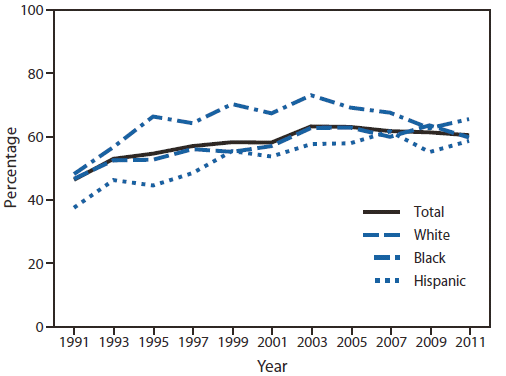
* Data by race/ethnicity are presented for black, white, and Hispanic students only. The three populations are mutually exclusive. All black and white students were non-Hispanic; Hispanic students might be of any race. The numbers of students from other racial/ethnic populations were too small for meaningful trend analysis.
† A significant linear effect (p<0.05) was observed for participants overall and for black, white, and Hispanic students. A significant quadratic effect (p<0.05) also was observed for participants overall and for black, white, and Hispanic students.
Alternate Text: The figure above is a line graph showing the percentage of high school students surveyed during 1991-2011 who reported using a condom during their most recent sexual intercourse, by race/ethnicity. Overall, the percentage was 46.2% in 1991 and 60.2% in 2011. For blacks, the percentage was 48.0% in 1991 and 65.3% in 2011. For whites, the percentage was 46.5% in 1991 and 59.5% in 2011. For Hispanics, the percentage was 37.4% in 1991 and 58.4% in 2011.
Use of trade names and commercial sources is for identification only and does not imply endorsement by the U.S. Department of
Health and Human Services. |
All MMWR HTML versions of articles are electronic conversions from typeset documents.
This conversion might result in character translation or format errors in the HTML version.
Users are referred to the electronic PDF version (http://www.cdc.gov/mmwr)
and/or the original MMWR paper copy for printable versions of official text, figures, and tables.
An original paper copy of this issue can be obtained from the Superintendent of Documents, U.S.
Government Printing Office (GPO), Washington, DC 20402-9371;
telephone: (202) 512-1800. Contact GPO for current prices.
**Questions or messages regarding errors in formatting should be addressed to
mmwrq@cdc.gov.
