At a glance
In 2024 in the United States and 7 territories and freely associated states, among persons aged ≥ 13 years, over 38,000 people received an HIV diagnosis. Men are most affected, making up 80% of diagnoses, with male-to-male sexual contact accounting for 65% of all diagnoses. Among males aged > 24 years, Hispanic/Latino males accounted for the highest percentage (40%) of diagnoses attributed to male-to-male sexual contact. Persons aged 25‒44 years accounted for 60% of diagnoses. Although non-Hispanic Black/African American (hereafter referred to as Black/African American) persons made up 12% of the U.S. population, they accounted for 39% of diagnoses. Regionally, the South continued to account for more than half (51%) of all diagnoses.
Current data release
Key findings
National overview
This release provides 2024 data on HIV diagnoses, deaths, and diagnosed prevalence in the United States and 7 territories and freely associated states (American Samoa, Commonwealth of the Northern Mariana Islands, Guam, Puerto Rico, Republic of the Marshall Islands, Republic of Palau, and U.S. Virgin Islands).
This data release presents the results of focused analyses of National HIV Surveillance System (NHSS) data used to measure and monitor progress toward U.S. national HIV prevention and care goals.
Important notes:
- Data are presented for persons with diagnosed HIV reported to the Centers for Disease Control and Prevention (CDC) through December 2025.
- Data are provisional with a 12-month reporting delay for assessing diagnoses, deaths, and diagnosed prevalence for the year 2024.
- An evaluation of surveillance data for diagnoses during 2020–2024 found that, on average, approximately 81% of HIV diagnoses were reported to CDC within the year of diagnosis, and approximately 98% were reported by the end of the following year.
- This release marks the first inclusion of data from the Republic of the Marshall Islands in numbers and rates of HIV diagnoses, deaths, and persons living with diagnosed HIV.
- Highlighted findings are based on 12 or more cases. Percentages are rounded to whole numbers unless otherwise indicated. Numbers less than 12, and percentages and rates based on these numbers, should be interpreted with caution.
- All rates are expressed per 100,000 population.
- Rates are not provided for transmission categories because denominator data are not available from the U.S. Census Bureau.
- This overview summarizes the data presented in this data release. For complete results, refer to the figures and tables. See NHSS Technical Notes information on definitions and data specifications.
- Additional stratifications and years of data can be accessed through NCHHSTP AtlasPlus.
HIV diagnoses
Among persons aged ≥ 13 years
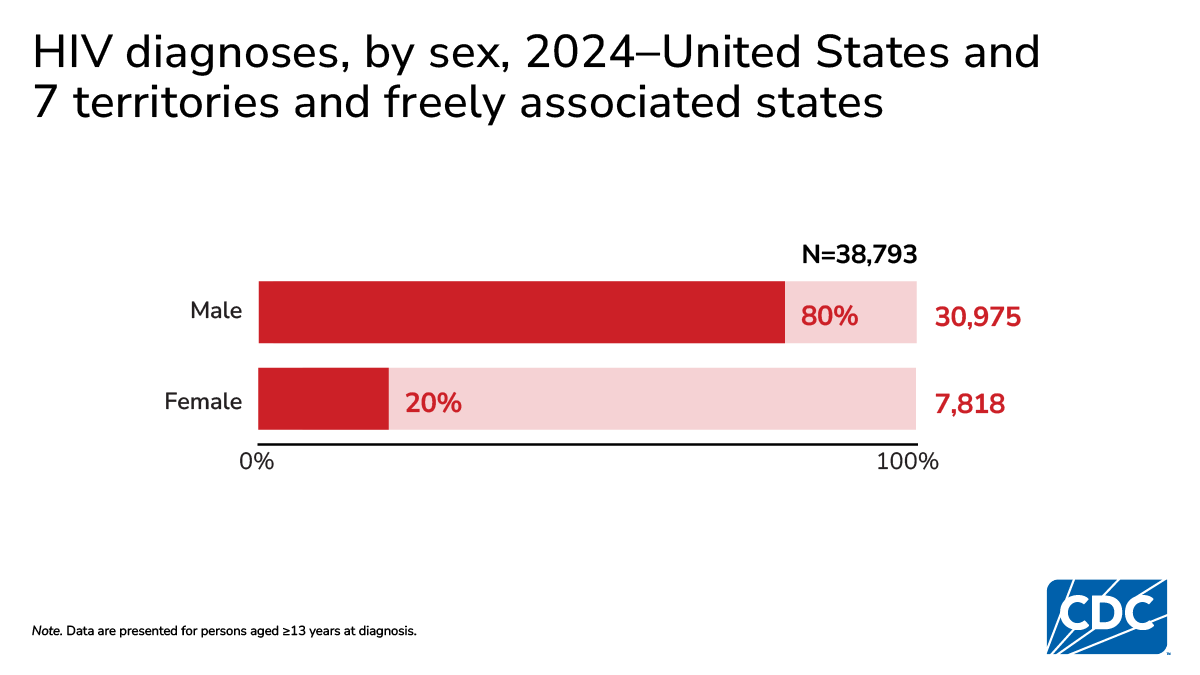
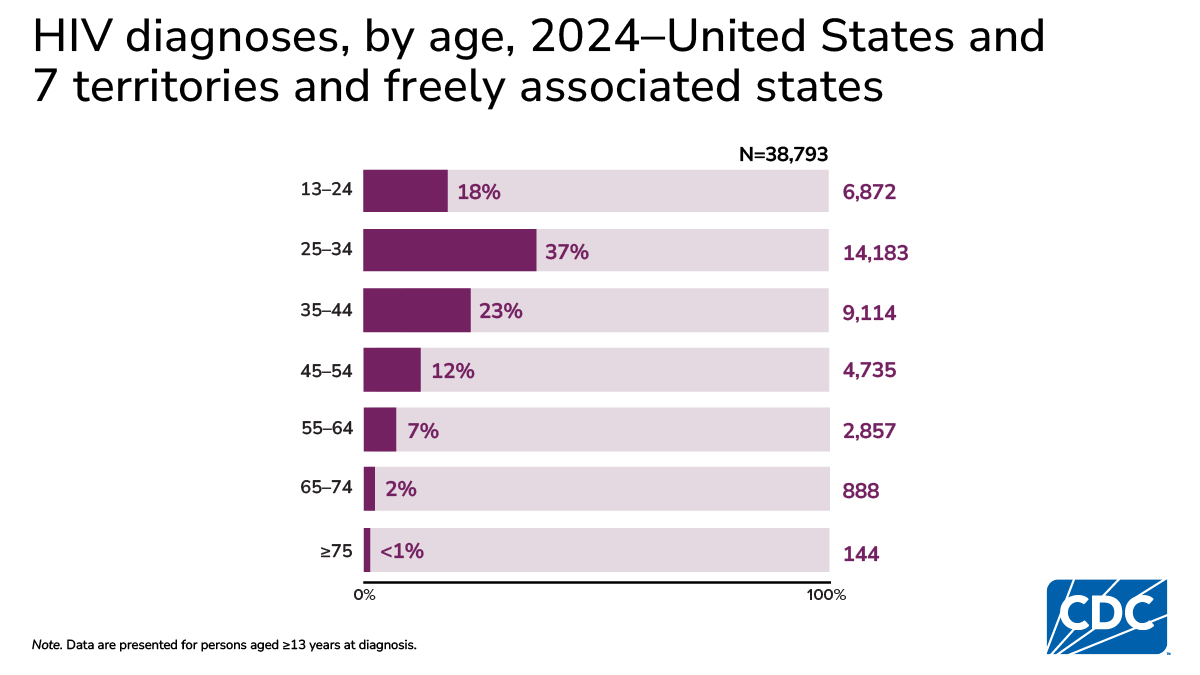
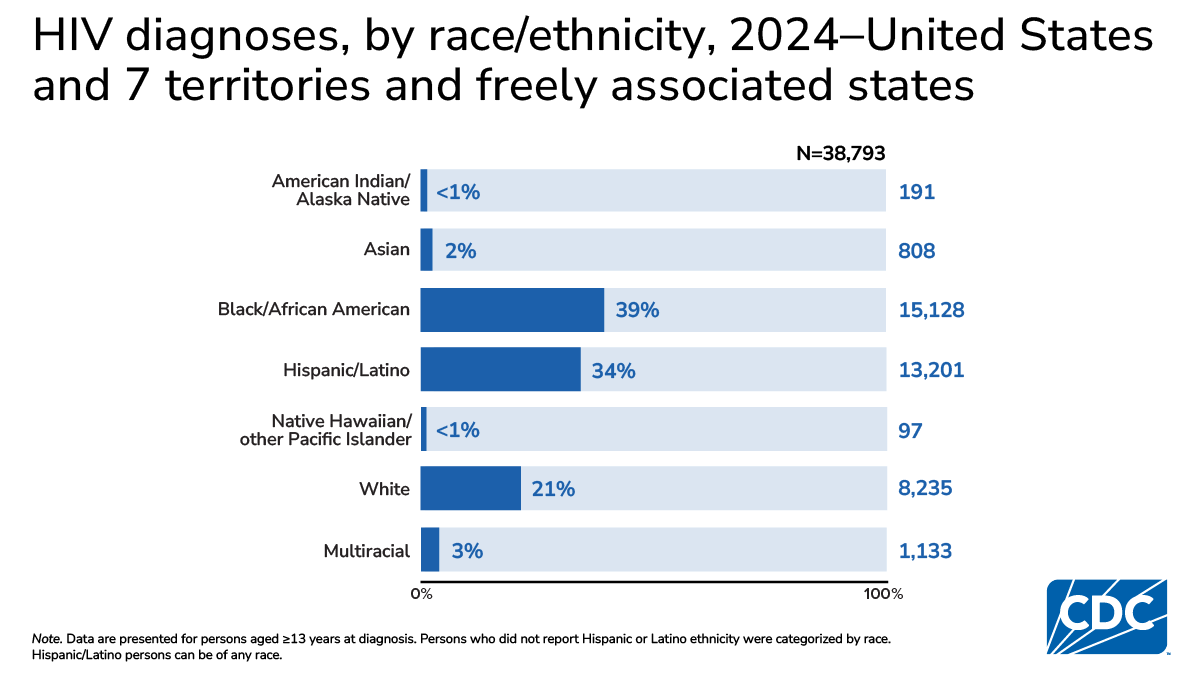
In 2024 in the United States and 7 territories and freely associated states, there were 38,793 HIV diagnoses.
Who is most affected
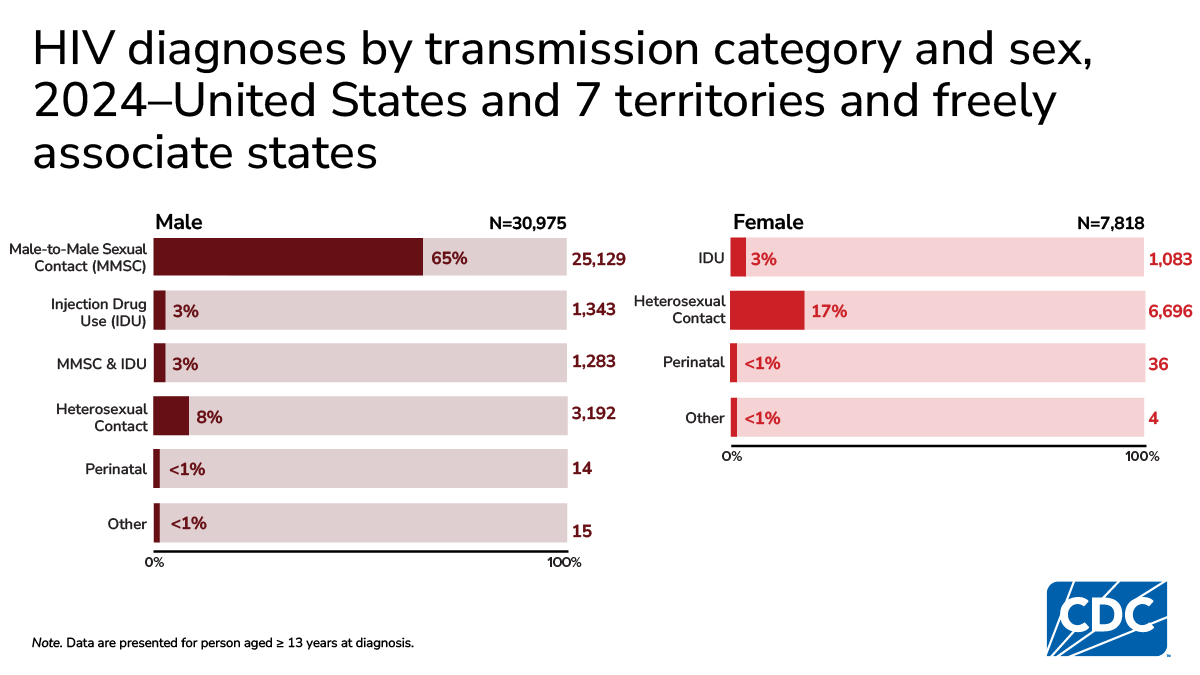
- males (30,975; 80%)
- persons aged 25–34 years (14,183; 37%)
- Black/African American persons (15,128; 39%)
- persons with HIV attributed to male-to-male sexual contact (25,129; 65%)
- persons residing in the South at the time of diagnosis (19,785; 51%)
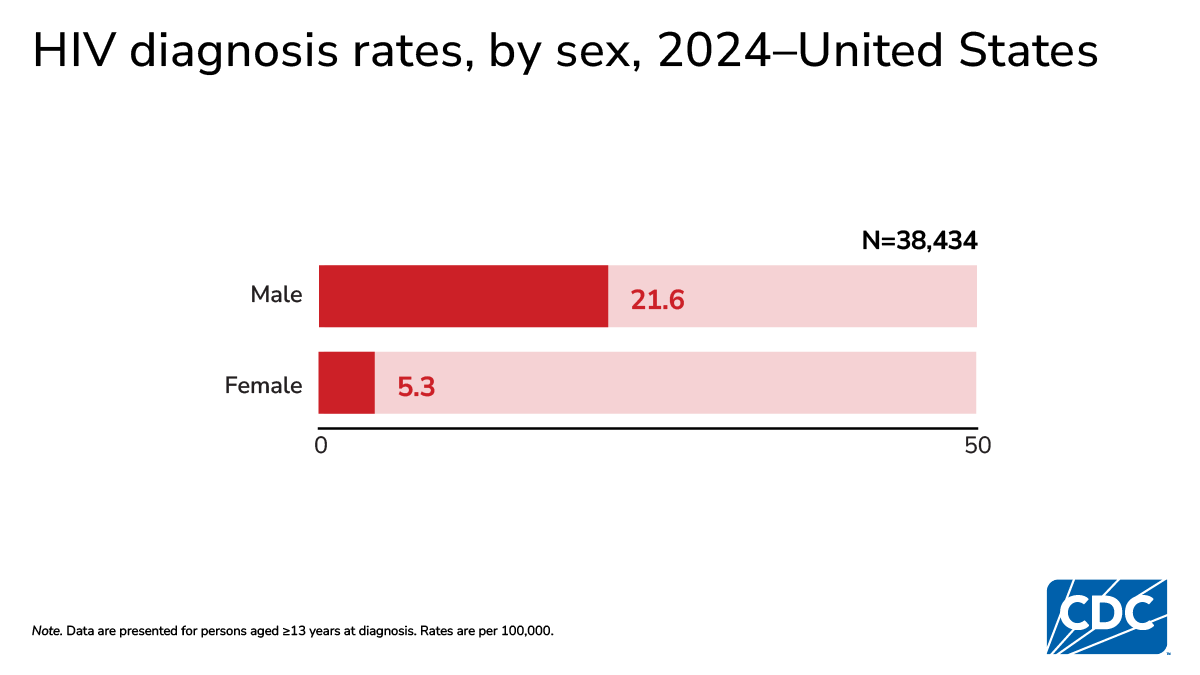
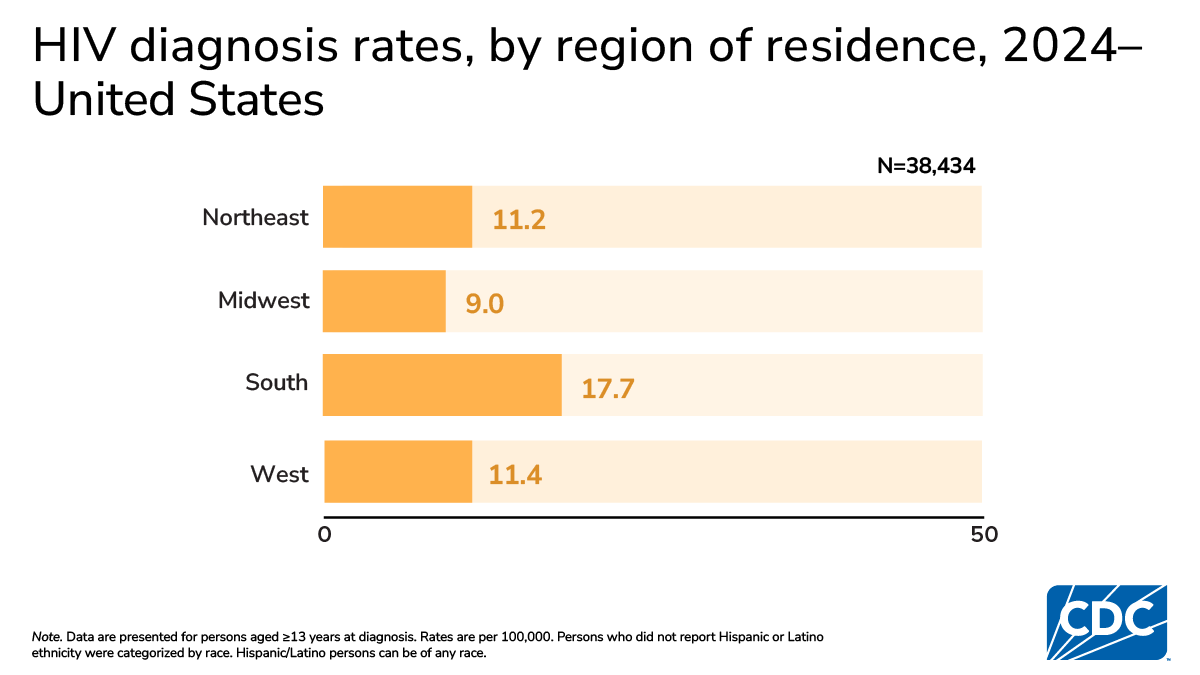
In 2024 in the United States, the HIV diagnosis rate was 13.3 per 100,000.
Where rates are highest
- males (21.6)
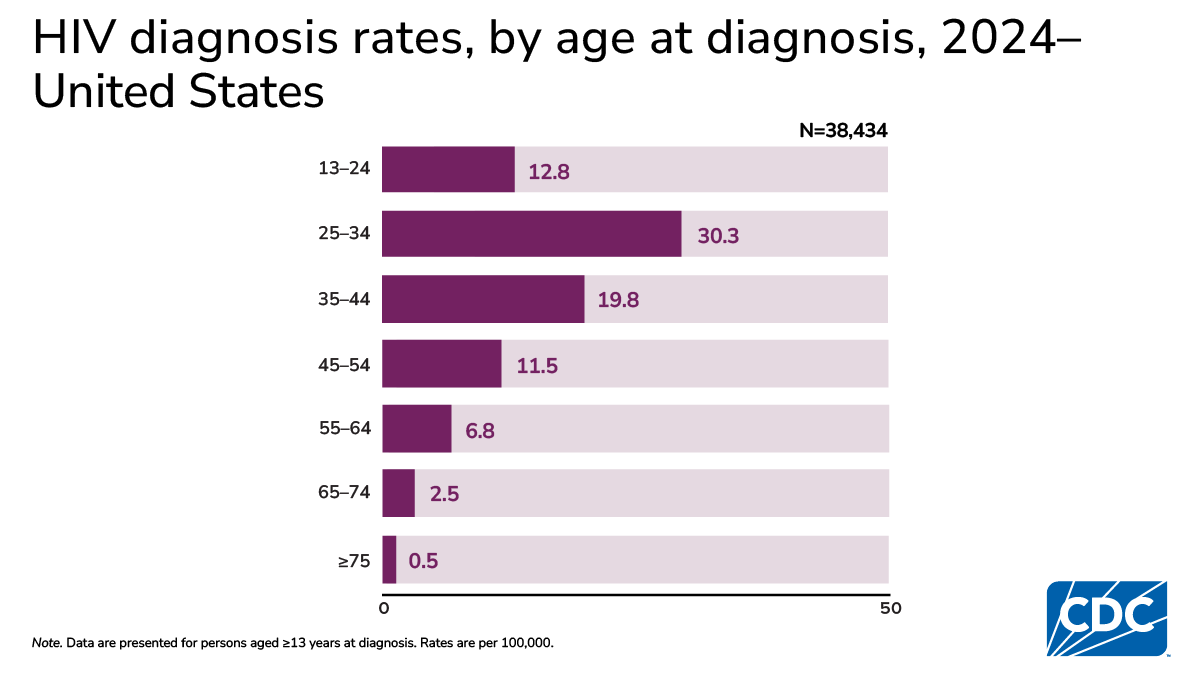
- persons aged 25–34 years (30.3)
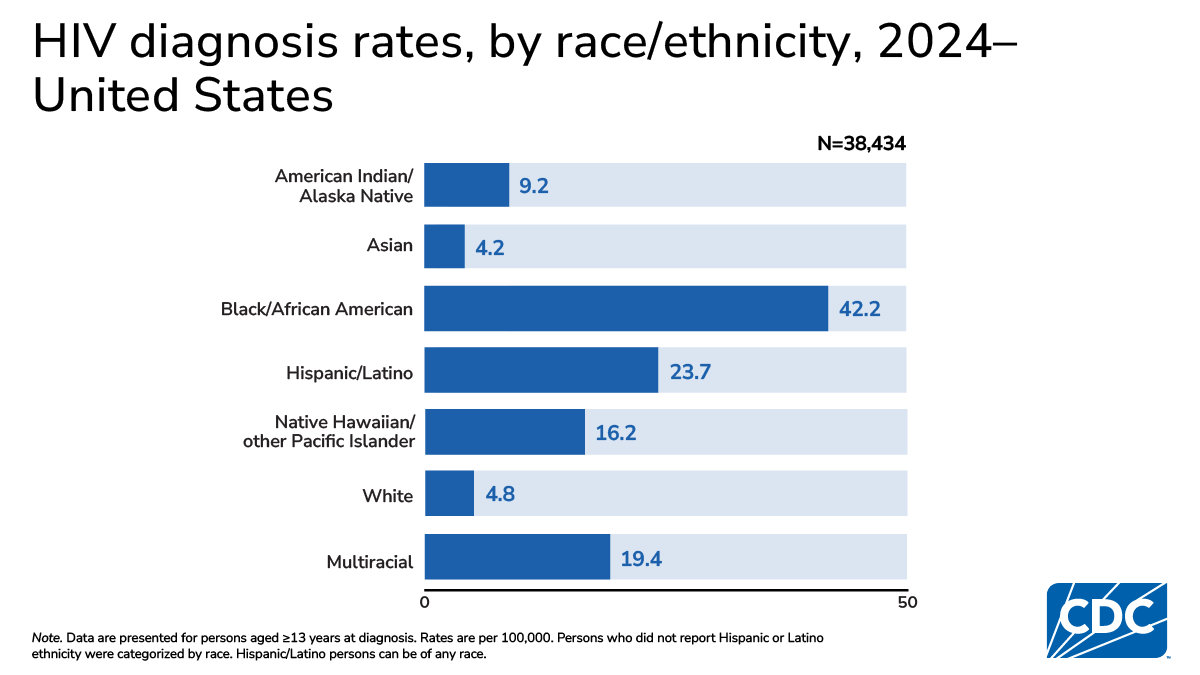
- Black/African American persons (42.2)
- persons residing in the South at the time of diagnosis (17.7)
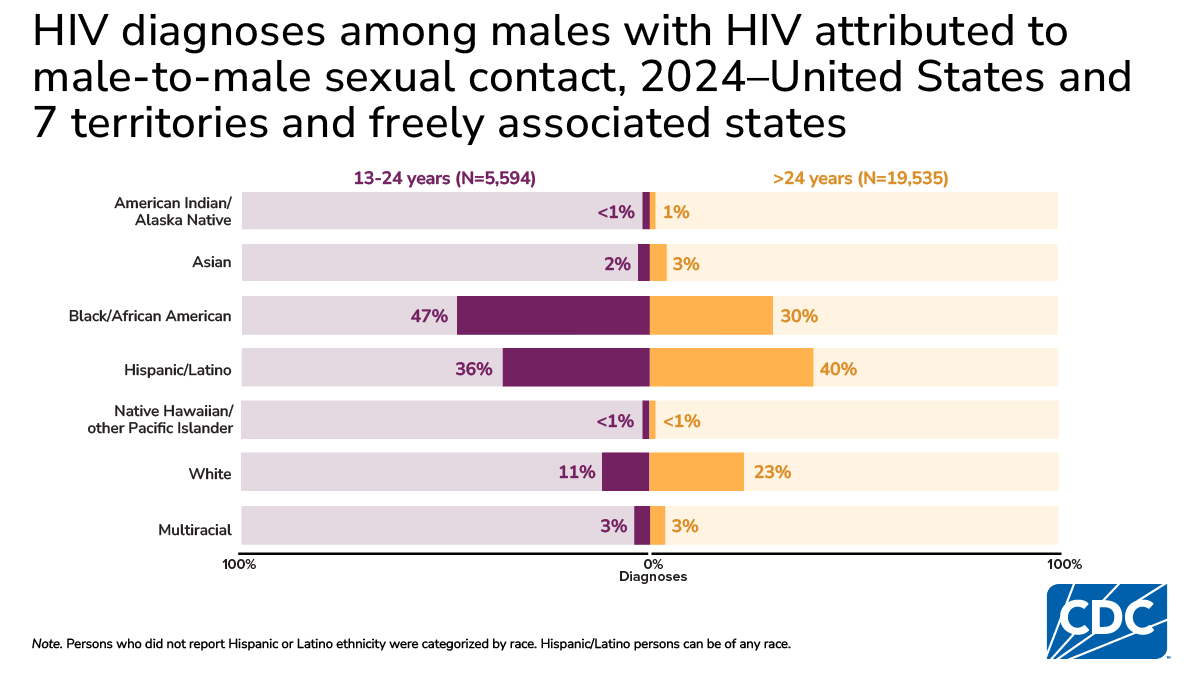
Attributed to male-to-male sexual contact (MMSC)
In 2024 in the United States and 7 territories and freely associated states, 65% (25,129) of HIV diagnoses were attributed to MMSC.
Who is most affected
- Among males aged 13–24 years, Black/African American males accounted for the highest percentage (47%) of diagnoses attributed to MMSC
- Among males aged > 24 years, Hispanic/Latino males accounted for the highest percentage (40%) of diagnoses attributed to MMSC
- Males residing in the South accounted for half (50%) of diagnoses attributed to MMSC
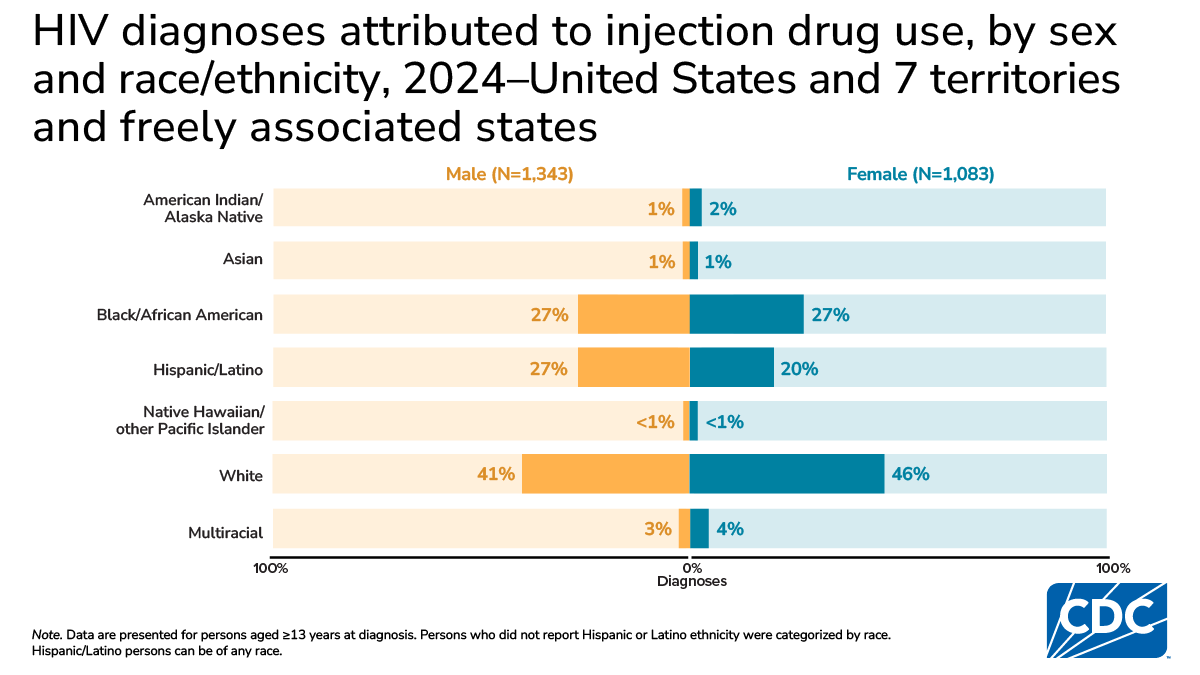
Attributed to injection drug use (IDU)
In 2024 in the United States and 7 territories and freely associated states, 6% (2,426) of all diagnoses were attributed to IDU.
Who is most affected
- White persons accounted for the highest percentage (43%) of diagnoses attributed to IDU
- White males accounted for 41% of diagnoses attributed to IDU among males
- White females accounted for 46% of diagnoses attributed to IDU among females
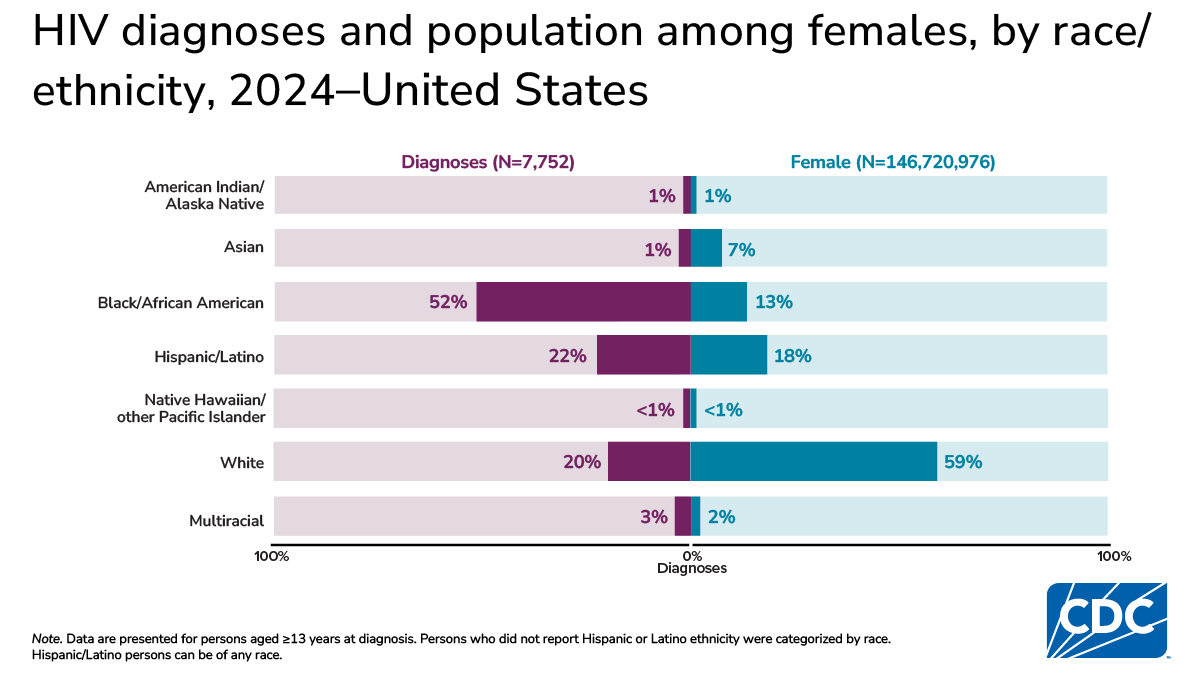
Among females
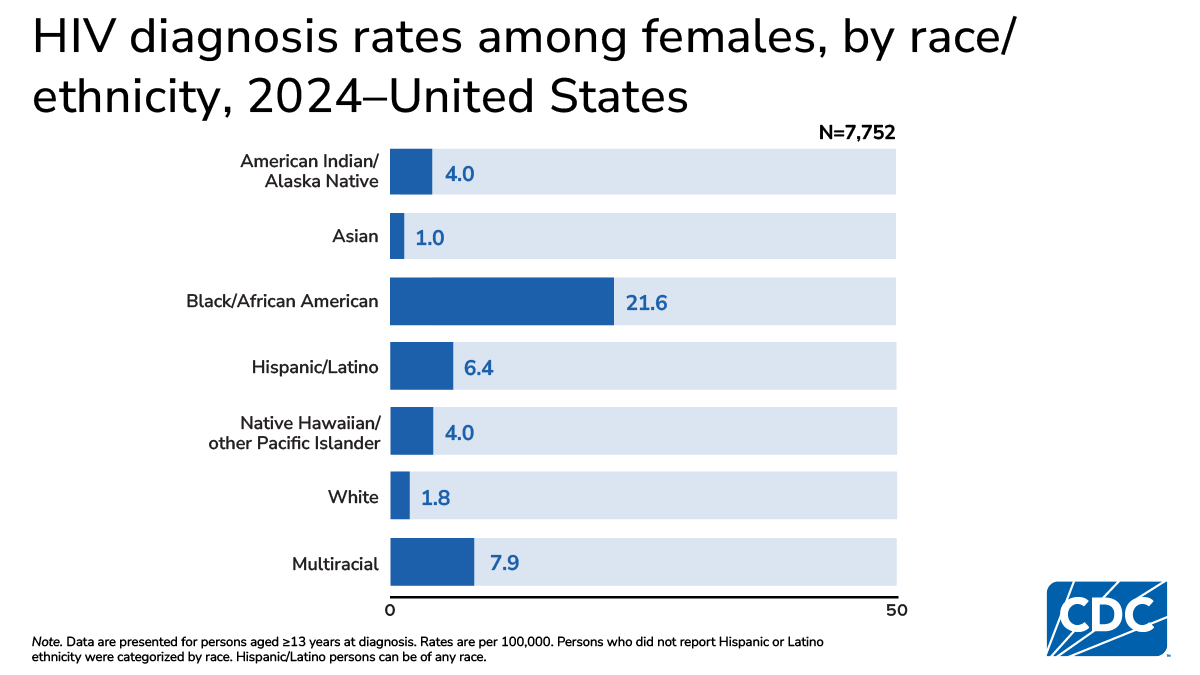
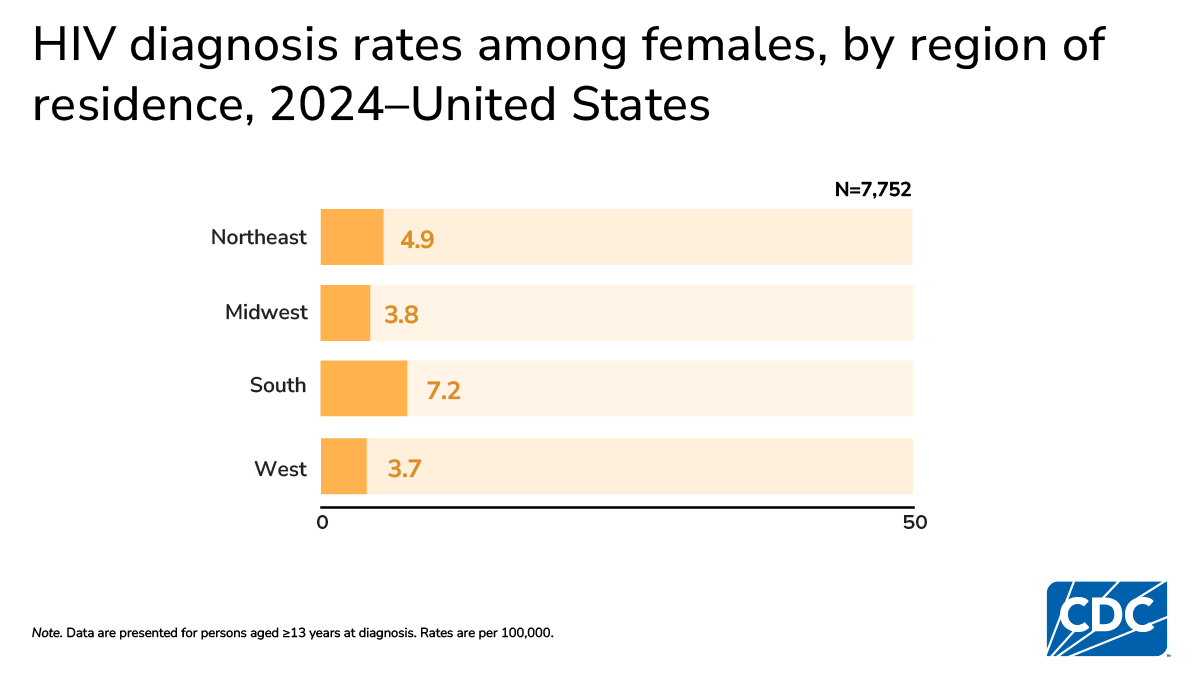
In 2024 in the United States, 20% (7,752) of diagnoses were among females.
Who is most affected
- Black/African American females accounted for more than half (52%) of diagnoses but represented only 13% of the female population
- Black/African American females also had the highest diagnosis rate (21.6), which was more than 3 times the rate (6.4) among Hispanic/Latino females and 12 times the rate (1.8) among White females
HIV deaths
Among persons aged ≥ 13 years
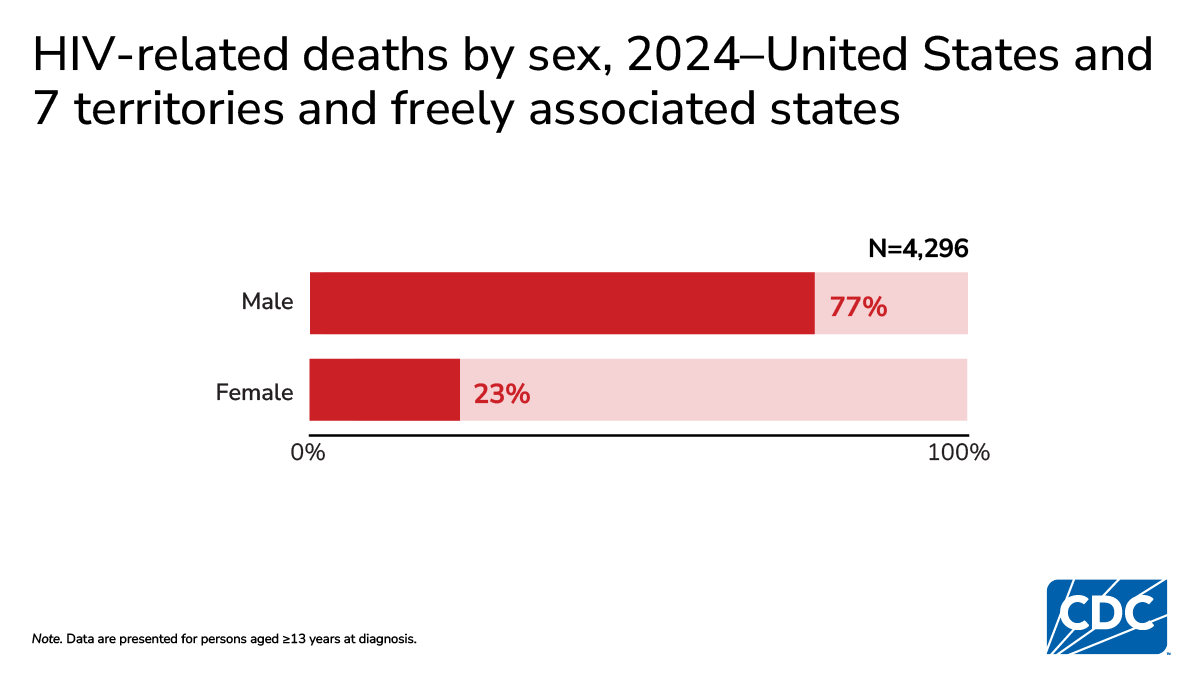
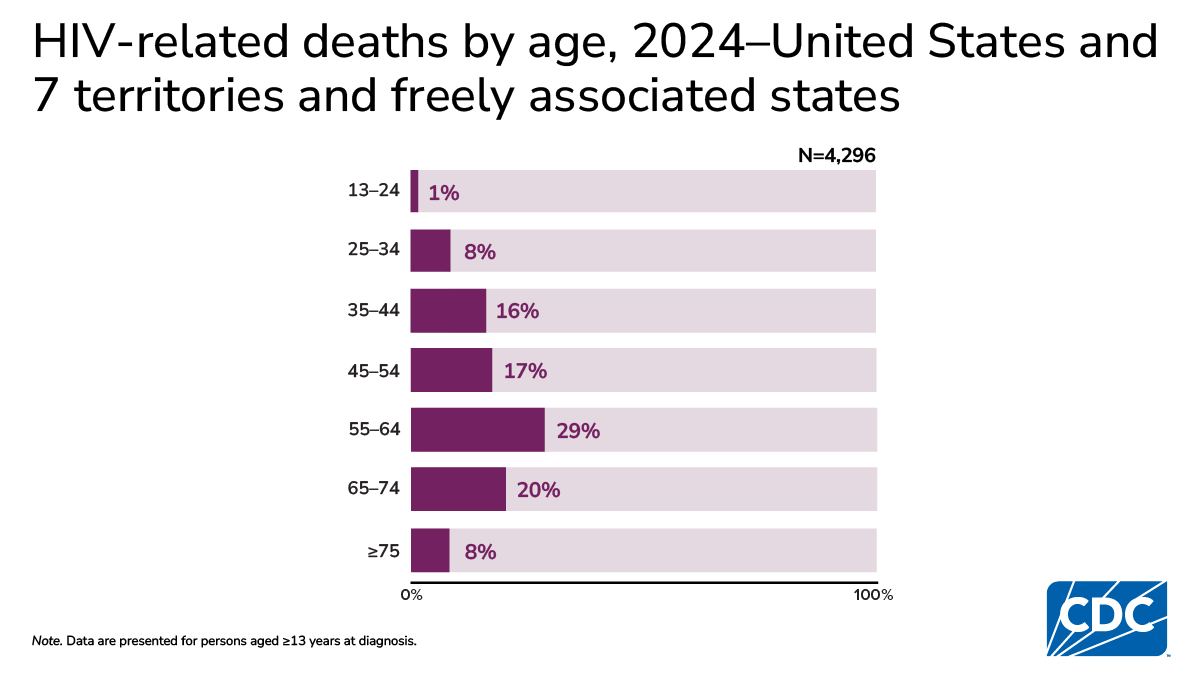
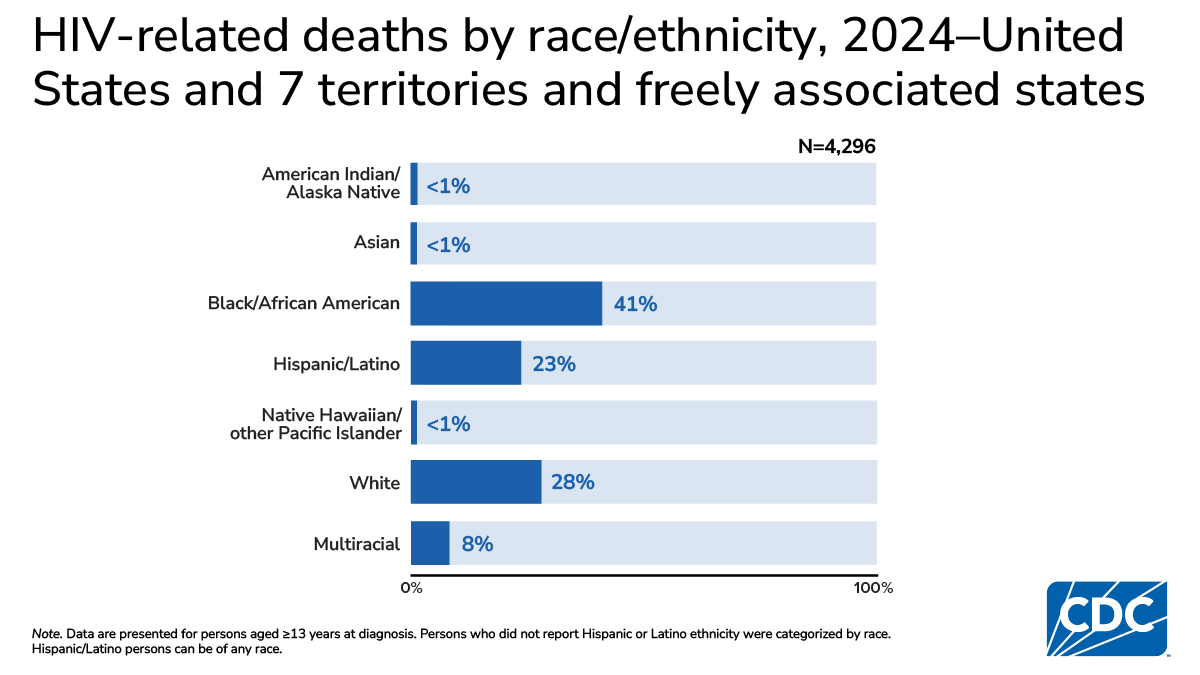
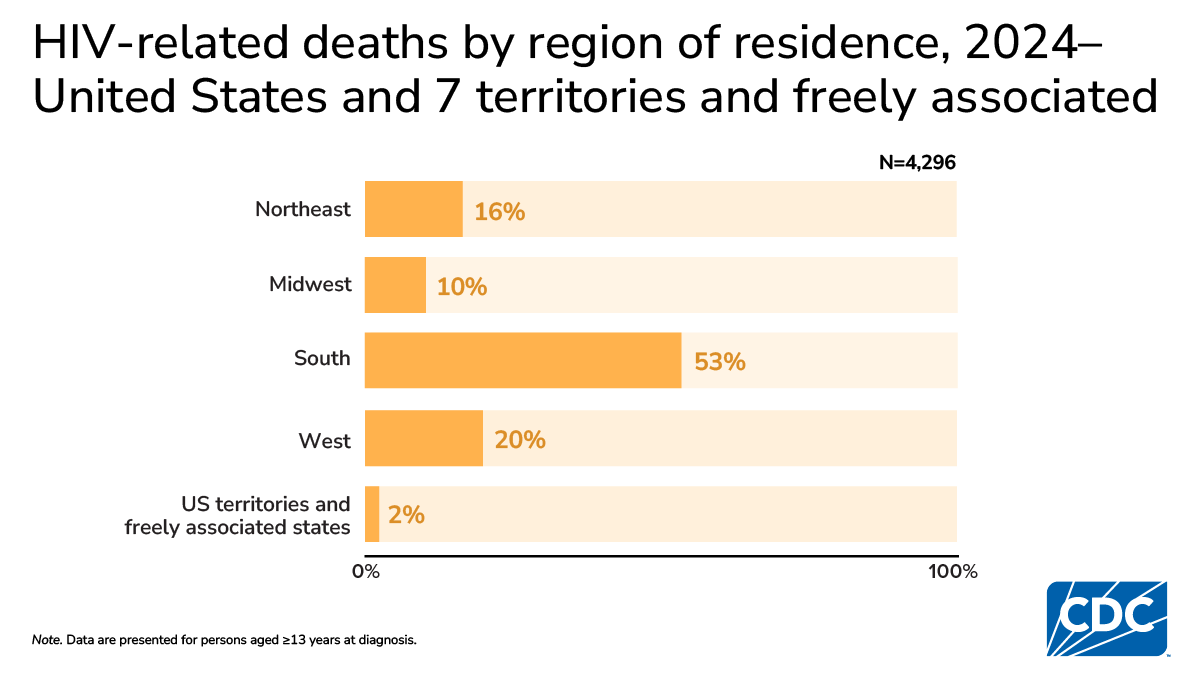
In 2024 in the United States and 7 territories and freely associated states, there were 4,296 HIV-related deaths.
Who is most affected
- males (3,306; 77%)
- persons aged 55–64 years (1,251; 29%)
- Black/African American persons (1,741; 41%)
- persons residing in the South (2,261; 53%)
In 2024 in the United States and 7 territories and freely associated states, the HIV-related death rate was 1.5. Rates were highest in the South.
Where rates are highest
- U.S. Virgin Islands (10.7)
- District of Columbia (7.8)
- Mississippi (3.3)
- Maryland (3.0)
- Florida (2.8)
Note. Use caution when comparing rates for the U.S. Virgin Islands and District of Columbia to the rates for states due to the size of the populations.
Persons Living with Diagnosed HIV (PWDH; diagnosed prevalence)
Among persons aged ≥ 13 years
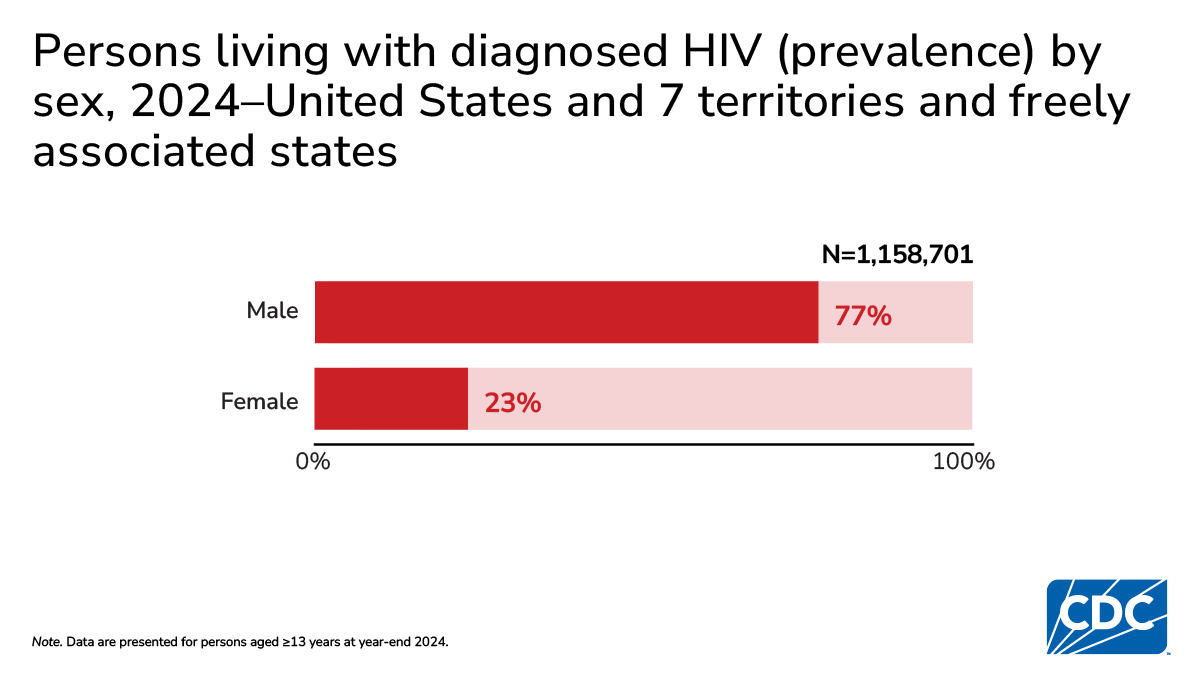
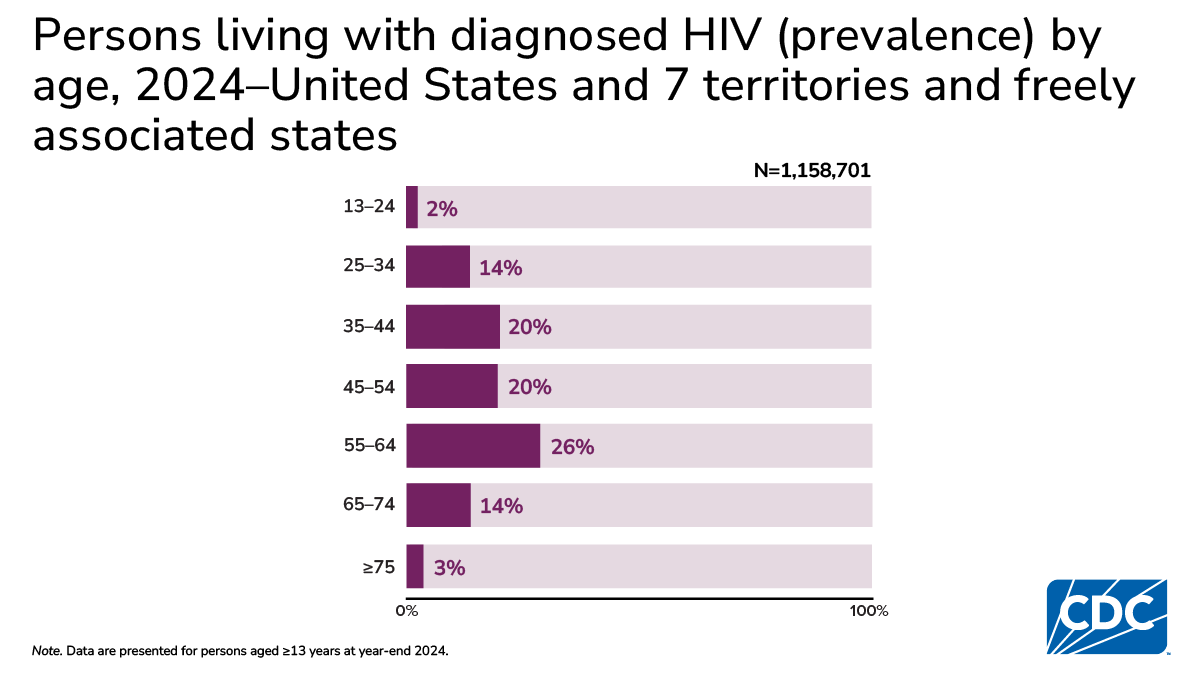
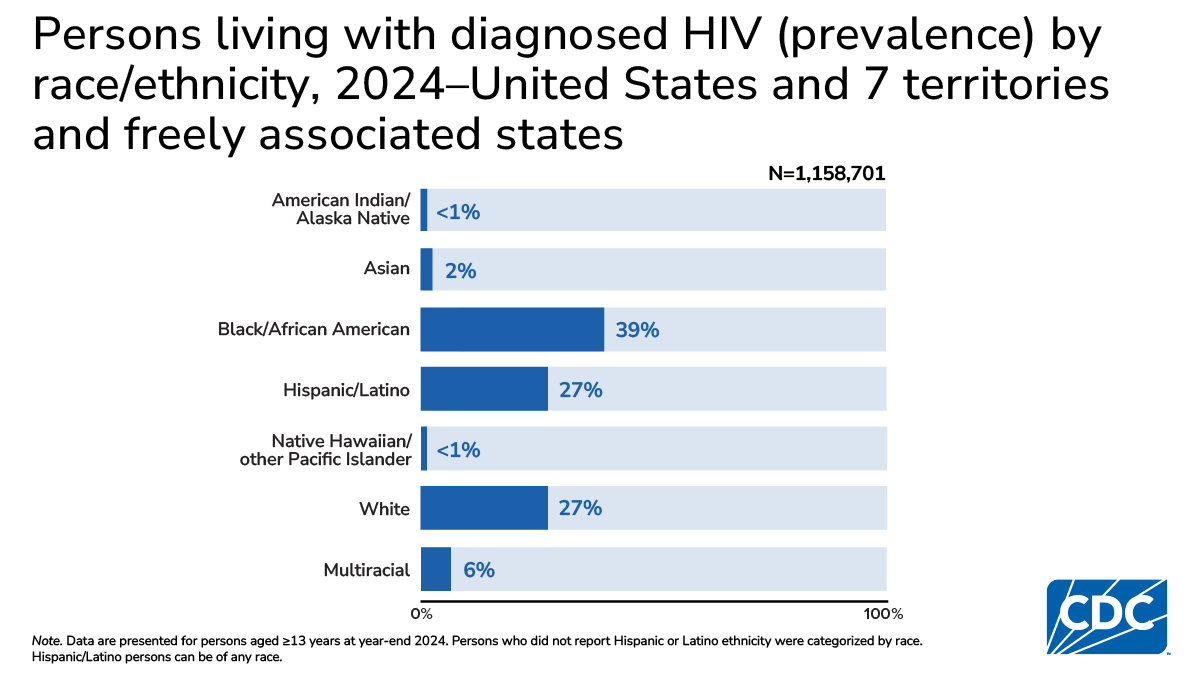
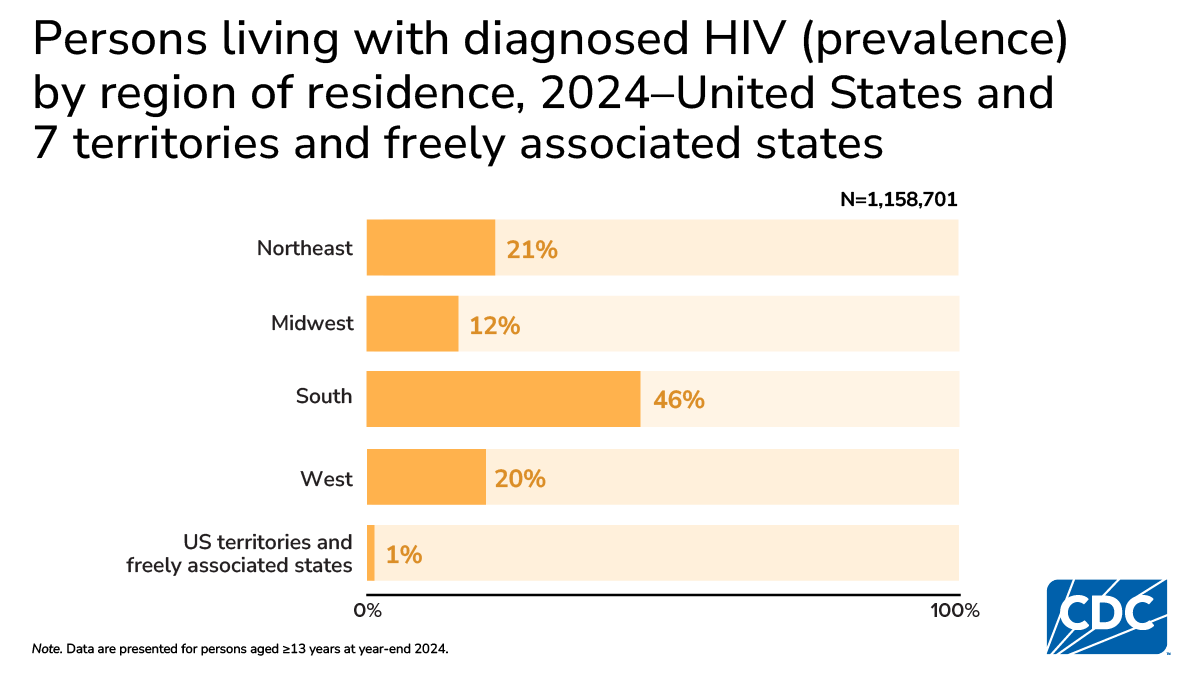
At year end 2024 in the United States and 7 territories and freely associated states, there were 1,158,701 PWDH.
Who is most affected
- males (896,231; 77%)
- persons aged 55–64 years (300,819; 26%)
- Black/African American persons (446,585; 39%)
- persons residing in the South (532,812; 46%)
Technical notes
Surveillance of HIV infection overview
Information on HIV surveillance in the United States, including protocols for data presentation by sex, age, race/ethnicity, transmission category, geographic designations and data limitations, is available in the Technical Notes for NHSS.
Acknowledgments
HIV Surveillance Branch
Division of HIV Prevention
National Center for HIV, Viral Hepatitis, STD, and TB Prevention
Centers for Disease Control and Prevention
This release was made possible by the contributions of the state, territorial, and freely associated state health departments and the HIV surveillance programs that provided data to CDC.
Suggested citation
All material contained in this release is the public domain and may be used and reprinted without special permission; however, citation as to source is appreciated.
Centers for Disease Control and Prevention. HIV diagnoses, deaths, and prevalence—United States and 7 territories and freely associated states, 2024. Published May 18, 2026. Accessed [date]. https://www.cdc.gov/hiv-data/nhss/hiv-diagnoses-deaths-prevalence.html.