Behind the Model: Estimating the Impact of Updated Isolation Guidance on COVID-19 Transmission
CFA’s Behind the Model is a web series sharing behind-the-scenes work of CFA and our partners in generating models, forecasts, and other analytics for public health. We aim to provide a high-level overview of methods and practical applications of our work for public health practitioners, healthcare providers, and the public.
Key message
CDC has updated its respiratory isolation guidance, and we estimated the potential impact of this change for an individual’s COVID-19 transmission potential. Our analysis found little difference on average for the likelihood that someone with COVID-19 would spread it to others under the updated isolation guidance compared with the previous guidance.
Differences between the updated and previous guidance
The updated guidance applies to all respiratory viruses—not just COVID-19, as the previous guidance did. There is now no minimum duration of isolation since this period depends on fever and symptom improvement. The updated guidance recommends that everyone with a respiratory virus take post-isolation precautions for 5 days.
The previous guidance recommended a minimum duration of isolation from symptom onset—5 days for most people—even if symptoms improved rapidly. The recommended duration of post-isolation precautions then varied depending on how long the person was in isolation; isolation and post-isolation measures also depended on test results.
Overview of methods
We modeled infectiousness over time using detailed data—COVID-19 test results and symptoms—to estimate how an individual’s COVID-19 transmission potential could change under the previous versus updated guidance.
We used data from people with mild to moderate COVID-19 who participated in two CDC studies. In these studies, people were tested daily or near daily and asked about symptoms. The test results were used to estimate how much virus was present, or “viral load.” Informed by these data, we simulated individuals with COVID-19 to understand how their estimated viral load changed over time relative to when symptoms began and subsequently improved. We assumed that higher estimated viral loads resulted in greater potential to transmit the virus, all else being equal. We then estimated how transmission potential changed over the course of infection.
We further assumed that when people isolated, their potential to transmit the virus decreased by 90% and that while taking post-isolation precautions, their potential to transmit the virus decreased by 50%. For each individual, we modeled how much transmission potential was prevented if they followed the updated guidance versus the previous guidance.
We focused our analysis on transmission potential for infected individuals. Our results cannot be extrapolated to predict changes in the total amount of transmission at the population level. One reason for this is that transmission depends on whether contacts are susceptible to infection. We did not model how many people are susceptible over time. For more details on our data and methods, see below.
Results: How does transmission potential change under the updated guidance?
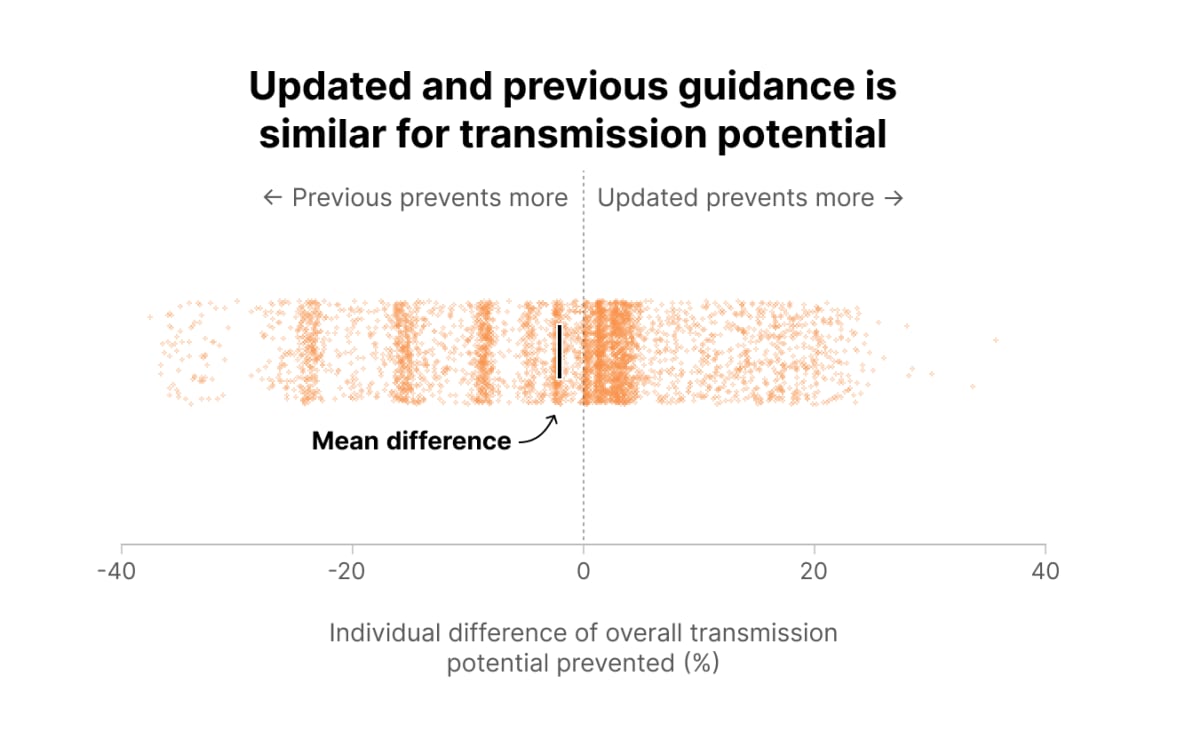
We found little difference in the average potential for transmission by following the updated guidance compared with the previous guidance (Figure 1). We estimated that the previous guidance would prevent 2.3 more percentage points of overall transmission potential than the updated guidance. However, the impact of the updated guidance varies from person to person depending on their symptom severity and individual time to symptom improvement.
Figure 1. Distribution of individual-level differences in transmission potential prevented by updated versus previous guidance, where each dot represents one of 4,000 simulated individuals. Positive values mean that updated guidance prevents more transmission than previous guidance. Negative values mean that previous guidance prevents more transmission than updated guidance. Results indicate that, on average, the updated guidance prevents about the same amount of transmission potential as the previous guidance; however, there is variation among individuals. Because isolation lasts for whole days in our model, multiple people may have the same isolation time, and prevented transmission potential may be similar for these people. This leads to the clustering of points in the figure.
The main reasons for our conclusions are the following:
- Time in isolation is unchanged for many people under the updated guidance because time from symptom onset to symptom improvement is often 5 days or longer.
- People following the updated guidance would often spend more time engaging in post-isolation precautions compared with the previous guidance.
- In the updated guidance, post-isolation precautions are recommended for a minimum of 5 days, regardless of how quickly symptoms improve; in the previous guidance, post-isolation precautions may be fewer than 5 days, depending on the duration of isolation.
- Under the updated guidance, everyone who develops symptoms is advised to follow post-isolation precautions; under the previous guidance, this recommendation was driven by test results. Some people with COVID-19 have false-negative test results and therefore would not be expected to engage in post-isolation precautions.
Results: How do post-isolation precautions affect COVID-19 transmission potential?
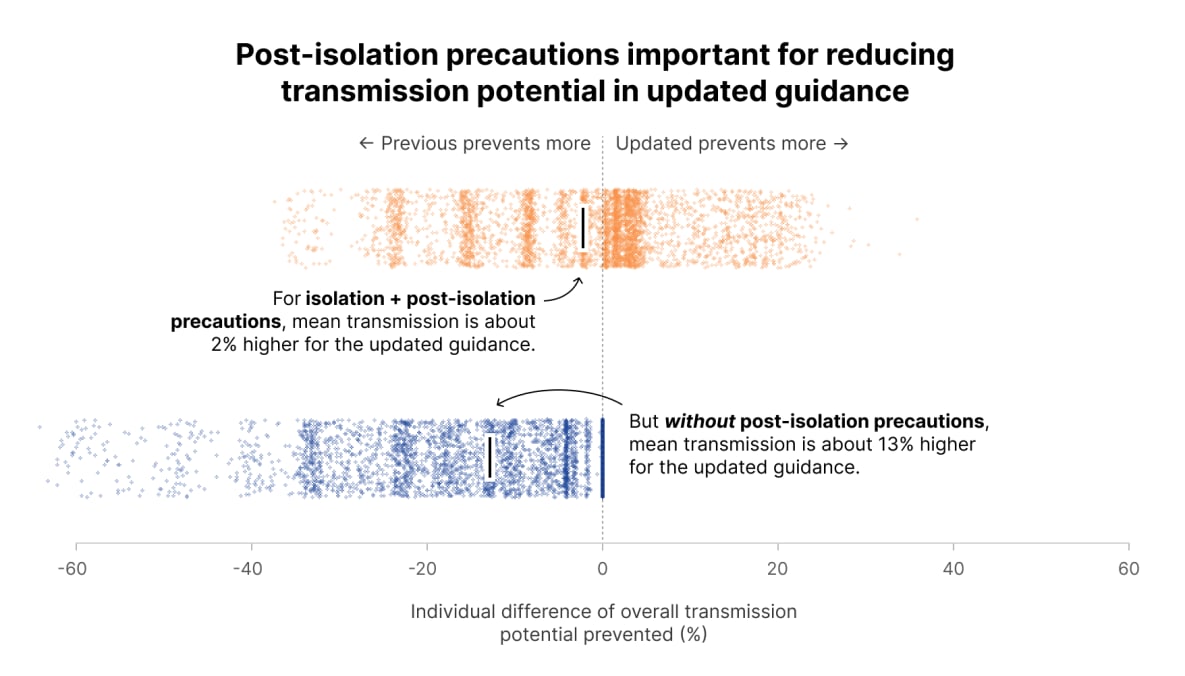
Post-isolation precautions—measures to prevent infection spread after isolation has ended—are a key feature of the updated guidance. If post-isolation precautions are not effective or people do not follow them, the previous guidance could prevent approximately 13 more percentage points of transmission potential than the updated guidance (Figure 2).
Figure 2. Distribution of individual-level differences in transmission potential prevented by updated versus previous guidance when considering 1) isolation and post-isolation precautions combined (orange distribution) and 2) only isolation (blue distribution). Positive values mean that updated guidance prevents more transmission than previous guidance. Negative values mean that previous guidance prevents more transmission than updated guidance. Results indicate that the updated guidance prevents about the same amount of onward transmission as the previous guidance (orange); however, if post-isolation precautions are not followed, the updated guidance would prevent less transmission potential than the previous guidance (blue). Because isolation lasts for whole days in our model, multiple people may have the same isolation time, and prevented transmission potential may be similar for these people. This leads to the clustering of points in the figure.


