What to know
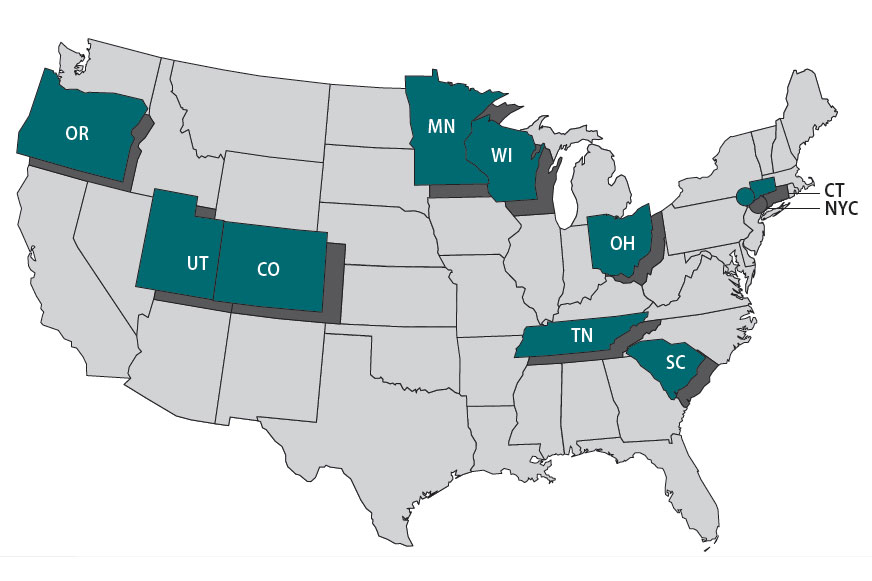
The Foodborne Diseases Centers for Outbreak Response Enhancement (FoodCORE) program addresses gaps in foodborne disease response through enhanced capacity in laboratory, epidemiology, and environmental health to improve timeliness and completeness of outbreak response activities. The FoodCORE centers during Year Ten (January 1, 2020–December 31, 2020) were Colorado, Connecticut, Minnesota, New York City, Ohio, Oregon, South Carolina, Tennessee, Utah, and Wisconsin.
Highlights
In 2020, public health agencies around the world faced the rapidly evolving and expanding COVID-19 pandemic. Epidemiology, laboratory, and environmental health staff were pulled from their regular job duties to support the pandemic response. Like other health departments, FoodCORE centers had fewer staff available to investigate foodborne outbreaks and conduct routine surveillance. Despite these challenges, FoodCORE centers leveraged their existing capacity to get the job done.
In non-pandemic times, FoodCORE centers use student teams for temporary surge capacity or as an integrated component of their teams. During the COVID-19 pandemic, FoodCORE student teams provided significant support to jurisdictions who otherwise lacked the capacity to conduct foodborne investigations. Students conducted case follow-up, data entry, enhanced surveillance activities, and carried out investigations while core enteric staff responded to the pandemic.
The COVID-19 pandemic also presented an opportunity to re-examine and improve public health systems and processes. During the pandemic, much of the public health workforce transitioned to maximum telework as agencies enforced new policies for workplace safety. To improve remote processes, students in New York City converted questionnaires into fillable PDF forms. In Tennessee, staff overhauled a database that's used for FoodCORE and other programs to provide users secure and remote access.
Due to limited capacity, some FoodCORE activities paused during 2020, including the development of success stories and revision of model practices. FoodCORE model practices and success stories share the successes of FoodCORE centers so that others can learn from their experiences. To date, four model practices have been published. Centers will resume revising the model practice on laboratory timeliness and completeness when staff have availability to participate and provide input.
Each year, FoodCORE staff at CDC and in FoodCORE centers share their progress and updates at national meetings and conferences; unfortunately, many events were cancelled in 2020. FoodCORE centers shared their experiences, including COVID-19 successes and challenges, through FoodCORE monthly calls, success stories, and virtual meetings and conferences.
Program performance
Centers report metrics once a year to document changes resulting from targeted FoodCORE resources. Metrics for Salmonella, Shiga toxin-producing Escherichia coli (STEC), and Listeria (SSL) have been collected since late 2010. Metrics for norovirus, other etiologies, and unknown etiology (NOU) investigations have been collected since 2012. The metrics collected by FoodCORE centers are revised as needed to best meet program goals.
While FoodCORE centers maintained most of their core activities in 2020, some metrics capture the impacts of COVID-19 on enteric disease.
Graphs for selected metrics – Year Ten
The average number of Salmonella, STEC, and Listeria primary isolates/isolate-yielding specimens submitted to or recovered at the PHL was lower in Year 10 than compared to Year 9 and previous years.
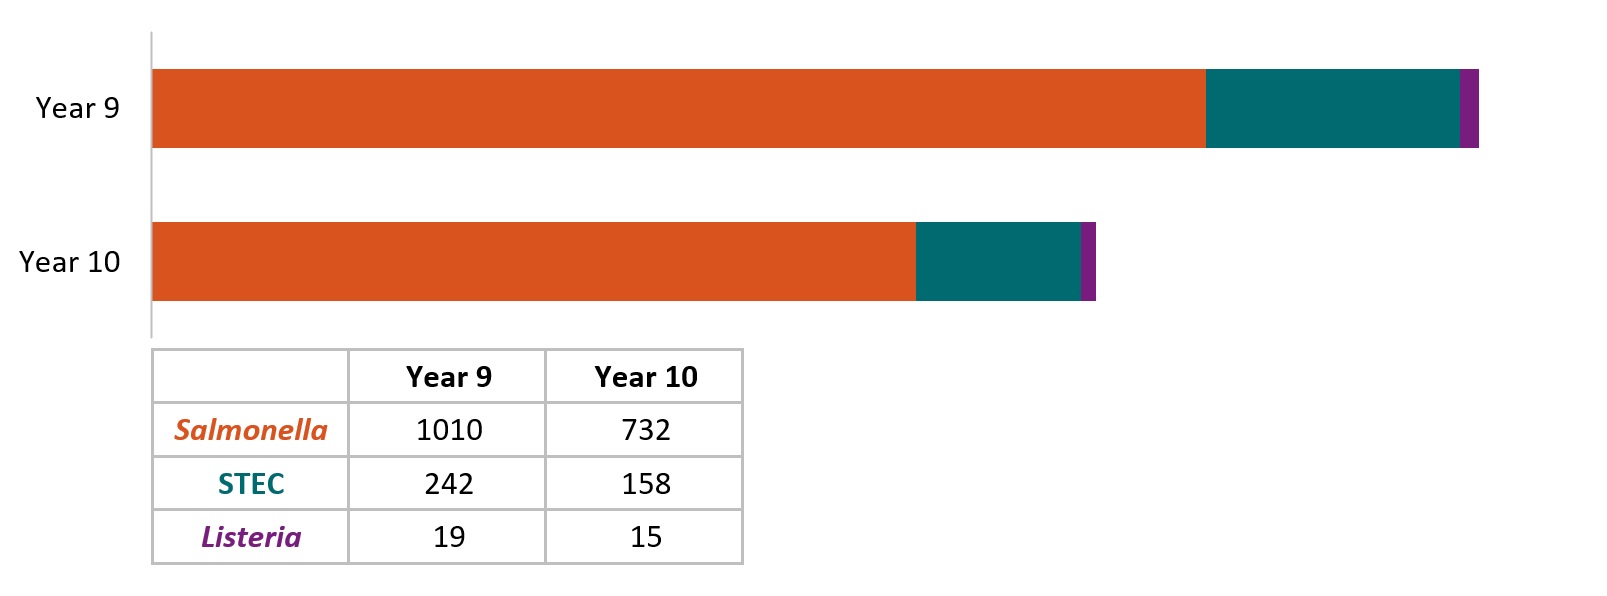
The average number of laboratory-confirmed cases reported to epidemiology staff decreased from Year 9 to Year 10. In Year 9, each center reported an average of 1100 SSL cases to epidemiology staff (864, 218, and 18 cases for Salmonella, STEC, and Listeria, respectively) compared to an average of 825 SSL cases (679, 131, and 15 cases for Salmonella, STEC, and Listeria, respectively) in Year 10.
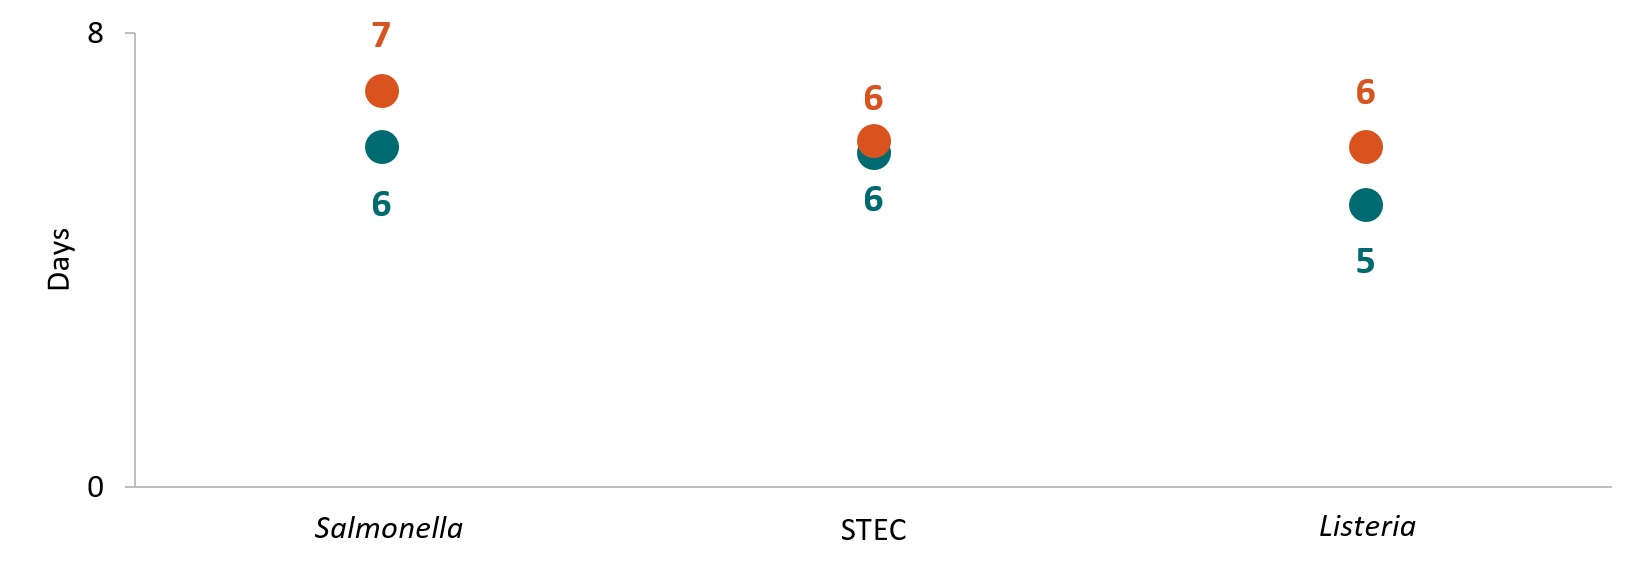
Since 2016, centers have continued to reduce the turnaround time (TAT)A from receipt (or recovery) at WGS laboratory to sequence being shared with national database. From Year 9 to Year 10, FoodCORE centers decreased the TAT for Salmonella and Listeria. STEC timeliness was maintained.
In Year 10, centers conducted 35 SSL and 62 NOUB environmental health assessments as part of investigations where there was a link to a common location of exposures. Environmental health assessments provide information needed to recommend effective short and long-term interventions that stop ongoing foodborne outbreaks and prevent them in the future.
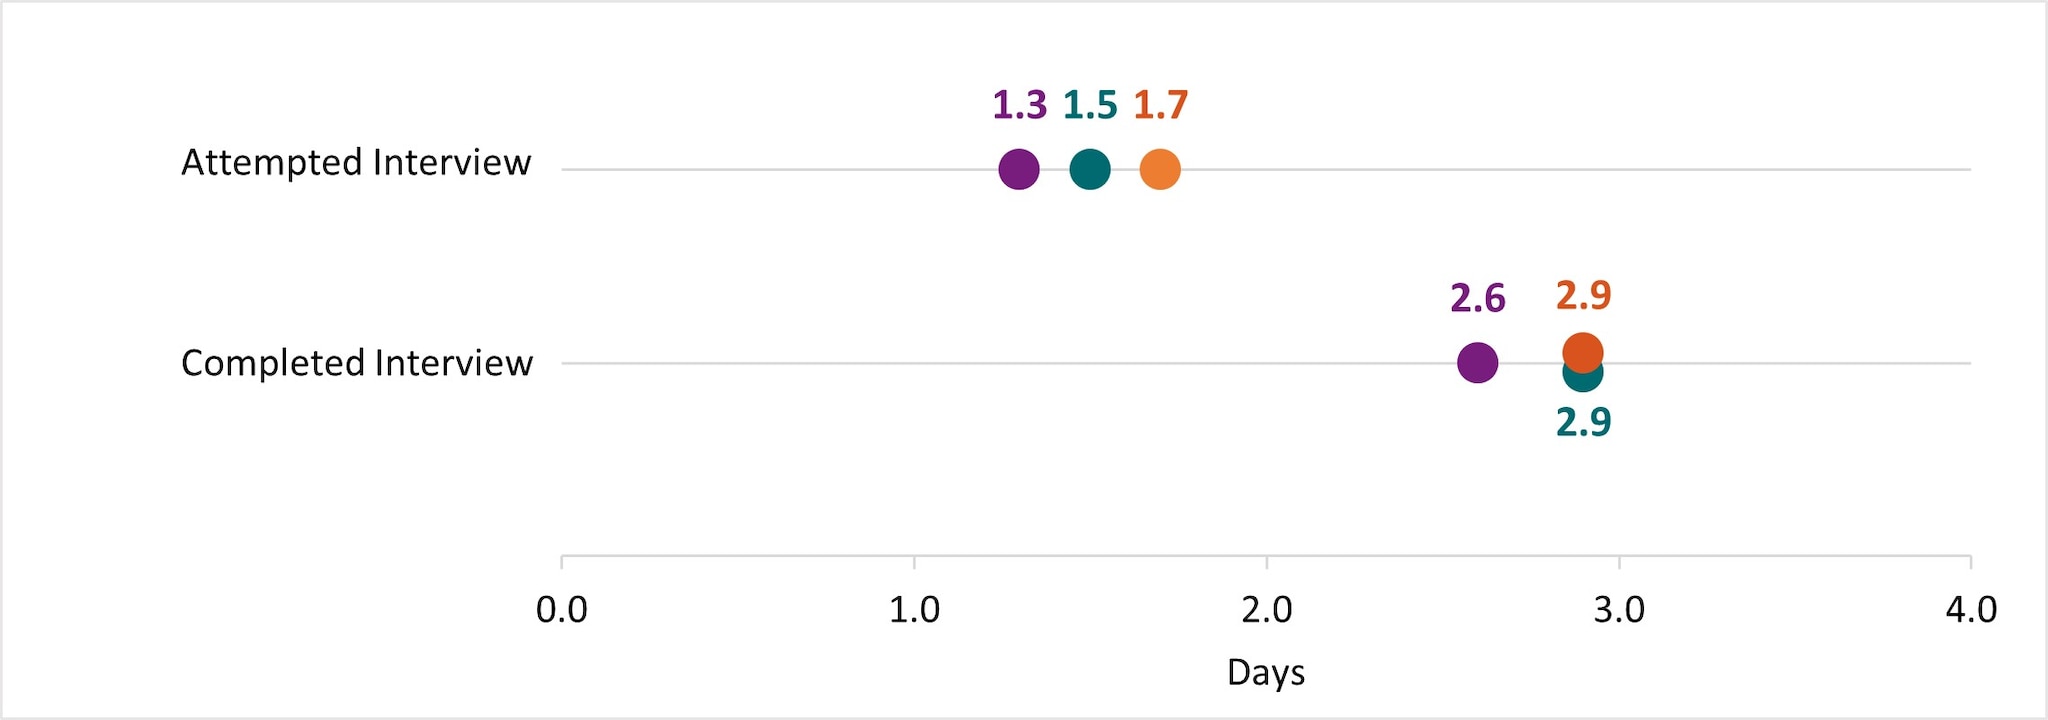
In Year 10, the timeA to attempt and complete interviews for Salmonella, STEC, and Listeria was under 2 days and 3 days, respectively. This TAT is consistent with previous years.
In Year 10, centers maintained a high proportion of primary Salmonella, STEC, and Listeria isolates with WGS results at 99%, 99%, and 94%, respectively. Further, the average proportion of Salmonella, STEC, and Listeria confirmed cases reported to epidemiology staff with WGS information was 91%, 87%, and 87%, respectively.
Summary
- Time in median days.
- Only foodborne and point-source investigations are reported for NOU metrics.
- Baseline (Y0) =Oct 2010 – Mar 2011
- Year 1 (Y1) =Oct 2010 – Sept 2011
- Year 2 (Y2) =Oct 2011 – Dec 2012
- Year 3 (Y3) =Jan 2013 – Dec 2013
- Year 4 (Y4) =Jan 2014 – Dec 2014
- Year 5 (Y5) =Jan 2015 – Dec 2015
- Year 6 (Y6) =Jan 2016 – Dec 2016
- Year 7 (Y7) =Jan 2017 – Dec 2017
- Year 8 (Y8) =Jan 2018 – Dec 2018
- Year 9 (Y9) =Jan 2019 – Dec 2019
- Year 10 (Y10) =Jan 2020 – Dec 2020