


At a glance
Authors
Ashley Tippins, DrPH, MPH1; Kelsey C. Coy, MPH2; Glodi Mutamba, MD, MPH2; Jennifer L. Kriss, PhD, MPH1
1Immunization Services Division, National Center for Immunization and Respiratory Diseases, CDC; 2Eagle Health Analytics, LLC
Summary
Childhood vaccination is one of the most successful public health interventions in improving life expectancy, decreasing healthcare costs, and reducing the spread of preventable diseases1 . The U.S Healthy People (HP) 2030 and the World Health Organization's Immunization Agenda 2030 have established 90% vaccination coverage targetsA for the following childhood vaccines: diphtheria and tetanus toxoids and acellular pertussis vaccine (DTaP); measles, mumps, and rubella vaccine (MMR); and pneumococcal conjugate vaccine (PCV) (2,3).
All six of the U.S.-affiliated Pacific IslandsB (USAPI) participate in the U.S. domestic immunization program. CDC collaborates with USAPI immunization programs to monitor vaccination coverage for all vaccines included in jurisdictional programs. This report describes vaccination coverage by age 24 months in five of the six USAPIC jurisdictions among children born during 2017–2023.
Using data from jurisdictional immunization information systems, vaccination coverage by age 24 months among children born during 2017–2023 in the U.S.-affiliated Pacific Islands was estimated for routine childhood vaccines included in jurisdictional programs. Progress toward the U.S. Healthy People 2030 and World Health Organization Immunization Agenda 2030 vaccination goals of 90% coverage by age 24 months for recommended vaccines was inconsistently met across jurisdictions; for example, among children born in 2023, coverage with ≥4 doses of DTaP, ≥1 dose of MMR, and ≥3 doses of PCV by age 24 months ranged across jurisdictions from 49.9%–80.0%, 78.7%–92.6%, and 74.8%–93.7%, respectively. Data in this report can be used to determine where additional efforts are needed to assess reasons for delayed vaccination of children and strategies to mitigate vaccination delays, specific to each jurisdiction.
Methods
Data Sources and Inclusion and Exclusion Criteria
Patient-level data from immunization information systems (IISs) were aggregated at the jurisdiction level. Patients were grouped by calendar year of birth (i.e., "birth cohort") and were included in the denominator if they had an active patient statusD in the IIS. Patients with an inactive or deceased status were excluded from all analyses, consistent with the Modeling of Immunization Registry Operations Workgroup's (MIROW) guidance for assessment at the jurisdiction level4 .
Estimation of Vaccination Coverage
To assess coverage by age 24 months, all vaccine doses received as of the day before each child reached age 24 months were included in coverage estimates, except for rotavirus vaccine, which is assessed by age 8 months due to upper age limit for this vaccine. The following vaccines were included: DTaP, poliovirus, MMR, Haemophilus influenzae type B (Hib), hepatitis B (HepB), PCV, rotavirus, and the combined six vaccine series (4:3:1:3*:3:4) E.
According to the CDC Child and Adolescent Immunization Schedule, DTaP vaccine is recommended as a 5-dose series (3-dose primary series at age 2, 4, and 6 months, followed by booster doses at ages 15–18 months and 4–6 years)5 . To illustrate timeliness of vaccination (i.e., adherence to the recommended schedule) among a recently vaccinated population, an additional assessment of the percent of DTaP doses administered by select age milestones was conducted among children aged 19–35 months as of January 1, 2026. SAS software (version 9.4; SAS Institute) was used to conduct all analyses. This activity was reviewed by CDC, deemed not research, and was conducted consistent with applicable federal law and CDC policyF .
Results
Trends in Vaccination Coverage by Birth Cohort
Trends in vaccination coverage across the 2017–2023 birth cohorts varied by jurisdiction and vaccine type (Table 1). Coverage with ≥1 dose MMR by age 24 months increased between the 2017 and 2023 cohorts in American Samoa, Federated States of Micronesia, the Marshall Islands, and Palau, with the largest increases occurring in American Samoa (14.9 percentage points) and the Marshall Islands (9.7 percentage points). In contrast, ≥1 dose MMR coverage in the Northern Mariana Islands declined from 88.7% among children born in 2017 to 78.7% among those born in 2023 (Figure 1).
American Samoa demonstrated substantial improvements in several complete-series measures, including increases of 13.6 percentage points for ≥4 doses DTaP doses, 15.9 percentage points for ≥4 doses PCV, and 32.2 percentage points for the combined six-vaccine series. Coverage fluctuated across intermediate birth cohorts in most jurisdictions, with several measures declining among the 2019–2020 cohorts and subsequently recovering.
Vaccination Coverage by Age 24 Months (2023 Birth Cohort)
Coverage by age 24 months among children born in 2023 varied substantially by jurisdiction and vaccine type. For example, coverage with ≥1 dose MMR ranged from 78.7% in the Northern Mariana Islands to 92.6% in Palau. Coverage with the Hib primary seriesG ranged from 79.3% in the Marshall Islands to 97.1% in Palau, whereas full-series Hib coverage ranged from 9.2% in the Marshall Islands to 70.1% in Federated States of Micronesia. Additional analyses indicated non-adherence to product-specific schedules for this vaccine, which directly impacted Hib full series coverage, in the Marshall Islands and Palau (data not shown).
Coverage with ≥3 doses of DTaP ranged from 78.6% in Federated States of Micronesia to 97.7% in Palau, whereas coverage with ≥4 doses of DTaP ranged from 49.9% in Federated States of Micronesia to 80.0% in Palau. A similar decline between earlier and later doses was observed for pneumococcal conjugate vaccine (PCV); coverage with at least three doses ranged from 74.8% in the Marshall Islands to 93.7% in Palau, compared with 46.0% to 78.3% for at least four doses.
Coverage with the combined six-vaccine series was below 60% in every jurisdiction, ranging from 4.8% in the Marshall Islands to 57.0% in the Northern Mariana Islands.
Timeliness of DTaP Vaccination among Children 19–35 Months
Adherence to the vaccination schedule for DTaP varied by jurisdiction, but an overall pattern of decreasing adherence to each subsequent dose was notable (Table 2). The proportion of first doses administered on time ranged from 64.2% in Federated States of Micronesia to 98.3% in Palau, while the proportion of third doses received on time ranged from 38.8% in Federated States of Micronesia to 82.3% in Palau. Late receipt of second and third doses coupled with the 6-month minimum interval between the third and fourth dose contributed to most children receiving the fourth dose late. By age 19 months, only 59.9% of administered fourth doses in Federated States of Micronesia, 70.1% in American Samoa, 78.5% in the Marshall Islands, 81.6% in the Northern Mariana Islands, and 85.1% in Palau had been received. Overall, these findings indicate high initiation of the DTaP series but substantial attrition and delayed receipt of later doses.
Results are similar for other vaccines with multiple doses recommended in the first year of life (data not shown).
Discussion
Vaccination coverage of 90% by age 24 months for vaccines included in USAPI immunization programs has been inconsistently met, and coverage was generally lower than U.S. national estimates6. Previous reports have identified barriers to vaccine delivery and vaccination uptake in the USAPI including lack of access to reliable transportation for vaccine delivery to remote populations, lack of technical expertise to create data-driven vaccination delivery outreach plans, and issues related to governance and release of timely funding to support activities, among other barriers (7,8). Analyses of age at vaccination indicate delays in initiating the routine vaccination schedule and staying on track with the schedule across all jurisdictions. Gaps in immunization coverage identified across the USAPI can be used to pinpoint where further efforts are needed to evaluate the jurisdiction-specific reasons for, and ways to improve, on-time vaccination.
The underlying reasons for low adherence to the recommended schedule may vary by jurisdiction. The comparatively low on-time coverage in the Federated States of Micronesia and the Marshall Islands may be influenced by logistical challenges in reaching remote populations on outer islands, where travel by the immunization program staff is challenging and costly. In contrast, jurisdictions like Palau and the Northern Mariana Islands demonstrate high on-time coverage for first doses but experienced notable declines for subsequent doses. This drop-off may indicate a need for better educational and awareness materials to inform caregivers of the importance of adhering to the full vaccination schedule or difficulty in attending follow-up appointments due to work commitments, transportation barriers, or other access barriers. These findings suggest that, while the pattern of decreasing timeliness is common, interventions may need to be tailored to address the specific barriers faced in each jurisdiction.
Differences in funding between jurisdictions might impact vaccine access and program operations; however, data on facilitators and barriers specific to each USAPI is lacking. Further, the COVID-19 pandemic may have had an additional negative impact on vaccination coverage. Coverage for most vaccines among children reaching age 24 months during 2020 (i.e., born in 2018) was higher than among those reaching age 24 months in 2021 and 2022 (i.e., born in 2019 and 2020). Existing challenges with adherence to the recommended schedule may have been amplified due to the pandemic, particularly as limited human resources were further stretched to mitigate the pandemic threat (7,8).
Catch-up strategies are recommended, such as those described in the CDC Routine Immunizations on Schedule for Everyone (Let's RISE), to address existing lags in coverage among young children who may still be experiencing barriers to vaccine access9. However, although catch-up campaigns increase coverage in the short term, models indicate that reaching and maintaining optimal levels of vaccination coverage through routine vaccination services is a more cost-effective strategy in the long term10. Evidence-based approaches to increasing vaccination coverage include recommendations from health care providers, educating caregivers on the importance of vaccinating on time, and use of reminder and recall notices11. In jurisdictions with remote populations, additional strategies related to increasing frequency of vaccination services to outer islands can be considered. Further, lessons learned from recent successful vaccination campaigns, such as the COVID-19 vaccine rollout, may be applied to routine vaccination services to improve vaccine access and uptake (7,8).
Vaccination coverage data can support evaluation of USAPI immunization programs and their partners to increase on-time vaccination of children by age 24 months. The gaps in vaccination coverage identified in this report can guide future research and evaluation to systematically identify determinants of on-time vaccination by jurisdiction. Qualitative research, such as key informant interviews with immunization program stakeholders, might help identify facilitators and barriers to immunization program operations by jurisdiction and to examine the feasibility of implementing evidence-based interventions to improve vaccination service delivery while mitigating identified barriers. Continued monitoring of vaccination coverage can be used to monitor intervention implementation and evaluate their effectiveness.
Limitations
The findings in this report are subject to at least three limitations. First, the accuracy of coverage estimates depends on completeness and accuracy of jurisdictional IIS data. Evaluations conducted since 2016 have found high levels of completeness and accuracy of vaccination data across the five USAPI IISs (i.e., dose dates and product types between paper and IIS records matched) (A Tippins, CDC, unpublished data, 2016–2023). Second, the active patient population size in IISs can be inflated compared with census estimates because of difficulties tracking out migration and deaths. This can lead to an under-estimation of vaccination coverage. Recent census data were not available for denominator estimation for all jurisdictions included in this assessment. For this reason, the MIROW exclusion criteria were applied to classify likely active patient status of patients in the IIS. Finally, vaccination coverage for Guam is assessed via the National Immunization Survey and was not included in this analysis12. Differences in vaccination coverage estimation methods might mean that results for Guam are not directly comparable with IIS-based estimates for the other USAPI presented in this report.
Acknowledgments
Vince Aguon, Peter Judicpa, Natalie Johns, Alex Turner, CDC; Carter Apaisam, Midion Neth Jr., Federated States of Micronesia Department of Health and Social Affairs; Merlyn Basilius, Landon Decherong, Palau Ministry of Health & Human Services; Yolanda Masunu, Silimusa Masui, American Samoa Department of Health; Emman Parian, Shaun Kileleman, Cyji Tenorio, Heather Pangelinan, Commonwealth Healthcare Corporation; Noatia Siofilisi, Edlen Anzures, Republic of the Marshall Islands Ministry of Health.
Tables
Table 1. Estimated vaccination coverage with selected vaccines and vaccine series by age 24 months among children born 2017–2023, by jurisdiction and year of birth* — U.S.-affiliated Pacific Islands
| DTaP | Poliovirus | MMR | Hib† | Hepatitis B | PCV | Rotavirus¶ | Combined six-vaccine series (4:3:1:3*: 3:4)** |
|||||
|---|---|---|---|---|---|---|---|---|---|---|---|---|
| ≥3 doses | ≥4 doses | ≥3 doses | ≥1 dose | Primary Series | Full Series | Birth dose§ | ≥3 doses | ≥3 doses | ≥4 doses | |||
| % | ||||||||||||
| American Samoa | ||||||||||||
| 2017
(n = 1,254)
|
79.2 | 52.0 | 77.4 | 70.4 | 70.3 | 25.0 | 94.6 | 76.6 | 71.1 | 49.5 | 5.2 | 18.3 |
| 2018 (n = 1,162) |
80.1 | 53.8 | 78.5 | 85.1 | 73.8 | 34.9 | 93.3 | 70.6 | 72.6 | 52.5 | 3.7 | 26.0 |
| 2019 (n = 1,028) |
81.4 | 53.5 | 80.0 | 81.5 | 72.9 | 29.0 | 87.7 | 78.8 | 73.7 | 54.6 | 3.7 | 21.7 |
| 2020 (n = 860) |
84.9 | 51.9 | 84.1 | 77.2 | 78.4 | 33.4 | 96.4 | 86.6 | 74.3 | 54.8 | 4.5 | 26.3 |
| 2021 (n = 832) |
81.5 | 53.4 | 80.4 | 82.7 | 72.7 | 31.4 | 96.9 | 84.3 | 70.1 | 47.7 | 4.9 | 23.8 |
| 2022 (n = 876) |
78.2 | 55.6 | 76.8 | 81.5 | 73.1 | 34.7 | 90.5 | 81.2 | 74.1 | 50.7 | 0.8 | 26.8 |
| 2023 (n = 814) |
88.1 | 65.6 | 86.4 | 85.3 | 85.7 | 63.5 | 95.8 | 90.5 | 86.7 | 65.4 | 2.0 | 50.5 |
| Northern Mariana Islands | ||||||||||||
| 2017 (n = 715) |
87.8 | 67.3 | 87.3 | 88.7 | 84.1 | 51.9 | 89.7 | 91.0 | 84.8 | 62.9 | 53.7 | 46.3 |
| 2018 (n = 723) |
92.1 | 74.0 | 91.4 | 90.5 | 90.5 | 65.7 | 94.1 | 92.9 | 89.6 | 68.7 | 60.4 | 60.0 |
| 2019 (n = 746) |
92.0 | 71.9 | 91.6 | 87.0 | 92.4 | 71.0 | 95.0 | 89.5 | 89.5 | 67.2 | 68.0 | 64.6 |
| 2020 (n = 651) |
92.0 | 68.0 | 91.4 | 86.5 | 92.2 | 68.7 | 94.3 | 92.8 | 89.2 | 66.2 | 72.0 | 61.8 |
| 2021 (n = 603) |
86.1 | 66.8 | 85.4 | 83.1 | 86.4 | 65.0 | 95.9 | 88.9 | 83.6 | 62.9 | 60.9 | 60.0 |
| 2022 (n = 501) |
88.4 | 71.9 | 87.6 | 87.0 | 87.8 | 70.9 | 93.4 | 91.4 | 84.6 | 64.1 | 53.3 | 60.3 |
| 2023 (n = 581) |
81.6 | 66.8 | 81.8 | 78.7 | 80.9 | 63.3 | 96.4 | 85.7 | 78.7 | 60.2 | 55.8 | 57.0 |
| Federated States of Micronesia | ||||||||||||
| 2017 (n = 2,139) |
77.5 | 50.5 | 77.0 | 83.2 | 87.6 | 66.8 | 71.9 | 83.9 | 70.4 | 42.9 | 31.8 | 37.4 |
| 2018 (n = 2,097) |
85.6 | 60.6 | 85.1 | 91.6 | 91.3 | 77.2 | 73.2 | 89.1 | 81.7 | 54.6 | 37.1 | 49.3 |
| 2019 (n = 1,920) |
79.0 | 45.6 | 79.0 | 76.0 | 89.2 | 67.3 | 72.8 | 84.9 | 77.4 | 48.1 | 40.9 | 37.7 |
| 2020 (n = 1,906) |
69.5 | 39.6 | 69.2 | 68.2 | 81.0 | 56.0 | 66.3 | 74.9 | 66.7 | 40.5 | 42.9 | 31.5 |
| 2021 (n = 1,855) |
75.7 | 45.7 | 75.3 | 84.7 | 85.1 | 65.2 | 76.3 | 80.7 | 71.4 | 46.1 | 38.7 | 37.3 |
| 2022 (n = 1,799) |
75.0 | 42.3 | 74.5 | 81.3 | 85.6 | 62.2 | 76.1 | 82.8 | 70.5 | 40.6 | 28.0 | 33.5 |
| 2023 (n = 1,677) |
78.6 | 49.9 | 78.4 | 85.3 | 85.7 | 70.1 | 75.9 | 84.9 | 75.3 | 47.1 | 35.7 | 39.8 |
| Marshall Islands | ||||||||||||
| 2017 (n = 1,074) |
74.9 | 55.9 | 74.5 | 78.3 | 68.3 | 4.6 | 82.1 | 79.7 | 60.1 | 32.7 | 41.9 | 2.2 |
| 2018 (n = 1,142) |
79.6 | 63.9 | 79.3 | 88.7 | 75.4 | 6.6 | 69.9 | 84.1 | 61.9 | 35.6 | 45.7 | 3.4 |
| 2019 (n = 1,072) |
82.2 | 62.4 | 81.6 | 84.4 | 74.9 | 3.5 | 87.8 | 87.1 | 63.2 | 33.3 | 49.9 | 1.8 |
| 2020 (n = 1,004) |
86.1 | 61.9 | 85.7 | 82.7 | 72.4 | 3.8 | 87.0 | 89.0 | 60.9 | 31.5 | 54.5 | 1.1 |
| 2021 (n = 994) |
84.5 | 58.4 | 84.2 | 84.9 | 69.2 | 4.2 | 90.0 | 87.9 | 60.6 | 26.0 | 45.1 | 1.6 |
| 2022 (n = 1,016) |
78.2 | 55.4 | 77.6 | 83.3 | 69.0 | 4.1 | 89.5 | 85.0 | 60.6 | 32.0 | 36.8 | 1.3 |
| 2023 (n = 848) |
85.4 | 68.6 | 85.4 | 88.0 | 79.3 | 9.2 | 91.4 | 90.0 | 74.8 | 46.0 | 53.8 | 4.8 |
| Palau | ||||||||||||
| 2017 (n = 232) |
92.7 | 76.7 | 93.5 | 89.2 | 91.8 | 81.5 | 94.0 | 94.0 | 83.6 | 67.7 | 72.4 | 61.6 |
| 2018 (n = 268) |
95.9 | 85.4 | 95.1 | 95.1 | 96.6 | 89.9 | 96.6 | 96.3 | 90.3 | 76.9 | 82.1 | 72.4 |
| 2019 (n = 234) |
94.0 | 78.6 | 94.0 | 89.3 | 96.2 | 88.5 | 94.0 | 95.3 | 91.9 | 75.6 | 80.3 | 69.2 |
| 2020 (n = 214) |
92.5 | 73.4 | 92.5 | 87.4 | 95.3 | 85.5 | 95.8 | 93.0 | 89.3 | 79.9 | 82.7 | 69.6 |
| 2021 (n = 206) |
97.1 | 84.5 | 97.1 | 96.6 | 98.5 | 89.3 | 98.1 | 98.1 | 93.7 | 67.0 | 55.3 | 61.7 |
| 2022 (n = 158) |
96.8 | 80.4 | 96.8 | 91.1 | 98.7 | 85.4 | 97.5 | 98.1 | 93.0 | 75.3 | 77.9 | 70.9 |
| 2023 (n = 175) |
97.7 | 80.0 | 97.1 | 92.6 | 97.1 | 19.4 | 89.7 | 97.1 | 93.7 | 78.3 | 88.6 | 16.0 |
Table 2. DTaP vaccination coverage* by dose, and percent of doses administered by select age milestones†, among children 19–35 months — U.S.-affiliated Pacific Islands§, 2026
| Vaccination coverage | Percent of doses received before age 3 months | Percent of doses received before age 5 months | Percent of doses received before age 7 months | Percent of doses received before age 13 months | Percent of doses received before age 19 months | |
|---|---|---|---|---|---|---|
| % | ||||||
| American Samoa | ||||||
| Dose 1 | 97.3 | 77.6 | 90.3 | 93.6 | 96.9 | 98.6 |
| Dose 2 | 92.5 | Not applicable | 65.9 | 82.9 | 93.4 | 97.4 |
| Dose 3 | 87.1 | Not applicable | Not applicable | 58.9 | 87.6 | 95.1 |
| Dose 4 | 67.4 | Not applicable | Not applicable | Not applicable | 0.8 | 70.1 |
| Northern Mariana Islands | ||||||
| Dose 1 | 93.2 | 91.5 | 95.9 | 97.4 | 98.1 | 99.1 |
| Dose 2 | 86.9 | Not applicable | 71.7 | 89.4 | 97.1 | 98.4 |
| Dose 3 | 82.6 | Not applicable | Not applicable | 67.1 | 93.1 | 97.1 |
| Dose 4 | 70.7 | Not applicable | Not applicable | Not applicable | 0.9 | 81.6 |
| Federated States of Micronesia | ||||||
| Dose 1 | 97.0 | 64.2 | 74.5 | 81.8 | 93.3 | 97.1 |
| Dose 2 | 90.5 | Not applicable | 48.4 | 60.6 | 84.1 | 94.3 |
| Dose 3 | 82.7 | Not applicable | Not applicable | 38.8 | 67.8 | 88.9 |
| Dose 4 | 53.8 | Not applicable | Not applicable | Not applicable | 8.1 | 59.9 |
| Marshall Islands | ||||||
| Dose 1 | 98.4 | 72.5 | 82.7 | 87.7 | 94.5 | 97.5 |
| Dose 2 | 93.5 | Not applicable | 64.9 | 74.6 | 88.6 | 94.6 |
| Dose 3 | 87.8 | Not applicable | Not applicable | 55.6 | 80.9 | 92.7 |
| Dose 4 | 72.8 | Not applicable | Not applicable | Not applicable | 28.6 | 78.5 |
| Palau | ||||||
| Dose 1 | 100.0 | 98.3 | 98.7 | 99.6 | 100.0 | 100.0 |
| Dose 2 | 100.0 | Not applicable | 90.5 | 96.6 | 97.8 | 99.6 |
| Dose 3 | 97.4 | Not applicable | Not applicable | 82.3 | 94.7 | 96.9 |
| Dose 4 | 81.0 | Not applicable | Not applicable | Not applicable | 1.1 | 85.1 |
Figure
Figure 1. ≥1 MMR vaccination coverage by age 24 months among children born 2017–2023, by jurisdiction and year of birth* — U.S.-affiliated Pacific Islands†
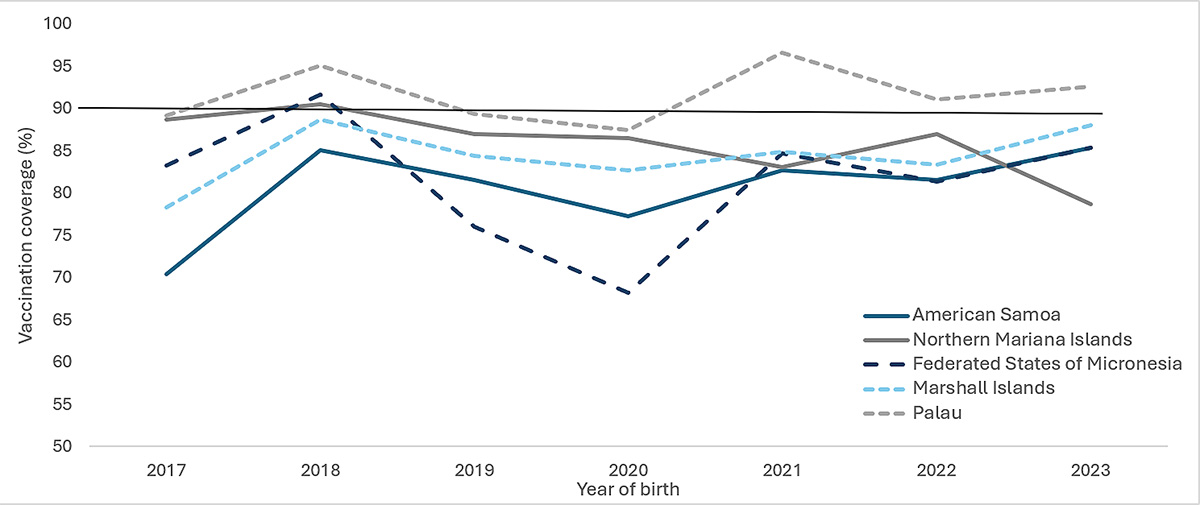
Abbreviations: MMR = measles, mumps, and rubella vaccine.
Solid horizontal black line represents 90% vaccination target set by U.S Healthy People 2030 and the World Health Organization's Immunization Agenda 2030.
*Vaccination status includes vaccine doses received by age 24 months (i.e., before the day the child turns age 24 months). The denominator includes patients with active patient status in the immunization information system as of the date of assessment. Patient active status in the IIS establishes a classification of individual patients within a healthcare organization. Healthcare providers are responsible for vaccinating patients with an active status within their clinic population or geographical catchment area. Patient status is changed to "inactive" when the patient changes providers, moves, or is lost to follow up, or "deceased" if patient death is confirmed through manual review or system linkage with vital statistics or other health records. See https://repository.immregistries.org/files/resources/5835adc2dad8d/mirow_pais_mini-guide.pdf for more details.
†Jurisdictions in this report include American Samoa, the Northern Mariana Islands, Federated States of Micronesia, Marshall Islands, and Palau. Vaccination coverage among children in Guam has been assessed via the National Immunization Survey since 2013; Immunization Information System-based coverage assessment was not conducted for Guam. See https://www.cdc.gov/childvaxview/about/interactive-reports.html for childhood vaccination coverage in Guam.
This page was last updated on this date. Updates may include minor edits, image changes, or other modifications to page content.
The information on this page was last reviewed by subject matter experts to ensure accuracy.
- The United States’ Healthy People (HP) 2030 and the World Health Organization’s (WHO) Immunization Agenda 2030 vaccination objectives include 90% coverage by age 2 years with ≥1 dose of the measles, mumps, and rubella vaccine and ≥4 doses of diphtheria and tetanus toxoids and acellular pertussis vaccine. The WHO’s Immunization Agenda 2030 goals also include an objective of 90% coverage with ≥3 doses of pneumococcal conjugate vaccine.
- The U.S.-affiliated Pacific Islands comprise three U.S. territories (American Samoa, Northern Mariana Islands, and Guam) and three freely associated nations (Federated States of Micronesia, Marshall Islands, and Palau). All jurisdictions receive Section 317 Immunization Program funding, which is a discretionary program to purchase vaccines and support immunization infrastructure. The U.S. territories also receive Vaccines for Children (VFC) funding; VFC is an entitlement program, created by the Omnibus Budget Reconciliation Act (OBRA), that provides vaccines at no cost to eligible children aged ≤18 years through enrolled health care providers. The VFC program is administered in all U.S. states, the District of Columbia, U.S. territories, and select large U.S. metropolitan cities and counties (in addition to their respective state programs), in accordance with Section 1928 of the Social Security Act.
- Jurisdictions in this report include American Samoa, Northern Mariana Islands, Federated States of Micronesia, Marshall Islands, and Palau. Vaccination coverage among children in Guam has been assessed via the National Immunization Survey since 2013; IIS-based coverage assessment was not conducted for Guam. Information on childhood vaccination coverage in Guam is available at https://www.cdc.gov/childvaxview/about/interactive-reports.html for childhood vaccination coverage in Guam.
- Patient active status in the IIS establishes a classification of individual patients within a healthcare organization. Healthcare providers are responsible for vaccinating patients with an "active" status within their clinic population or geographical catchment area. Patient status is changed to "inactive" when the patient changes providers, moves, or is lost to follow up, or "deceased" if patient death is confirmed through manual review or system linkage with vital statistics or other health records. See https://repository.immregistries.org/files/resources/5835adc2dad8d/mirow_pais_mini-guide.pdf for more details.
- The combined 6-vaccine series (4:3:1:3*:3:4) includes ≥4 doses of diphtheria and tetanus toxoids and acellular pertussis vaccine; ≥3 doses of poliovirus vaccine; ≥1 dose of measles-containing vaccine; ≥3 or ≥4 doses (depending on product type) of Haemophilus influenzae type b conjugate vaccine; ≥3 doses of hepatitis B vaccine; and ≥4 doses of pneumococcal conjugate vaccine.
- See e.g., 45 C.F.R. part 46, 21 C.F.R. part 56; 42 U.S.C. §241(d); 5 U.S.C. §552a; 44 U.S.C. §3501 et seq.
- Hib primary series: receipt of ≥2 or ≥3 doses, depending on product type received; full series: primary series and booster dose, which includes receipt of ≥3 or ≥4 doses, depending on product type received.
- Ehreth J. The global value of vaccination. Vaccine. 2003 Jan 30; 21(7–8):596–600. Available from: https://linkinghub.elsevier.com/retrieve/pii/S0264410X02006230
- Vaccination - Healthy People 2030. health.gov. Available from: https://health.gov/healthypeople/objectives-and-data/browse-objectives/vaccination
- Implementing the Immunization Agenda 2030: A Framework for Action through Coordinated Planning, Monitoring & Evaluation, Ownership & Accountability, and Communications & Advocacy. WHO; 2020. Report No.: 4. Available from: https://cdn.who.int/media/docs/default-source/immunization/strategy/ia2030/ia2030_frameworkforactionv04.pdf
- Management of Patient Active/Inactive Status in Immunization Information Systems. Modeling of Immunization Registry Operations Work Group (MIROW); 2015 Apr p. 38. Available from:https://repository.immregistries.org/files/resources/5cf691f15b26e/aira_mirow_miniguide_-_final-0.pdf
- CDC. "Vaccines and Other Immunizing Agents in the Child and Adolescent Immunization Schedule*." Vaccines & Immunizations, 20 Nov. 2024, https://www.cdc.gov/vaccines/hcp/imz-schedules/child-schedule-vaccines.html
- Hill HA, Yankey D, Elam-Evans LD, Chen M, Singleton JA. Vaccination Coverage by Age 24 Months Among Children Born in 2019 and 2020 — National Immunization Survey-Child, United States, 2020–2022. MMWR Morb Mortal Wkly Rep 2023;72:1190–1196. DOI: http://dx.doi.org/10.15585/mmwr.mm7244a3
- Tippins A, Acevedo JC, Palomeque FS, Coy KC, Chadd P, Stowell D, et al. Strategies to strengthen COVID-19 vaccine uptake and improve vaccine equity in U.S. Territories and Freely Associated States during the first six months of vaccine rollout. Vaccine. 2024 May 7. Available from: https://www.sciencedirect.com/science/article/pii/S0264410X24005413
- Kern-Allely S, McGinley HC, Tippins A, Apaisam C, Basilius M, Guerrero ML, Masunu Y, Pangelinan H, Pedro D, Brostrom R, Judicpa P, Hancock WT (2023). How can early COVID-19 vaccine campaigns in the US-affiliated Pacific Islands inform future vaccine efforts: A cross-sectional analysis. BMJ Public Health, 1(1). https://doi.org/10.1136/bmjph-2023-000330
- Routine Immunizations on Schedule for Everyone. CDC, 4 May 2026, https://www.cdc.gov/vaccines/php/rise/index.html.
- Meghani M, Pike J, Tippins A, Leidner AJ. Cost-effectiveness analysis of routine outreach and catch-up campaign strategies for measles, mumps, and rubella vaccination in Chuuk, Federated States of Micronesia. Public Health Rep. 2024 Jun 4 ;00333549241249672. Available from: https://journals.sagepub.com/doi/10.1177/00333549241249672
- Stokley S, Kempe A, Stockwell MS, Szilagyi PG. Improving pediatric vaccination coverage in the United States. Academic Pediatrics. 2021 May; 21(4):S1–2. Available from: https://linkinghub.elsevier.com/retrieve/pii/S187628592100142X
- About the National Immunization Surveys. CDC. 2026. Available from: https://www.cdc.gov/nis/about/