At a glance
Overview
In August 2025, CDC released its respiratory disease season outlook to provide decision-makers with information to assist in public health preparedness during the 2025-2026 respiratory disease season. Two subsequent updates to the respiratory disease season outlook were published in December 2025 and March 2026.
Combined peak hospital burden
In our initial 2025-2026 outlook, published in August 2025, we anticipated that the fall and winter respiratory disease season would likely have a similar number (within 20%) of combined peak hospitalizations due to COVID-19, influenza, and RSV compared to last season. This assessment remained the same in the December and March updates to the outlook. During the 2025-2026 season, the highest combined number of hospitalizations for COVID-19, influenza, and RSV occurred in the week ending January 3, 2026, with 16.6 hospitalizations per 100,000. This peak was lower than, but within 20% of, the peak weekly hospitalization rate during the 2024-2025 respiratory disease season (19.5 hospitalizations per 100,000 during the week ending February 1, 2025) (Figure 1, RESP-NET). While the combined peak was within the expected range stated in our original outlook, the individual disease dynamics during the 2025-2026 season varied in some ways from experts' expectations outlined in our initial outlook.
- COVID-19: The peak hospitalization rate due to COVID-19 occurred during the week ending January 3, 2026, with 2.0 hospitalizations per 100,000. This peak hospitalization rate was substantially lower than the peak that occurred last season (4.2 hospitalizations per 100,000, week ending January 4, 2025). This differed from our initial outlook’s expectation that the peak would be similar to (within 20%) or higher than that of last season, as well as from the December outlook’s expectation that the peak would be similar to that of last season.
- Influenza: The peak hospitalization rate due to influenza occurred during the week ending December 27, 2025, with 13.3 hospitalizations per 100,000. As of April 25, CDC's in-season severity assessment framework classified this season as moderate across all ages, consistent with the original outlook.
- RSV: The peak hospitalization rate due to RSV occurred during the week ending February 21, 2026, with 3.0 hospitalizations per 100,000. This hospitalization rate was approximately 20% lower than the peak that occurred last season (3.9 hospitalizations per 100,000, week ending January 4, 2025), consistent with the original outlook that RSV would be similar (within 20%) to that of last season.

Historically, there has been variability in the timing of the combined peak number of hospitalizations due to COVID-19, influenza, and RSV, as well as the timing of disease-specific peaks. During the 2025-2026 respiratory disease season, the peak hospitalization rate due to RSV occurred in late February, substantially later in the season than in prior seasons, which typically peaked in December or January. RSV illness this season was not more severe compared with recent seasons based on peak RSV hospitalization rates and cumulative hospitalization rates to date. (Figure 2, RESP-NET).

The 2025-2026 respiratory disease season marks the first season with lower COVID-19 activity in some parts of the country compared to prior seasons since SARS-CoV-2 emerged during the 2019-2020 fall and winter respiratory disease season. Influenza caused the majority of hospitalizations during the peak week of combined hospitalizations (week ending January 3, 2026, Figure 3) this season. In recent years, the proportions of hospitalizations due to COVID-19 and RSV during the week with the peak combined number of hospitalizations have decreased, while the proportion of hospitalizations due to influenza during this week has increased (Figure 3, RESP-NET).

COVID-19 scenario modeling
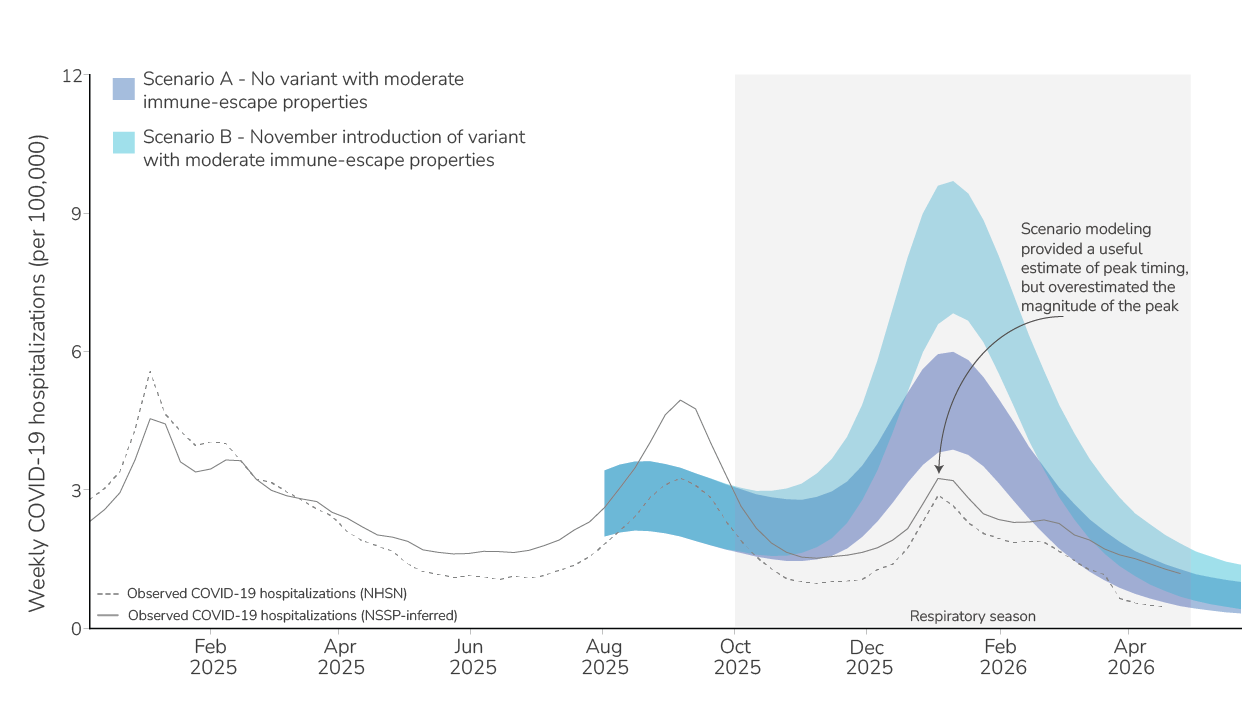
In our initial outlook, we considered two COVID-19 hospitalization burden scenarios for the 2025-2026 respiratory season. These scenarios demonstrated a range of possibilities for how the 2025-2026 season could unfold, based on whether a variant with moderate immune-escape properties emerged (similar to what was observed from variants that emerged in the United States in the previous year). Initial scenario modeling results indicated that a variant with moderate immune-escape properties could impact the magnitude but not the timing of the peak, which aligned with the timing of the peaks in historic seasons.
While the precise magnitude of the COVID-19 peak varies by data sourceA, scenario modeling results from our initial outlook overestimated the magnitude of the COVID-19 peak this season but provided a useful estimate of peak timing (Figure 4). The observed peak number of hospitalizations occurred in the week ending January 4, 2026, which was similar to the scenario modeling median peak date for Scenarios A and B (January 10, 2026). The lower levels of COVID-19 hospitalizations observed during the 2025-2026 respiratory disease season could be due to several factors, which are not mutually exclusive, including:
- High summer 2025 activity: The COVID-19 wave during the summer of 2025 peaked with a higher number of hospitalizations (2.6 per 100,000, week ending September 6, 2025), compared to the respiratory disease season peak (2.0 per 100,000, week ending January 3, 2026). The COVID-19 wave during the fall and winter respiratory disease season may have been lower due to a high level of population immunity from infections that occurred during the preceding summer.
- No new variants with extensive immune-escape properties: The rate of emergence of variants with significant immune-escape properties has slowed in recent years. As of May 4, no new variants with immune-escape properties have been detected at high levels in clinical surveillance during the 2025-2026 respiratory disease season. In our December update, we noted increasing detections of a divergent lineage, BA.3.2, in international surveillance and in U.S. wastewater samples. BA.3.2 contains mutations that suggest a potential for immune escape; however, as of May 4, BA.3.2 is not the predominant variant of SARS-CoV-2 in the United States.
- Lower disease severity:
- Due to lower severity of predominating variants: Hospitalizations may have been lower if predominating SARS-CoV-2 variants have evolved to be less virulent, leading to fewer severe infections and hospitalizations.
- Due to diverse individual-level immunity: A majority of people have some level of immunity to COVID-19 from multiple past infections and vaccinations. The diversity of immunity (e.g. heterogeneous immune histories) within individuals continues to evolve over time from diversity of vaccinations and/or prior infections. Hospitalizations may have been lower during the 2025-2026 respiratory disease season because individuals’ immunity was effective at preventing severe outcomes when infections occurred.
- Reduced case reporting: Decreases in testing for SARS-CoV-2 infection in hospitals or decreases in hospitals reporting to national surveillance systems could contribute to lower reported numbers of hospitalizations due to COVID-19.
- COVID-19 hospitalization data availability has changed over time, and the magnitude of the fall and winter respiratory season peak varies among data sources. In our initial outlook, the COVID-19 scenario model was calibrated using hospitalizations inferred from emergency department data from the National Syndromic Surveillance System. However, in recent months, our method of inferring hospitalizations from emergency department visits (solid gray line, Figure 3) has diverged from hospitalizations reported through the National Healthcare Safety Network (dotted gray line, Figure 3). When the model is re-calibrated to NHSN data, fall and winter scenario projections do not change substantially (unpublished data).