Incidence of Selected Cancers in Non-Hispanic American Indian and Alaska Native Adolescent and Young Adult (AYA) Populations, 1999–2019 (Purchased/Referred Care Delivery Areas)
U.S. Cancer Statistics Data Briefs, No. 32
November 2022
This data brief uses the most recent data available at the time of publication. More recent data may be available in a newer data brief or in the U.S. Cancer Statistics Data Visualizations tool.
Incidence rates for cancers in adolescents and young adults (AYAs) increased from 1999 to 2019 in non-Hispanic American Indian and Alaska Native (AI/AN) populations. Incidence rates for AYA cancers also varied by geographic region. Female breast, thyroid, male testicular, lymphomas, colorectal, and female cervical cancer were the most common cancers among AYAs in AI/AN populations. The highest incidence rates for these cancers were seen in the Southern Plains, while the lowest incidence rates were observed in the East in both AI/AN females and males.
Purchased/Referred Care Delivery Areas (PRCDA) are counties that contain federally recognized tribal lands or are adjacent to tribal lands. Race classification for the AI/AN population is more accurate in these counties. Please see CDC’s Data Visualizations tool technical notes for more details.
AYA cancers are defined as cancers diagnosed among people aged 15 to 39 years.1 Many cancers in AYAs are biologically distinct1,2 from cancers in older adults and children. AYAs who have had cancer are more likely to experience long-term effects and late effects1 such as secondary cancers.3 Research is limited for AYA cancers, especially in AI/AN populations,4 but recent studies have shown that rates of AYA cancers have increased over time3 in the United States. Understanding the distribution of these cancers in AI/AN populations may help improve cancer prevention and control strategies. It may also lead to improved care for cancer survivors.1–4 This data brief analyzes the percent distribution, rates, and trends of common AYA cancers in AI/AN populations in PRCDA counties across the United States.
For this data brief, we used the AYA site recode adapted from Barr.5 Cancers selected for the data brief are based on the six most common cancers found in AYA AI/AN males and females combined.
Distribution of Selected AYA Cancers, 1999 to 2019
aPercentages may not add up to 100% due to rounding
bAYA refers to adolescents and young adults aged 15 to 39. AYA cancers were identified using a classification scheme adapted from R.D. Barr and colleagues. Present analysis includes malignant cancers only. Cancers selected for the data brief are based on the six most common cancers in found in AYA AI/AN males and females combined.
cAI/AN refers to non-Hispanic American Indian and Alaska Native people living in Purchased/Referred Care Delivery Area (PRCDA) counties.
From 1999 to 2019, a total of 8,390 cancer cases were reported among AI/AN AYA populations in PRCDA counties, with 3,264 among males and 5,126 among females.
- The leading AYA cancers among AI/AN males were testis (24.7%), lymphomas (12.0%), and colorectal (8.6%) cancer.
- The leading AYA cancers among AI/AN AYA females were breast (19.2%), thyroid (17.6%), and cervical (10.5%) cancer.
Rates by Sex and Region
aRates are per 100,000 people and are age-adjusted to the 2000 U.S. standard population.
bAYA refers to adolescents and young adults aged 15 to 39. Cancers among AYAs were identified using a classification scheme adapted from R.D. Barr and colleagues. Present analysis includes malignant cancers only. Cancers selected for the data brief are based on the six most common cancers in found in AYA AI/AN males and females combined.
c“All cancer sites combined” means all malignant AYA cancers, specifically site codes 1–11 used in AYA site recode by R.D. Barr.
dAI/AN refers to non-Hispanic American Indian and Alaska Native people living in Purchased/Referred Care Delivery Area (PRCDA) counties.
From 1999 to 2019, among AI/AN AYA populations in PRCDA counties—
- Rates of most AYA cancers were higher among AI/AN females compared to AI/AN males.
- Testicular cancer was the most common cancer among AI/AN males, and rates ranged from 8.3 in the East to 14.7 in the Pacific Coast.
- Breast cancer was the most common cancer among AI/AN females in every region except the Southwest, where thyroid cancer was the most common. Rates of breast cancer ranged from 11.9 in the Southwest to 30.8 in Alaska.
- Rates of thyroid cancer ranged 0.5 in the East to 4.6 in the Northern Plains among AI/AN males and from 12.7 in the Southwest to 18.5 in Alaska among AI/AN females.
- Rates of lymphomas ranged 4.1 in the Southwest to 9.6 in the Southern Plains among AI/AN males and from 3.4 in the Southwest to 7.2 in the Southern Plains among AI/AN females.
- Rates of colorectal cancer ranged from 1.3 in the East to 7.8 in Alaska among AI/AN males and 3.7 in the East to 7.9 in the Southern Plains among AI/AN females.
Differences by Year of Diagnosis
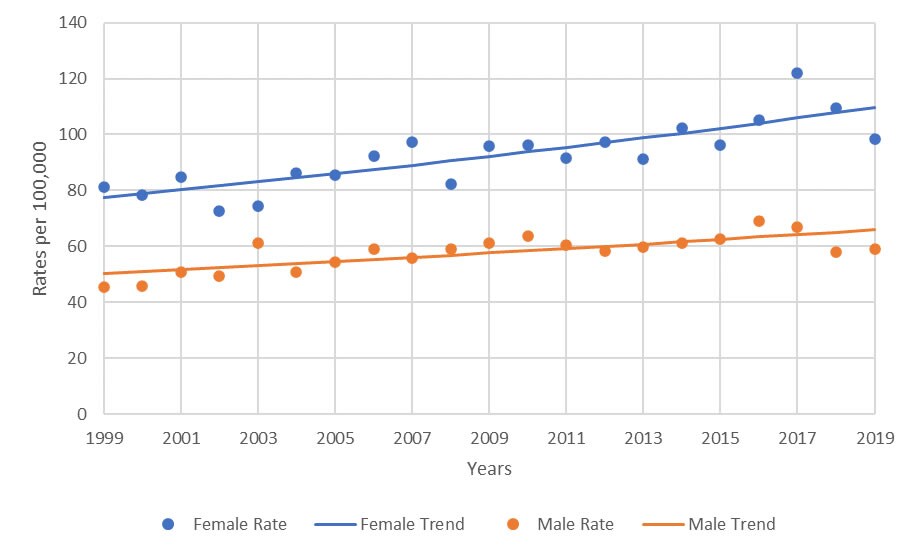
Average Annual Percent Change (AAPC)c
Female AAPC 1999 to 2019: 1.8%, p-value <0.001
Male AAPC 1999 to 2019: 1.4%, p-value <0.001
aAYA refers to adolescents and young adults aged 15 to 39. Cancers among AYAs were identified using a classification scheme adapted from R.D. Barr and colleagues. Present analysis includes malignant cancers only. Cancers selected for the data brief are based on the six most common cancers in found in AYA AI/AN males and females combined.
bAI/AN refers to non-Hispanic American Indian and Alaska Native people living in Purchased/Referred Care Delivery Area (PRCDA) counties.
cAAPC refers to average annual percent change, calculated using joinpoint regression. A p-value <0.05 indicates a significant trend.
Rates of AYA cancers increased by 1.8% annually among AI/AN females and 1.4% annually among AI/AN males between 1999 and 2019. There were 212 AYA cancers among AI/AN females in 1999 and 274 AYA cancers in 2019, while among AI/AN males, there were 117 AYA cancers in 1999 and 174 AYA cancers in 2019.
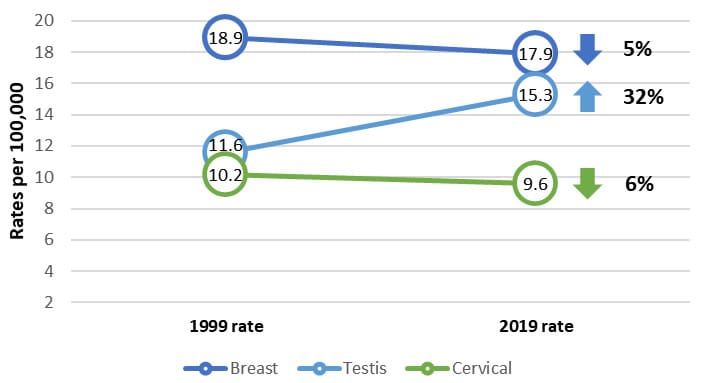
Sex-Specific Cancers
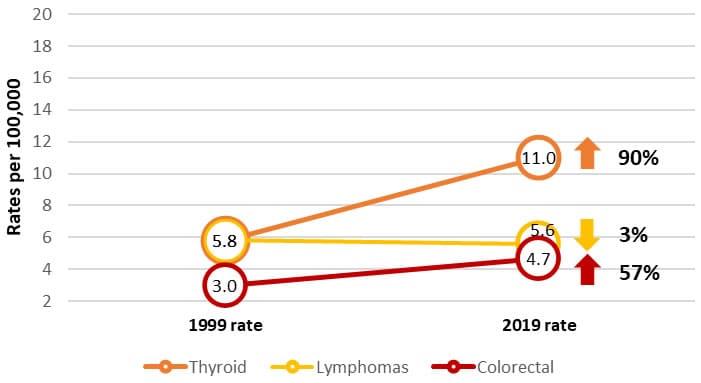
Male and Female
Abbreviation:
NS: Not significant
aRates are per 100,000 people and are age-adjusted to the 2000 standard U.S. population. The change in rates was calculated as the total percent change from the rate in 1999 to the rate in 2019.
bAYA refers to adolescents and young adults aged 15 to 39. Cancers among AYAs were identified using a classification scheme adapted from R.D. Barr and colleagues. Present analysis includes malignant cancers only. Cancers selected for the data brief are based on the six most common cancers in found in AYA AI/AN males and females combined.
cAI/AN refers to non-Hispanic American Indian and Alaska Native people living in Purchased/Referred Care Delivery Area (PRCDA) counties.
dSex-specific cancers refer to breast (female), testis (male), and cervical (female).
eAAPC refers to average annual percent change, calculated using joinpoint regression. AAPCs reported represent significant changes in cancer incidence trends.
From 1999 to 2019—
- Incidence rates of breast and cervical cancer decreased by 5% and 6% respectively, while testicular cancer increased by 32% among AI/AN AYA populations.
- Incidence rates of colorectal and thyroid cancer increased by 57% and 90% respectively, while rates of lymphomas decreased by 3% among AI/AN AYA populations.
- On average, the testicular cancer incidence rate increased by 1.6% per year among AI/AN AYA males.
- On average, colorectal and thyroid cancer incidence rates increased by 3% and 4.5% per year respectively among AI/AN AYA populations.
Data Sources
Data in this brief are from U.S. Cancer Statistics, the official federal cancer statistics.
Data are from the U.S. Cancer Statistics American Indian and Alaska Native Incidence Analytic Database. This database includes data from cancer registries participating in CDC’s National Program of Cancer Registries or the National Cancer Institute’s Surveillance, Epidemiology, and End Results program that have been linked with the Indian Health Service Patient Registration Database. These linkages address racial misclassification of the non-Hispanic AI/AN population in the central cancer registries using previously validated methodologies6. These data met quality criteria for 1999 to 2019.
References
1Miller KD, Fidler‐Benaoudia M, Keegan TH, Hipp HS, Jemal A, Siegel RL. Cancer statistics for adolescents and young adults, 2020. CA: A Cancer Journal for Clinicians 2020;70(6):443–459.
2Ries L, Trama A, Nakata K, Gatta G, Botta L, Bleyer A. Cancer Incidence, Survival, and Mortality Among Adolescents and Young Adults. In: Bleyer A, Barr R, Ries L, Whelan J, Ferrari A, eds. Cancer in Adolescents and Young Adults. Pediatric Oncology. Springer International Publishing; 2017:7–42.
3Burkhamer J, Kriebel D, Clapp R. The increasing toll of adolescent cancer incidence in the U.S. PLoS ONE 2017;12(2):e0172986.
4Weir HK, Jim MA, Marrett LD, Fairley T. Cancer in American Indian and Alaska Native young adults (ages 20 44 years): U.S., 1999 2004. Cancer 2008;113(S5):1153–1167.
5Barr RD, Holowaty EJ, Birch JM. Classification schemes for tumors diagnosed in adolescents and young adults. Cancer 2006;106(7):1425–1430.
6Espey DK, Wiggins CL, Jim MA, Miller BA, Johnson CJ, Becker TM. (2008) Methods for improving cancer surveillance data in American Indian and Alaska Native populations. Cancer. 113:1120–30.
Centers for Disease Control and Prevention. Incidence of Selected Cancers in Non-Hispanic American Indian and Alaska Native Adolescent and Young Adult Populations, 1999–2019 (Purchased/Referred Care Delivery Areas). USCS Data Brief, no. 32. Atlanta, GA: Centers for Disease Control and Prevention, US Department of Health and Human Services; 2022.